. 2016 Nov 23:6:37657.
doi: 10.1038/srep37657.

ENSO's far reaching connection to Indian cold waves

Affiliations

ENSO's far reaching connection to Indian cold waves

J V Ratnam et al. Sci Rep. .

Abstract

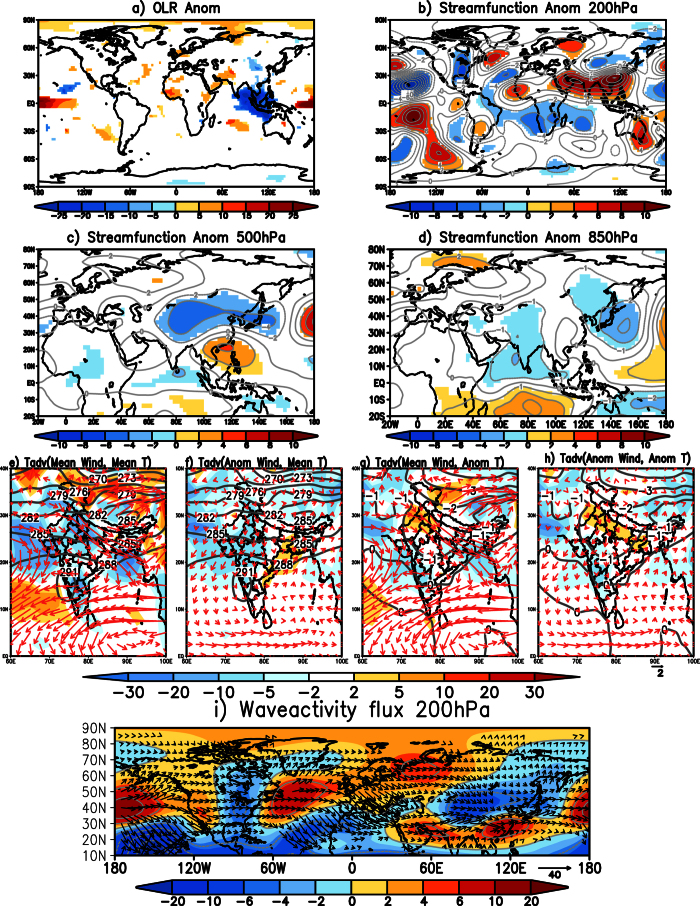
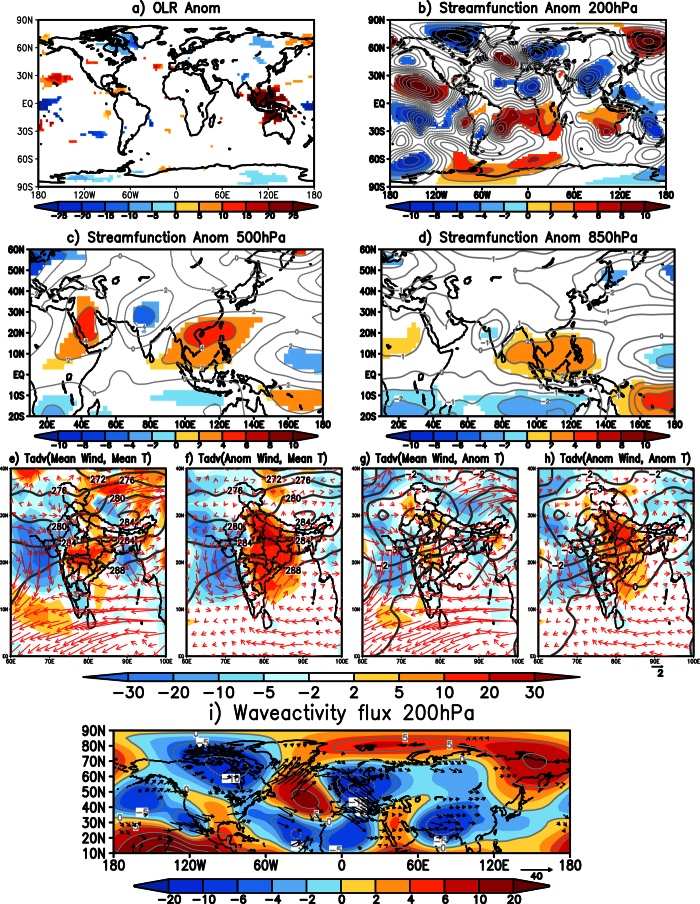
During boreal winters, cold waves over India are primarily due to transport of cold air from higher latitudes. However, the processes associated with these cold waves are not yet clearly understood. Here by diagnosing a suite of datasets, we explore the mechanisms leading to the development and maintenance of these cold waves. Two types of cold waves are identified based on observed minimum surface temperature and statistical analysis. The first type (TYPE1), also the dominant one, depicts colder than normal temperatures covering most parts of the country while the second type (TYPE2) is more regional, with significant cold temperatures only noticeable over northwest India. Quite interestingly the first (second) type is associated with La Niña (El Niño) like conditions, suggesting that both phases of ENSO provide a favorable background for the occurrence of cold waves over India. During TYPE1 cold wave events, a low-level cyclonic anomaly generated over the Indian region as an atmospheric response to the equatorial convective anomalies is seen advecting cold temperatures into India and maintaining the cold waves. In TYPE2 cold waves, a cyclonic anomaly generated over west India anomalously brings cold winds to northwest India causing cold waves only in those parts.


Conflict of interest statement

The authors declare no competing financial interests.

Figures

Figure 1
Figure 1
(a) Standard deviation of the Tmin (°C) from 1st Nov to 28th Feb over the period 1982 to 2013. (b) Spatial distribution of significant SST (°C) anomalies during TYPE1 events. (c) same as (b) but for TYPE2 events. (d) Significant Tmin (°C) anomalies associated with TYPE1 events (e) same as (d) but associated with TYPE2 events. (f) The first mode of EOF of Tmin anomalies. (g) The second mode of EOF of Tmin anomalies. (h–k) Significant air temperature anomalies (°C) at 1000 hPa, 850 hPa, 500 hPa and 300 hPa respectively during TYPE1 events. (l–o) Significant air temperature anomalies (°C) at 1000 hPa, 850 hPa, 500 hPa and 300 hPa during TYPE2 cold wave events. Significance is at 99% using two-tailed Student’s t-test. The rectangular box in (a), (f) and (g) represents the region used to identify the cold wave events over India. (Figure was created using a free software Grid Analysis and Display System (GrADS) version 2.1.a3 (http://cola.gmu.edu/grads/downloads.php)).
Figure 2
Figure 2
(a) Significant OLR (W/m2) anomalies of the composite of TYPE1 cold wave events. (b,c and d) same as (a) but for significant eddy streamfunction (×106 m2 s−1; shaded) at 200 hPa, 500 hPa and 850 hPa levels respectively. (e) Horizontal temperature advection (shaded; ×10−6 °Ks−1) of mean temperature by mean winds at 850 hPa during TYPE1 events. Contours represent mean temperatures and mean wind at 850 hPa is shown by vectors (f) same as (e) but advection of mean temperature by anomalous wind (shaded). Mean temperature (contour) and anomalous winds (vectors) are also shown (g) same as (e) but advection of anomalous temperature by mean winds (shaded). 850 hPa temperature anomalies are shown as contours and mean winds as vectors (h) same as (e) but advection of anomalous temperature by anomalous winds (shaded). Contours represent temperature anomalies and vectors represent anomalous winds at 850 hPa (i) Significant wave activity flux anomalies at 200 hPa (vector; either zonal or meridional component is significant) and the streamfunction anomalies (shaded) for TYPE1 cold wave events. Significance is at 99% using two-tailed Student’s t-test. (Figure was created using a free software Grid Analysis and Display System (GrADS) version 2.1.a3 (http://cola.gmu.edu/grads/downloads.php)).
Figure 3
Figure 3
(a) Significant OLR anomalies composited over Dec–Feb months during the La Niña years over the period 1982 to 2013. (b) same as (a) but is for significant eddy streamfunction (×106 m2 s−1) anomalies at 850 hPa and significant wind anomalies (vectors; either zonal or meridional component is significant). Significance is at 90% using two-tailed Student’s t-test. (Figure was created using a free software Grid Analysis and Display System (GrADS) version 2.1.a3 (http://cola.gmu.edu/grads/downloads.php)).
Figure 4
Figure 4
(a) Composite of significant eddy streamfunction (×106 m2 s−1) anomalies at 850 hPa five days before TYPE1 events (DAY-5). (b,c and d) same as (a) but four days (DAY-4) before, two days (DAY-2) before and on the day (DAY0) respectively of the TYPE1 event. (e–h) same as (a–d) but for TYPE2 cold wave events. Significance is at 90% using two-tailed Student’s t-test. (Figure was created using a free software Grid Analysis and Display System (GrADS) version 2.1.a3 (http://cola.gmu.edu/grads/downloads.php)).
Figure 5
Figure 5
Composite of significant eddy streamfunction (×106 m2 s−1) anomalies of TYPE1 events associated with blocking in the Ural-Siberia region at (a) 500 hPa and (c) 850 hPa. (b and d) are same as (a and c) respectively but for TYPE1 events not associated with blocking over Ural-Siberia region. (e) is same as (c) but for temperature anomalies (oC). (f) same as (d) but for temperature anomalies. Significance is at 99% using two-tailed Student’s t-test. (Figure was created using a free software Grid Analysis and Display System (GrADS) version 2.1.a3 (http://cola.gmu.edu/grads/downloads.php)).
Figure 6
Figure 6. Composite of significant 850 hPa eddy streamfunction (×106 m2 s−1) anomalies of blocking events during La Niña years over higher latitudes not associated with TYPE1 cold wave events over India.
Significance is at 90% using two-tailed Student’s t-test. (Figure was created using a free software Grid Analysis and Display System (GrADS) version 2.1.a3 (http://cola.gmu.edu/grads/downloads.php)).
Figure 7
Figure 7. Same as Fig. 2 but for TYPE2 events.
(Figure was created using a free software Grid Analysis and Display System (GrADS) version 2.1.a3 (http://cola.gmu.edu/grads/downloads.php)).
Figure 8
Figure 8
(a) Eddy streamfunction (×106 m2 s−1) anomalies at 200 hPa for the event 5 of TYPE2 (Table 2). (b) same as (a) but for event 7 of TYPE2 (Table 2). (c) same as (a) but temperature (°C) anomalies at 1000 hPa. (d) same as (b) but for temperature anomalies at 1000hPa. (Figure was created using a free software Grid Analysis and Display System (GrADS) version 2.1.a3 (http://cola.gmu.edu/grads/downloads.php)).

References

    1. Ding Y. & Sikka D. R. Synoptic systems and weather In The Asian Monsoon (ed. Bin Wang), 131–194 (Springer, 2006).
    1. Bedekar V. C., Dekate M. V. & Banerjee A. K. Heat and Cold waves in India. India Meteorological Department Forecasting Manual. IV-6, 63 pp. (available at http://www.imdpune.gov.in/Weather/reports.html) (Accessed: 18th October 2016) (1974).
    1. Rao Y. P. & Srinivasan V. D. Discussion of typical synoptic situations: Winter-Western disturbances and their associated features. India Meteorological Department Forecasting Manual. III-1.1, 131 pp. (available at http://www.imdpune.gov.in/Weather/reports.html) (Accessed: 18th October 2016) (1969).
    1. Chand R. & Singh C. Movements of western disturbance and associated cloud convection. J. Ind. Geophys. Union. 19, 62–70 (2015).
    1. De U. S., Dube R. K. & Prakasa Rao G. S. Extreme weather events over India in the last 100 years. J. Ind. Geophys. Union. 9, 173–187 (2005).

Publication types

LinkOut - more resources