. 2016 Nov 8:10:504.
doi: 10.3389/fnins.2016.00504. eCollection 2016.

Extended Postnatal Brain Development in the Longest-Lived Rodent: Prolonged Maintenance of Neotenous Traits in the Naked Mole-Rat Brain

Affiliations

Extended Postnatal Brain Development in the Longest-Lived Rodent: Prolonged Maintenance of Neotenous Traits in the Naked Mole-Rat Brain

Miranda E Orr et al. Front Neurosci. .

Abstract

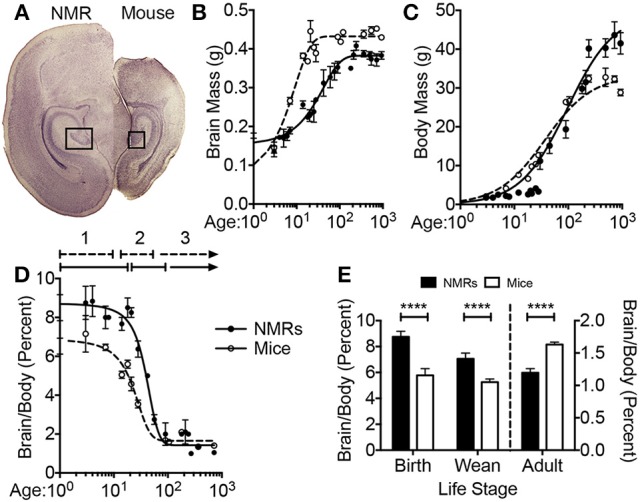
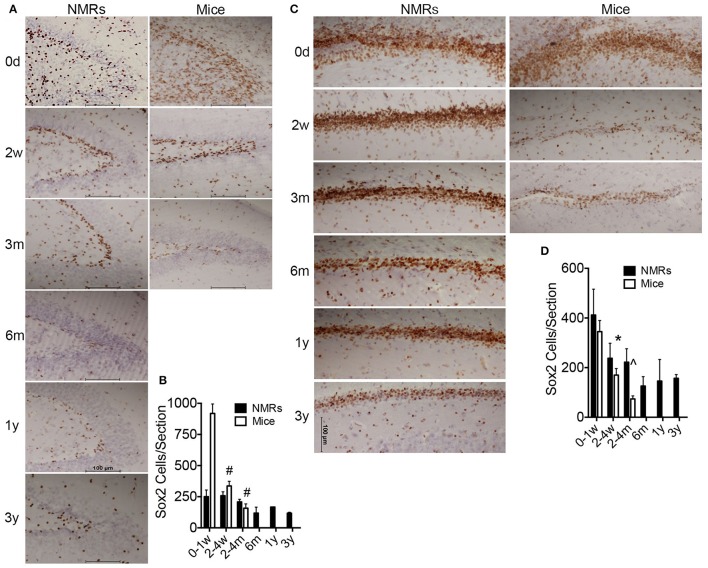
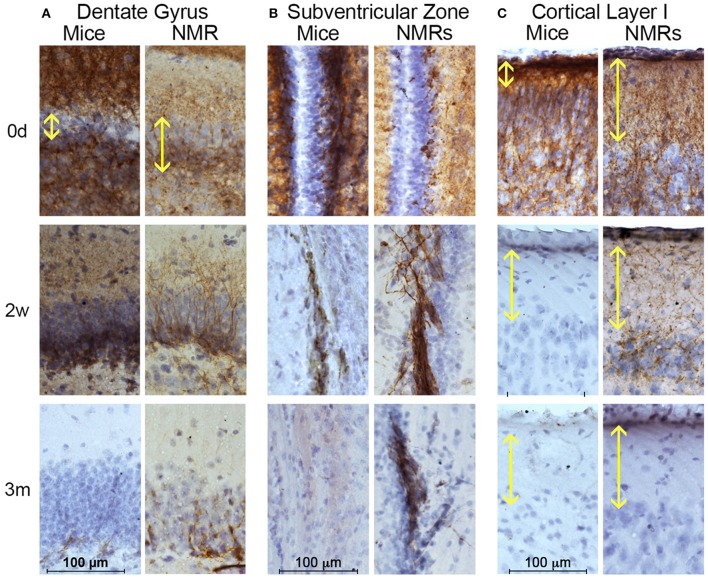
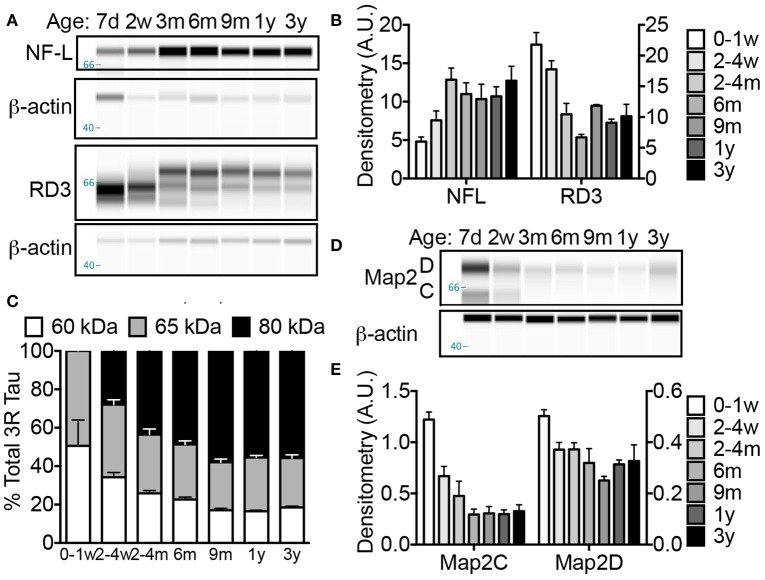
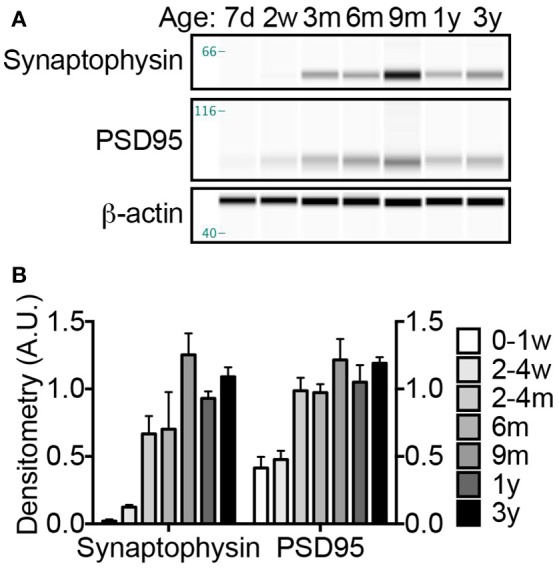
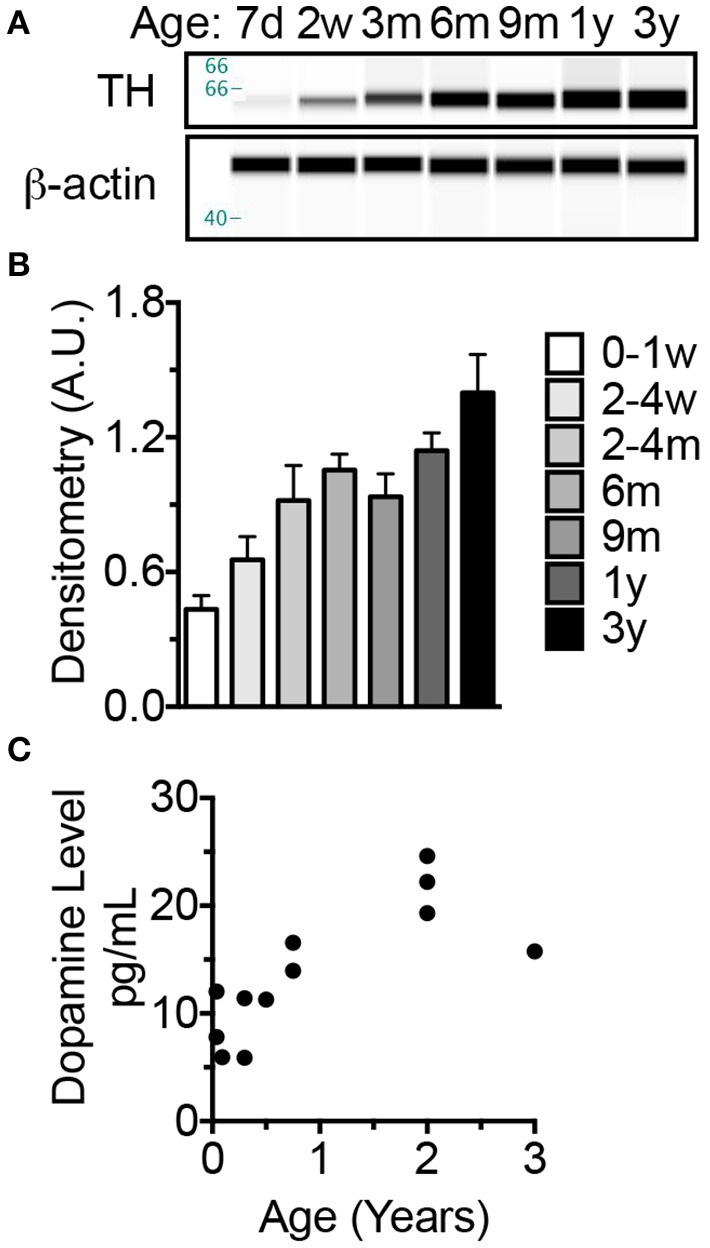
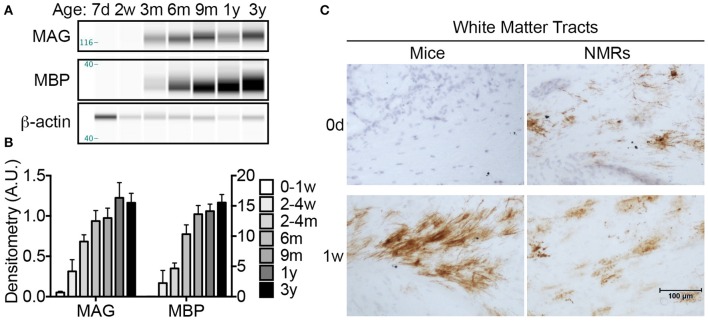
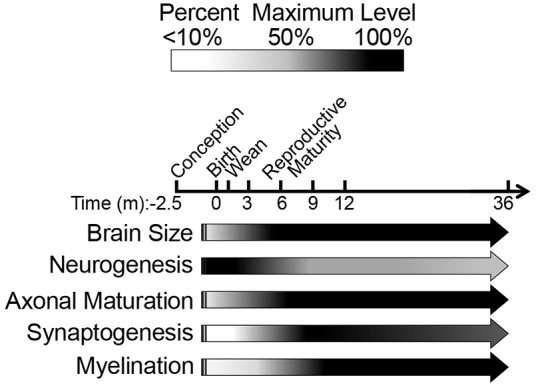
The naked mole-rat (NMR) is the longest-lived rodent with a maximum lifespan >31 years. Intriguingly, fully-grown naked mole-rats (NMRs) exhibit many traits typical of neonatal rodents. However, little is known about NMR growth and maturation, and we question whether sustained neotenous features when compared to mice, reflect an extended developmental period, commensurate with their exceptionally long life. We tracked development from birth to 3 years of age in the slowest maturing organ, the brain, by measuring mass, neural stem cell proliferation, axonal, and dendritic maturation, synaptogenesis and myelination. NMR brain maturation was compared to data from similar sized rodents, mice, and to that of long-lived mammals, humans, and non-human primates. We found that at birth, NMR brains are significantly more developed than mice, and rather are more similar to those of newborn primates, with clearly laminated hippocampi and myelinated white matter tracts. Despite this more mature brain at birth than mice, postnatal NMR brain maturation occurs at a far slower rate than mice, taking four-times longer than required for mice to fully complete brain development. At 4 months of age, NMR brains reach 90% of adult size with stable neuronal cytostructural protein expression whereas myelin protein expression does not plateau until 9 months of age in NMRs, and synaptic protein expression continues to change throughout the first 3 years of life. Intriguingly, NMR axonal composition is more similar to humans than mice whereby NMRs maintain expression of three-repeat (3R) tau even after brain growth is complete; mice experience an abrupt downregulation of 3R tau by postnatal day 8 which continues to diminish through 6 weeks of age. We have identified key ages in NMR cerebral development and suggest that the long-lived NMR may provide neurobiologists an exceptional model to study brain developmental processes that are compressed in common short-lived laboratory animal models.

Keywords: Heterocephalus glaber; comparative biology; naked mole-rat; neoteny; neurogenesis; synaptogenesis; tau.


Figures

Figure 1
Figure 1
Naked mole-rat brain growth significantly differs from mice. (A) Newborn naked mole-rat (NMR) brains are twice as large as newborn mouse brains; shown are 4x images of 30 μm coronal brain sections stained with hematoxylin. The rectangle outlines the dentate gyrus of the hippocampi from each respective species. (B) Plotting brain mass against age reveals a dramatically different brain growth rate between species. Mouse brains are ~17% of adult mass at birth but by 2 weeks attain 90% of adult brain mass. NMRs brains are ~41% of adult size at birth but do not reach 90% adult mass until 3 months of age. (C) The age of somatic growth surge is similar between species and may reflect the age at which they begins to eat solids (3 weeks in mice vs. 3–6 weeks in NMRs). (D) Plotting the percentage of brain mass to body mass against age illustrates 3 distinct phases of development (1, 2, 3), that differ in length of time between species. The first static phase (1) last twice as long in NMRs as mice (4 and 2 weeks, respectively). The second phase (2) lasts 2 weeks in mice but 9 weeks in NMRs giving rise to the final phase of maintained body and brain mass beginning at 4 weeks in mice and 3 months in NMRs. (E) NMR brains are signifianctly larger than mice, even when normalized to body mass, through the age of weaning. However, adult NMR brains are significantly smaller than mice especially when accounting for body mass. (Student's t-test ****: p < 0.0001).
Figure 2
Figure 2
Newborn naked mole-rat brains are born with fewer Sox2 positive neural stem cells than mice yet maintain neurogenic capacity longer than mice. (A) Dentate gyrus from naked mole-rat (NMR) and mouse brains immunostained with Sox2 antibody and hematoxylin counterstain illustrate that newborn NMR dentate gyrus contains fewer Sox2 positive cells than newborn mice and instead appears more organized with clear lamination, even more-so than 1 week old mice. (B) Quantification of Sox2 positive cells indicate that at birth mice contain ~5x more Sox2 positive cells than NMRs. The level of Sox2 significantly decreases in mice and levels in the 2–4 weeks old cohort are similar between species. Levels of mouse Sox2 expression are significantly higher in newborns than all other cohorts (ANOVA, a: p < 0.0001). Significant differences in NMRs are not observed. (C) Images of subventricular zone from NMRs and mice stained with Sox2 reveals a similar density of Sox2 positive cells between species at birth; however mice quickly deplete this stem cell population as very few cells are evident by 2 weeks of age while NMRs maintain steady levels even into young adulthood. (D) Quantification of subventricular zone Sox2 positive cells indicate that mice quickly deplete this stem cell population as a significant decrease is observed between birth and the older cohorts in both regions (ANOVA, #p < 0.0001; ∧p = 0.0003; *p = 0.0043). Significant differences among NMR ages are not observed.
Figure 3
Figure 3
Naked mole-rats are born with more mature brains than mice yet maintain neuronal plasticity longer than mice. Naked mole-rat (NMR) and mouse brains were stained with newborn neuron marker doublecortin (DCX) and counterstained with hematoxylin. Immunostaining indicates that NMRs maintain DCX-positive cells in neurogenic (A) dentate gyrus and (B) subventricular as well as (C) cortex longer than mice. (A) Specifically, the newborn NMR dentate gyrus contains clearly defined cell layers with lower DCX-staining than newborn mice indicating greater in utero brain development in NMRs than mice. In both species, DCX-positive dentate gyrus cells become rare by 3 months of age. (B) Immunoreactivity is evident in NMR subventricular through 6 months of age, but becomes rare in 3-month-old mice. (C) Mice display poorly defined cortical organization until 2 weeks of age. In contrast, even at birth, NMRs exhibit a well-developed cortical layer I (yellow double arrow). By 2 weeks of age, mouse cortical DCX immunoreactivity is lost but it persists in NMRs. (B) Scale bar: 100 μm.
Figure 4
Figure 4
Naked mole-rat brains attain stable adult levels of key neuronal markers at 6 months of age. (A) Artificial capillary electrophoresis (CE) immunoblot reveals that while levels of axonal protein neurofilament light chain (NF-L), increases dramatically during the first 3 months of postnatal development, a simultaneous decrease in axonal three-repeat tau protein occurs. (B) Densitometric normalization to β-actin and statistical analyses indicates that both NF-L and RD3 levels change significantly during the first 3 years of life (ANOVA, p = 0.0002; p < 0.0001, respectively). Significance is reached with both axonal markers between birth and 2–4 months with an increase in NF-L (168%; p = 0.0002) and decrease in RD3 (52%; p < 0.0001). (C) Tau protein isoform distribution also changes with age as indicated by a transition in RD3 tau isoform expression from 1:1 low molecular weight 60:65 kDa during the first week of life to more prevalent high molecular weight tau 80 kDa species accounting for 50–60% of total RD3 protein at ages 6 months and older. (D) CE immunoblots were generated by probing naked mole-rat brain homogenates with an antibody directed against total microtubule associated protein 2 (Map2) dendritic proteins. (E) Analysis of densitometric normalization to β-actin loading control indicates a significant decline in Map2C and D during the first 3 years of life (ANOVA, p < 0.0001, and p = 0.0010, respectively). The expression of Map2C decreases immediately by 2–4 weeks (ANOVA, p = 0.0043) while the decrease in Map2D does not reach significance until 6 months (p = 0.0074). (d, days; w, weeks; m, months; y, years).
Figure 5
Figure 5
Synaptogenesis increases dramatically at 2–4 months; refinement continues throughout the first 3 years of life. (A) Synaptogenesis was assessed by immunoblotting brain homogenates with antibodies against presynaptic protein, synaptophysin, and postsynaptic protein, PSD95. (B) Densitometric values were calculated by normalizing to β-actin loading control. Significant changes in both synaptic proteins occur during the first 3 years of life (ANOVA, p < 0.0001 for both). A significant increase in both synaptophysin and PSD95 occurs between birth and 2–4 months (ANOVA, p = 0.0353, and p = 0.0002, respectively). ANOVA posthoc analyses indicate that animals over 2–4 months do not exhibit significantly different levels of either synaptophysin or PSD95; however Student's t-test between 2 and 4 months and older animals indicate a significant increase in synaptophsyin with the 9-month and 3-year-old NMRs (187% increase, p = 0.0326; 163% increase, p = 0.0089), but not on 1-year-old NMRs (p = 0.0936). Notably, levels of both synaptophysin and PSD95 decrease between 9 months and 1 year, 35 and 16%, respectively. (d, days; w, weeks; m, months; y, years).
Figure 6
Figure 6
The increase in dopamine trails that of tyrosine hydroxylase which, like long-lived primates exhibits an overshoot before decreasing to adult levels. (A) Tyrosine hydroxylase (TH), a key enzyme involved in synthesizing monoamine neurotransmitters, levels were measured by capillary electrophoresis (CE) immunoblotting. (B) Statistical analyses on densitometric normalized values indicate a significance increase at 2–4 months of age (p = 0.0429). Levels do not significantly change between 4 months and 3 years. (C) ELISA measures of brain homogenate dopamine indicate an increase in levels through 2 years of age then a decrease at 3 years of age.
Figure 7
Figure 7
Myelination begins in utero in naked mole-rat but not mice. (A) Artificial immunoblots were generated with capillary electrophoresis by probing naked mole-rat (NMR) brain homogenates with antibodies directed against myelin associated glycoprotein (MAG) and myelin basic protein (MBP). Each isoform was normalized to β-actin. (B) Densitometric values were calculated by normalizing to β-actin loading control. Statistical analyses reveal significant changes during the first 3 years of life for both proteins (ANOVA, p < 0.0001 for both). MAG levels increase significantly from nearly undetectable in newborns to 1233% increase by 2–4 months of age (ANOVA, p = 0.0004). MAG increases significantly again between 2 and 4 months and 1 year of age (79%, p = 0.016). MBP expression was slightly delayed and a significant increase was not apparent until 6 months of age (p = 0.006), and another significant jump between 2 and 4 months and 9 months (192%, p = 0.0112). (C) Immunohistochemistry with anti-MAG antibody revealed that myelination initiates in white matter prior to birth in NMRs as evidenced by positive staining in newborn pups; however MAG immunostaining is not evident in mice until 1 week of age. (d, days; w, weeks; m, months; y, years).
Figure 8
Figure 8
Schematic summary of naked mole-rat brain development illustrates the major developmental milestones. Our data, spanning from birth through the first 3 years of life, are represented by arrows. The black/white scale indicates percentage of maximum level (black) of each variable assessed, whereas the vertical lines before birth (gestation) represent hypothesized levels of each developmental measure based on newborn data. The majority of developmental changes occur during the first 3 months of age as indicated by a decline in NF-L and three-repeat tau expression. High molecular weight three-repeat tau predominates beyond 6 months of age. Protein markers of synaptogenesis become evident at 3 months of age and synaptogenesis become evident at 3 months of age, peak at 9 months, and decrease through 3 years of age. While NMR brains display myelination at birth, a steady increase continues through 1 year of age.

Similar articles

Cited by

References

    1. Adler G. H., Levins R. (1994). The Island syndrome in rodent populations. Q. Rev. Biol. 69, 473–490. 10.1086/418744 - DOI - PubMed
    1. Alberch P., Gould S. J., Oster G. F., Wake D. B. (1979). Size and shape in ontogeny and phylogeny. Paleobiology 5, 296–317. 10.1017/S0094837300006588 - DOI
    1. Altman J., Bayer S. A. (1990). Migration and distribution of two populations of hippocampal granule cell precursors during the perinatal and postnatal periods. J. Comp. Neurol. 301, 365–381. 10.1002/cne.903010304 - DOI - PubMed
    1. Amrein I., Becker A. S., Engler S., Huang S. H., Müller J., Slomianka L., et al. . (2014). Adult neurogenesis and its anatomical context in the hippocampus of three mole-rat species. Front. Neuroanat. 8:39. 10.3389/fnana.2014.00039 - DOI - PMC - PubMed
    1. Andersson E., Tryggvason U., Deng Q., Friling S., Alekseenko Z., Robert B., et al. . (2006). Identification of intrinsic determinants of midbrain dopamine neurons. Cell 124, 393–405. 10.1016/j.cell.2005.10.037 - DOI - PubMed

LinkOut - more resources