. 2016 Nov 8:10:85.
doi: 10.3389/fnsys.2016.00085. eCollection 2016.

Insights into Brain Architectures from the Homological Scaffolds of Functional Connectivity Networks

Affiliations

Insights into Brain Architectures from the Homological Scaffolds of Functional Connectivity Networks

Louis-David Lord et al. Front Syst Neurosci. .

Abstract

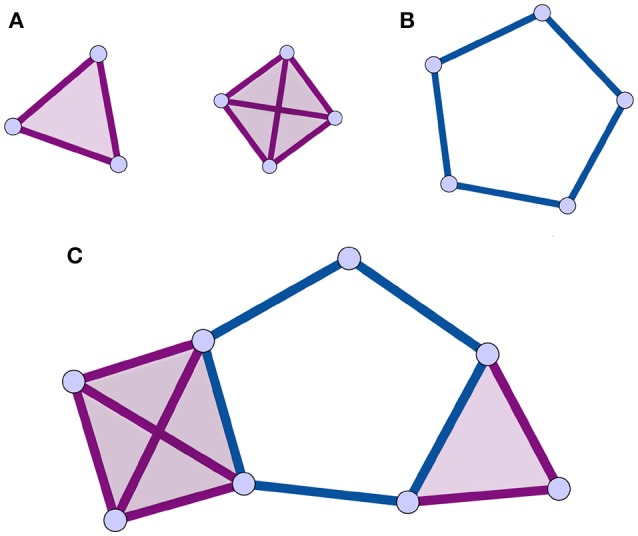
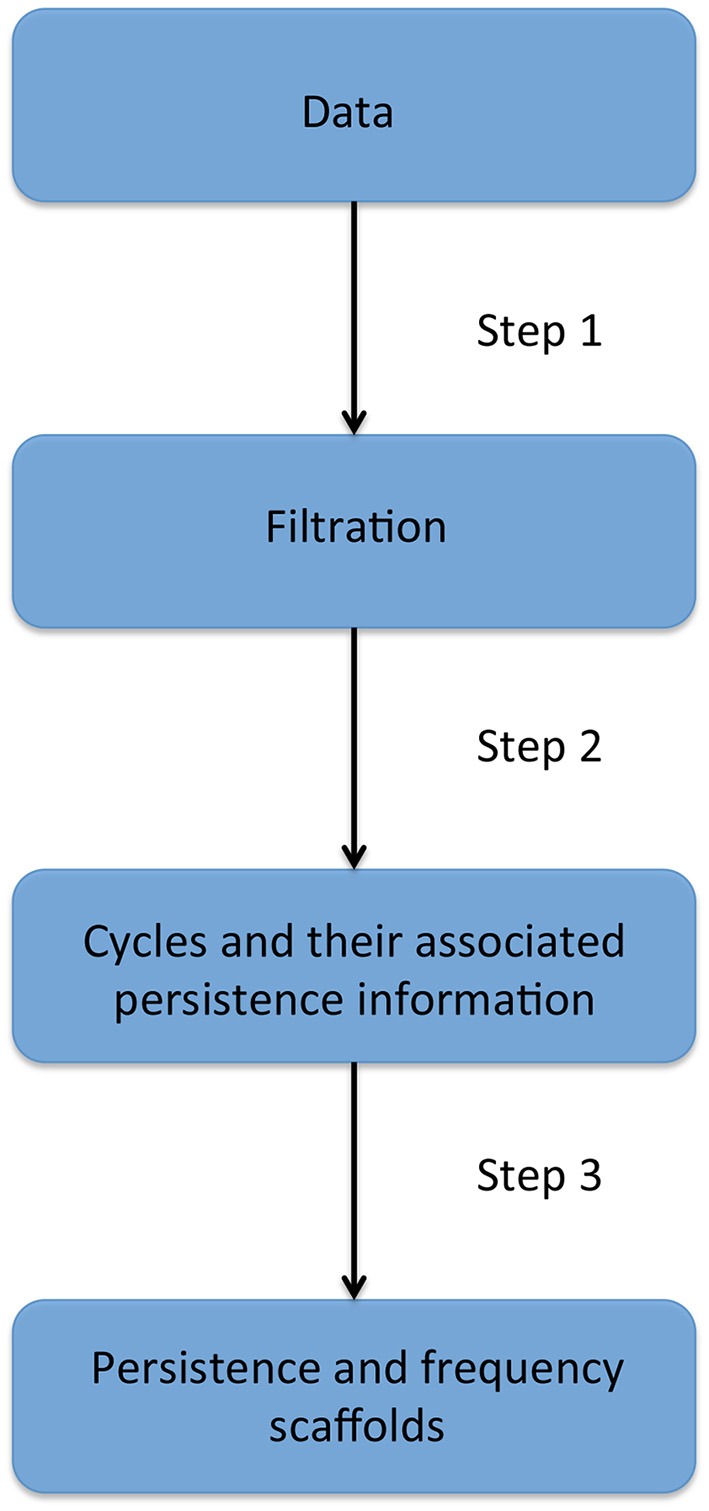
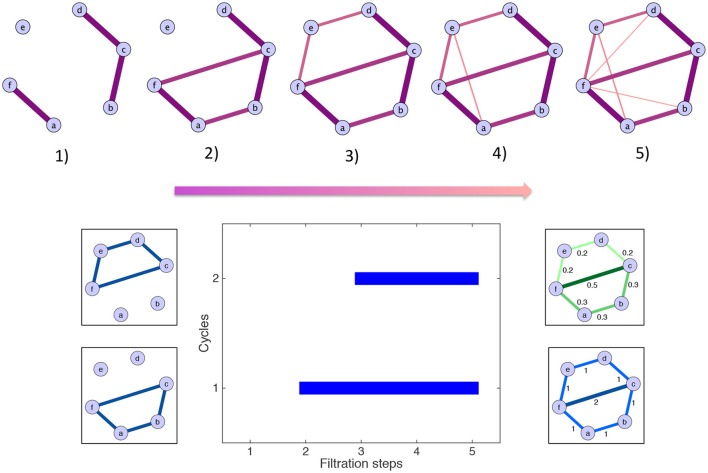
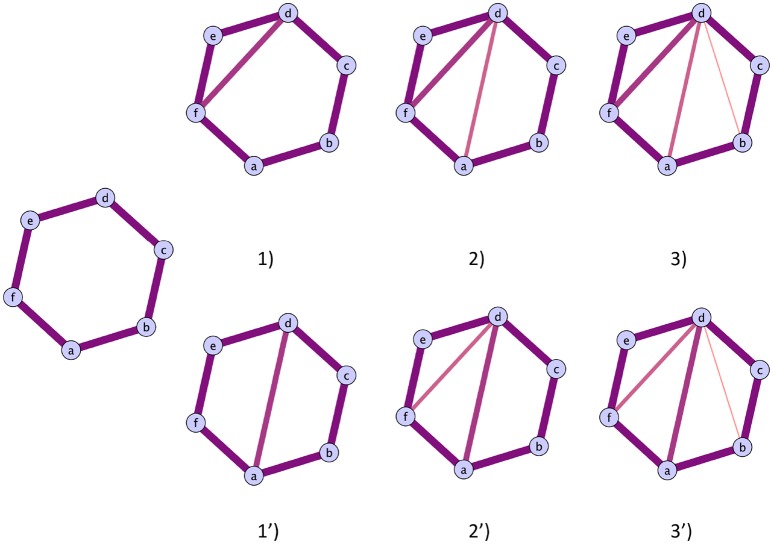
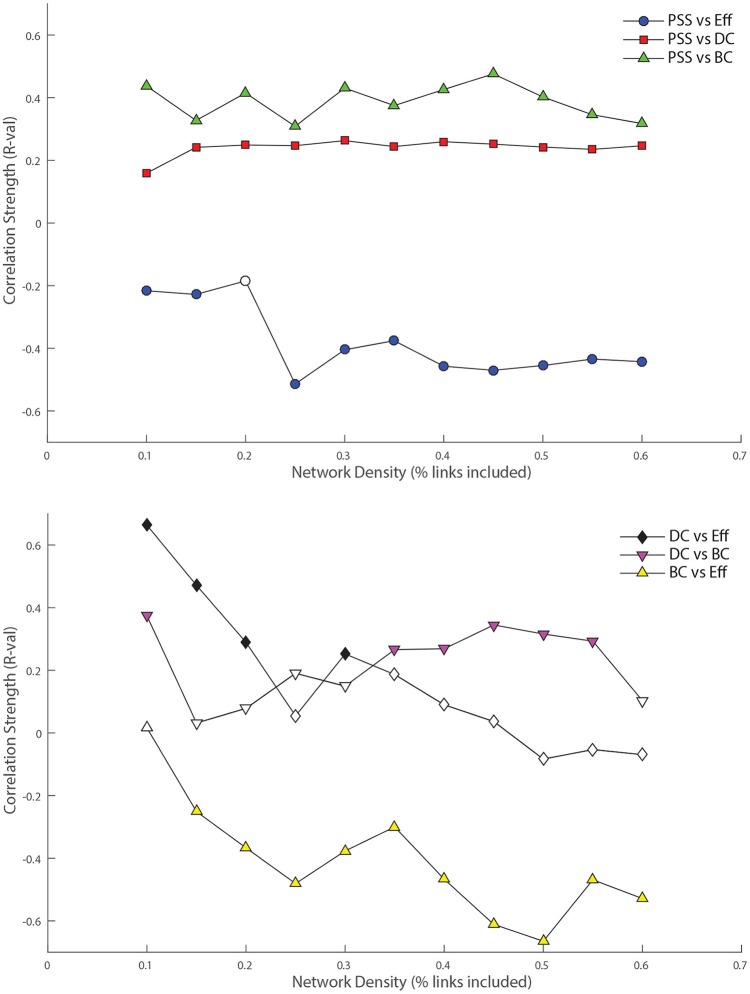
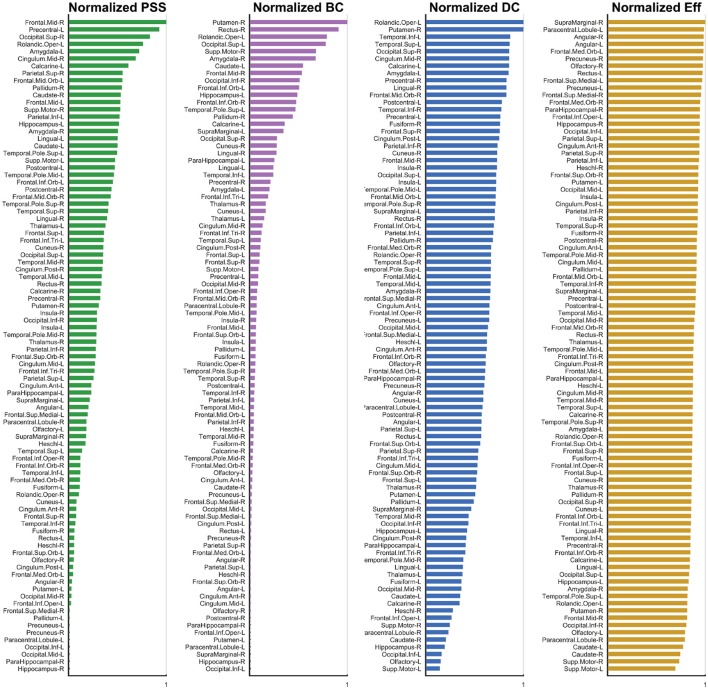
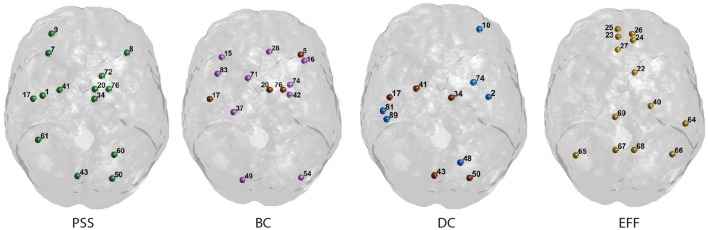
In recent years, the application of network analysis to neuroimaging data has provided useful insights about the brain's functional and structural organization in both health and disease. This has proven a significant paradigm shift from the study of individual brain regions in isolation. Graph-based models of the brain consist of vertices, which represent distinct brain areas, and edges which encode the presence (or absence) of a structural or functional relationship between each pair of vertices. By definition, any graph metric will be defined upon this dyadic representation of the brain activity. It is however unclear to what extent these dyadic relationships can capture the brain's complex functional architecture and the encoding of information in distributed networks. Moreover, because network representations of global brain activity are derived from measures that have a continuous response (i.e., interregional BOLD signals), it is methodologically complex to characterize the architecture of functional networks using traditional graph-based approaches. In the present study, we investigate the relationship between standard network metrics computed from dyadic interactions in a functional network, and a metric defined on the persistence homological scaffold of the network, which is a summary of the persistent homology structure of resting-state fMRI data. The persistence homological scaffold is a summary network that differs in important ways from the standard network representations of functional neuroimaging data: (i) it is constructed using the information from all edge weights comprised in the original network without applying an ad hoc threshold and (ii) as a summary of persistent homology, it considers the contributions of simplicial structures to the network organization rather than dyadic edge-vertices interactions. We investigated the information domain captured by the persistence homological scaffold by computing the strength of each node in the scaffold and comparing it to local graph metrics traditionally employed in neuroimaging studies. We conclude that the persistence scaffold enables the identification of network elements that may support the functional integration of information across distributed brain networks.

Keywords: fMRI; functional connectivity; homological scaffold; integration and segregation; persistent homology.


Figures

Figure 1
Figure 1
Illustrations of cliques, simplices, holes, and clique complex. The simplices are shaded for identification. (A) 3 and 4-cliques, which are associated to 2 and 3-dimensional simplices. (B) a 1-dimensional hole, or cycle, is a closed path of edges of length greater than 3. (C) Combining the elements of (A,B) following the rules in Section 2.2.1, one can produce a clique complex with one 1-dimensional hole. All simplices in this figure are shaded as is customary.
Figure 2
Figure 2
Description of the four stages of the persistent homology and homological scaffolds analysis workflow. The data consist of a fully connected weighted network. The filtration is produced using the weight clique rank filtration. The persistent homology of the filtration is computed, and each cycle (or “hole”) is endowed with a birth and death time. The homological scaffolds are generated using the information from persistent homology.
Figure 3
Figure 3
Toy example illustrating the generation of the homological scaffolds. On top The filtration: edges are added in decreasing order of weight (thickness and color represent the weights) to arrive at the original network at step (5). Bottom middle The barcode encoding the persistence of the two cycles 〈abcf〉 and 〈cdef〉. Bottom right The persistence (green) and frequency (blue) scaffolds, summarizing the role of the edges in the cycles present during the filtration.
Figure 4
Figure 4
Illustration of the two possible routes a cycles can close. Top route: The cycles closes with the addition of triangles. The cycles representative will be the original cycles 〈abcdef〉, irrespectively of the life time of the sub cycles that are partially closed. Bottom route: The original cycle is split into smaller cycles that are eventually closed by the mechanism illustrated in the top route. The two cycles that will be represented in the original cycle 〈abcdef〉 and the subcycle 〈abcd〉, as the cycle 〈adef〉 can be obtained as a linear combination of the first two.
Figure 5
Figure 5
Top: Relationship between nodal persistence scaffold strength (PSS) and standard topological centrality measures. At each threshold under study, the value of the bivariate correlation coefficient (R) between PSS and each of: degree-centrality (DC), betweenness-centrality (BC), and local efficiency (Eff) is plotted. Bottom: Relationship between standard topological measures. The same procedure as above is repeated for correlations between: DC vs. BC, DC vs. Eff, and BC vs. Eff as control conditions. Filled shapes indicate the presence of a statistically significant correlation between the two variables (p < 0.05).
Figure 6
Figure 6
Normalized Metric Values. The normalized nodal values are displayed for each graph measure under study. The values for PSS, BC, DC, and Eff are respectively depicted from left to right. While computation of the PSS does not require ad hoc thresholding, the BC, DC, and Eff metrics are threshold-dependent and nodal metric values have thus been integrated over the threshold range under study to generate a single value for each node. The analysis used is described in detail Section 3.2.
Figure 7
Figure 7
Graphical display of the highest-ranking nodes. Functional hubs identified on the PSS measure and three standard topological centrality metrics (BC, DC, Eff). Hubs on each measure are defined as having a value >1 S.D. of the mean of their respective distribution. Nodes overlapping with the PSS hubs are shown in brown. The corresponding AAL labels for each numerical index are included in Supplementary Figure S1.

References

    1. Alexander-Bloch A. F., Gogtay N., Meunier D., Birn R., Clasen L., Lalonde F., et al. . (2010). Disrupted modularity and local connectivity of brain functional networks in childhood-onset schizophrenia. Front. Syst. Neurosci. 4:147. 10.3389/fnsys.2010.00147 - DOI - PMC - PubMed
    1. Bassett D. S., Nelson B. G., Mueller B. A., Camchong J., Lim K. O. (2012). Altered resting state complexity in schizophrenia. Neuroimage 59, 2196–2207. 10.1016/j.neuroimage.2011.10.002 - DOI - PMC - PubMed
    1. Bauer U., Lesnick M. (2014). Induced matchings of barcodes and the algebraic stability of persistence, in Proceedings of the Thirtieth Annual Symposium on Computational Geometry SOCG'14 (New York, NY: ACM; ), 355:355–355:364.
    1. Blondel V. D., Guillaume J.-L., Lambiotte R., Lefebvre E. (2008). Fast unfolding of communities in large networks. J. Stat. Mech. 2008, P10008–P10013. 10.1088/1742-5468/2008/10/P10008 - DOI
    1. Brandes U. (2001). A faster algorithm for betweenness centrality*. J. Math. Sociol. 25, 163–177. 10.1080/0022250X.2001.9990249 - DOI