. 2016 Nov 8:7:1657.
doi: 10.3389/fpls.2016.01657. eCollection 2016.

Time-Resolved Investigation of Molecular Components Involved in the Induction of [Formula: see text] High Affinity Transport System in Maize Roots

Affiliations

Time-Resolved Investigation of Molecular Components Involved in the Induction of [Formula: see text] High Affinity Transport System in Maize Roots

Youry Pii et al. Front Plant Sci. .

Abstract

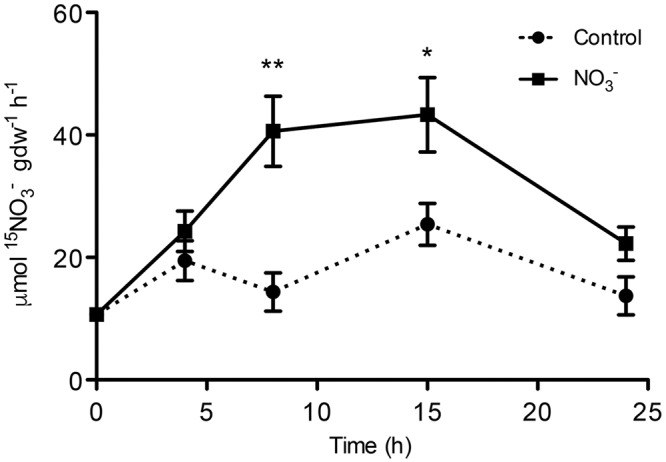
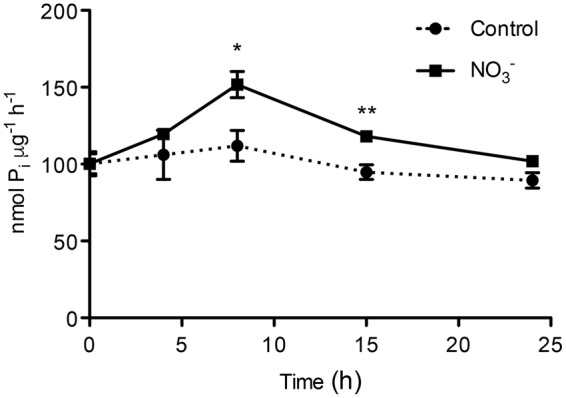
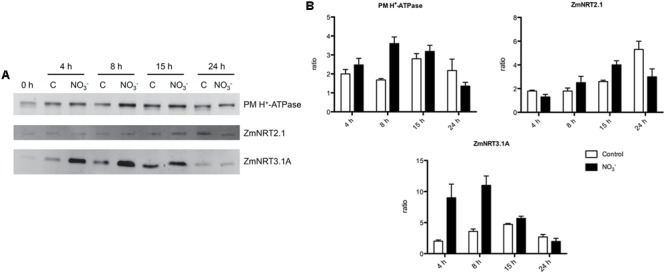
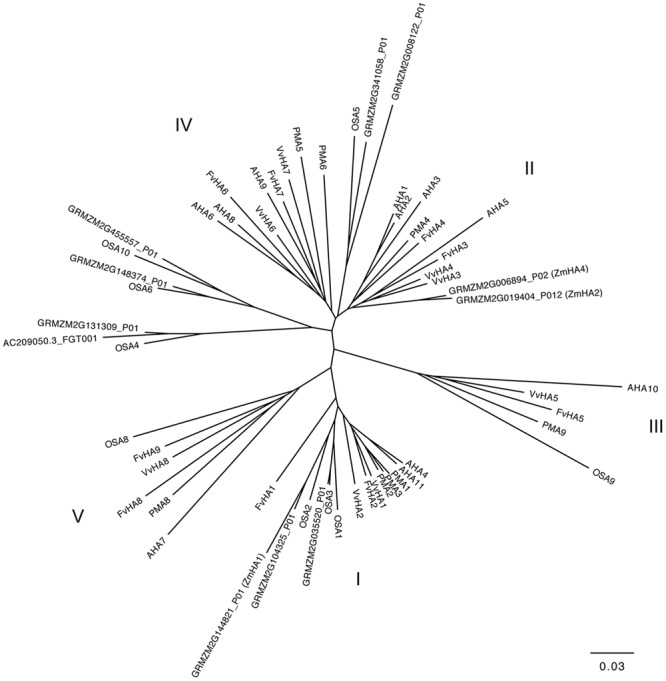
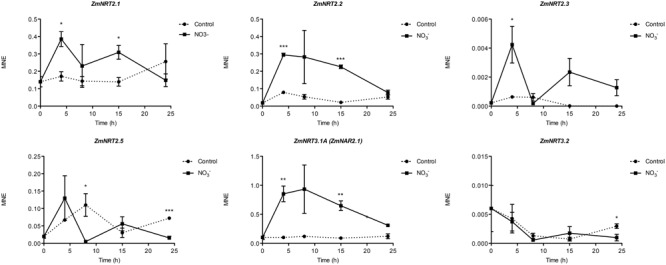
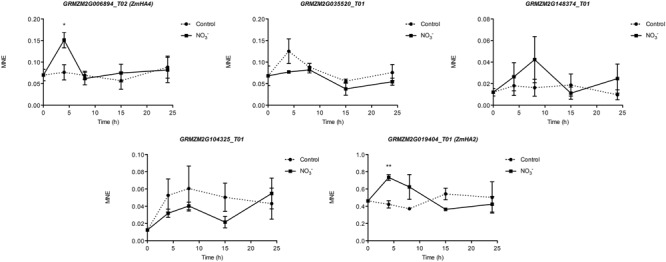
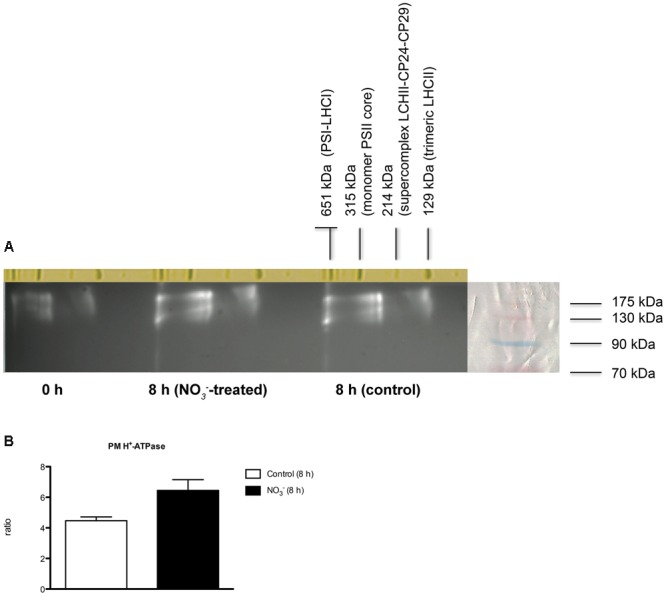
The induction, i.e., the rapid increase of nitrate ([Formula: see text]) uptake following the exposure of roots to the anion, was studied integrating physiological and molecular levels in maize roots. Responses to [Formula: see text] treatment were characterized in terms of changes in [Formula: see text] uptake rate and plasma membrane (PM) H+-ATPase activity and related to transcriptional and protein profiles of NRT2, NRT3, and PM H+-ATPase gene families. The behavior of transcripts and proteins of ZmNRT2s and ZmNRT3s suggested that the regulation of the activity of inducible high-affinity transport system (iHATS) is mainly based on the transcriptional/translational modulation of the accessory protein ZmNRT3.1A. Furthermore, ZmNRT2.1 and ZmNRT3.1A appear to be associated in a ∼150 kDa oligomer. The expression trend during the induction of the 11 identified PM H+-ATPase transcripts indicates that those mainly involved in the response to [Formula: see text] treatment are ZmHA2 and ZmHA4. Yet, partial correlation between the gene expression, protein levels and enzyme activity suggests an involvement of post-transcriptional and post-translational mechanisms of regulation. A non-denaturing Deriphat-PAGE approach allowed demonstrating for the first time that PM H+-ATPase can occur in vivo as hexameric complex together with the already described monomeric and dimeric forms.

Keywords: NO-3 induction; PM H+-ATPase; ZmNRT2.1; ZmNRT3.1A; maize; protein complexes.


Figures

FIGURE 1
FIGURE 1
High-affinity NO3 uptake rate in the roots of maize plants. 15NO3 uptake rate by maize plants was measured after different period of treatment (induction) with the anion. At the indicated times, seedlings were transferred to 200 μM 15NO3 solution and the NO3 uptake was carried out for up to 5 min. Data are the means ± SE; n = 3. The statistical significance was determined by means of Student’s t-test. (∗∗P < 0.01; P < 0.05).
FIGURE 2
FIGURE 2
ATP hydrolysing activity in plasma membrane-enriched vesicles from the roots of maize plants. ATP hydrolysing activity was measured in plasma membrane (PM)-enriched vesicles isolated from both NO3-induced roots and in control roots. Data are the means ± SE; n = 3. The statistical significance was determined by means of Student’s t-test. (∗∗P < 0.01; P < 0.05).
FIGURE 3
FIGURE 3
Western blot analysis carried out on the microsomal fraction extracted from the root tissue of maize seedlings treated with NO3 for the indicated times. (A) Western blot analysis performed using anti-PM H+-ATPase (upper panel), anti-NRT2.1 (middle panel) or anti-NRT3.1A (lower panel) antibodies. The same amount of proteins was loaded in each lane. The protein molecular weights were estimated using the ECLTM Plex Fluorescent Rainbow Markers (GE Healthcare Life Sciences). (B) Densitometric analysis of PM H+-ATPase, NRT2.1, and NRT3.1A. Data are expressed as ratio of the corresponding 0 h sample (signals were quantified using Quantity One software, Bio-Rad). Data are the means ± SE, n = 3.
FIGURE 4
FIGURE 4
Phylogenetic tree showing the relationships between the PM H+-ATPase from Zea mays, Vitis vinifera, Fragaria vesca, Arabidopsis thaliana, Nicotiana plumbaginifolia and Oryza sativa. Phylogenetic tree was built using the Phylogenetic Interference Package program (PHYLIP) and it was visualized using FigTree ver. 1.4.2 software (for protein ID codes, see Supplementary Table S1). Bootstrap values from 1000 replicates were used to estimate the confidence limits of the nodes. The scale bar represents a 0.03 estimated amino acid substitutions per residue.
FIGURE 5
FIGURE 5
Time course expression analysis of NRT2 and NRT3 genes in NO3-induced maize roots. The expression levels of ZmNRT2.1, ZmNRT2.2, ZmNRT2.3, ZmNRT2.5, ZmNRT3.1A, and ZmNRT3.1B were assessed by qRT-PCR in maize roots treated for the indicated times with NO3. The data were normalized to two internal controls, elongation factor 1-alpha (GRMZM2G153541_T01) and polyubiquitin containing seven ubiquitin monomers (GRMZM2G118637_T01). The relative expression ratios were calculated using untreated control roots as a calibrator sample. The values reported are means ± SE; n = 3 (P < 0.05; ∗∗P < 0.01; ∗∗∗P < 0.001).
FIGURE 6
FIGURE 6
Time course expression analysis of PM H+-ATPase genes in NO3-induced maize roots. The expression levels of GRMZM2G006894_T01 (ZmHA4), GRMZM2G035520_T01, GRMZM2G148374_T01, GRMZM2G104325_T01 and GRMZM2G019404_T01 (ZmHA2) were assessed by qRT–PCR in maize roots treated for the indicated times with NO3. The data were normalized to two internal controls, elongation factor 1-alpha (GRMZM2G153541_T01) and polyubiquitin containing seven ubiquitin monomers (GRMZM2G118637_T01). The relative expression ratios were calculated using untreated control roots as a calibrator sample. The values reported are means ± SE; n = 3 (P < 0.05; ∗∗P < 0.01; ∗∗∗P < 0.001).
FIGURE 7
FIGURE 7
Separation of PM H+-ATPase complexes by non-denaturing Deriphat-PAGE followed by SDS-PAGE. (A) Western blot analysis performed using antibodies anti-PM H+-ATPase. The molecular weight of each protein marker (ECL Plex Fluorescent Rainbow Markers) was reported on the right side. (B) Densitometric analysis of PM H+-ATPase. Data are expressed as ratio of corresponding 0 h sample considering the sum of all three forms (signals were quantified using PDQuestTM 2-D Analysis Software, Bio-Rad). Data are the means ± SE, n = 3.

References

    1. Altschul S. F., Madden T. L., Schäffer A. A., Zhang J., Zhang Z., Miller W., et al. (1997). Gapped BLAST and PSI-BLAST: a new generation of protein database search programs. Nucleic Acids Res. 25 3389–3402. 10.1093/naar/25.17.3389 - DOI - PMC - PubMed
    1. Arango M., Gévaudant F., Oufattole M., Boutry M. (2003). The plasma membrane proton pump ATPase: the significance of gene subfamilies. Planta 216 355–365. 10.1007/s00425-002-0856-8 - DOI - PubMed
    1. Auer M., Scarborough G. A., Kuhlbrandt W. (1998). Three-dimensional map of the plasma membrane H+-ATPase in the open conformation. Nature 392 840–843. 10.1038/33967 - DOI - PubMed
    1. Axelsen K. B., Palmgren M. G. (1998). Evolution of substrate specificities in the P-type ATPase superfamily. J. Mol. Evol. 46 84–101. 10.1007/PL00006286 - DOI - PubMed
    1. Bradford M. M. (1976). A rapid and sensitive method for the quantitation of microgram quantities of protein utilizing the principle of protein-dye binding. Anal. Biochem. 72 248–254. 10.1016/0003-2697(76)90527-3 - DOI - PubMed