Review
. 2016 Nov 2;6(13):2488-2524.
doi: 10.7150/thno.16589. eCollection 2016.

Chemically engineered persistent luminescence nanoprobes for bioimaging

Affiliations
Review

Chemically engineered persistent luminescence nanoprobes for bioimaging

Thomas Lécuyer et al. Theranostics. .

Abstract

Imaging nanoprobes are a group of nanosized agents developed for providing improved contrast for bioimaging. Among various imaging probes, optical sensors capable of following biological events or progresses at the cellular and molecular levels are actually actively developed for early detection, accurate diagnosis, and monitoring of the treatment of diseases. The optical activities of nanoprobes can be tuned on demand by chemists by engineering their composition, size and surface nature. This review will focus on researches devoted to the conception of nanoprobes with particular optical properties, called persistent luminescence, and their use as new powerful bioimaging agents in preclinical assays.

Keywords: Nanoparticles; chemistry; persistent luminescence and in vivo imaging.; surface coating.


Conflict of interest statement

The authors have declared that no competing interest exists.

Figures

Figure 1
Figure 1
Illustration of possible mechanisms due to electron, e (a) and hole, h (b) traps that can directly contribute to the persistent luminescence. Reproduced with permission from reference .
Figure 2
Figure 2
Optical characteristics of Ca0.2Zn0.9Mg0.9Si2O6: Eu, Dy, Mn prepared by sol/gel reaction and calcination at 1050°C. A) Excitation spectrum. (B) Long afterglow emission spectrum. (C) Time dependence of the luminescence intensity of PLNPs measured after exposure to a 6-W UV lamp for 5 min and recorded for 1 hour. The luminous intensity was quantified straightforward by using an intensified charge-coupled device (ICCD) camera (PhotonImager; Biospace). Reproduced with permission from reference .
Figure 3
Figure 3
Different hydrodynamic diameters of the Ca0.2Zn0.9Mg0.9Si2O6: Eu, Dy, Mn nanoparticles obtained after the centrifugation steps and measured by DLS.
Figure 4
Figure 4
Chemical reactions on Ca0.2Zn0.9Mg0.9Si2O6: Eu,Dy,Mn nanoparticles to introduce amino, carboxy or PEG groups on the surface.
Figure 5
Figure 5
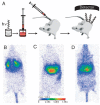
(A) Principle of in vivo imaging using PLNPs. A suspension containing a proper amount of NPs is first excited ex vivo with a UV lamp for few minutes and then directly injected into an anesthetized mouse. The signal is then acquired with an intensified charge-coupled device (CCD) camera in order to follow the influence of the coating (B: amino, C: carboxy or D: PEG). Reproduced with permission from reference .
Figure 6
Figure 6
Characteristics of CSN nanoparticles, surface modification with PEG and proof of concept for in vivo imaging using both hydroxylated and PEGylated NPs. Reproduced with permission from reference .
Figure 7
Figure 7
(A) Schematic energy level diagram of Mn2+ and Ln3+ (Ce, Pr, Nd or Dy) in CMSO. The main hole traps are Mn2+ ions in the Mg2+ site, while electrons are trapped by oxygen vacancies (VO) and Ln3+ ions. (B) Decay of the Mn2+ luminescence intensity at 685 nm of CMSO (grey curve) and rare-earth-codoped CMSO:Ln compounds, recorded after 10 min irradiation. (C) In vivo imaging of different CZMSO and CMSO diopside PLNPs under the photon-counting system; left (CZMSO:Eu,Dy) and right (CMSO:Eu,Pr). The signal was recorded for 15 min following systemic injection of 100 µg of the probes excited 5 min under a 6W UV lamp. Reproduced with permission from reference .
Figure 8
Figure 8
(A) Controllable size synthesis of CaMgSi2O6: Eu2+, Pr3+, Mn2+ (EMP NPs). (B) TEM of the as-synthetized NPs. (C) Luminescence image of the distribution of the EMP NPs injected into the abdomen of a mouse 60 min after the injection. Reproduced with permission from reference .
Figure 9
Figure 9
Controlled size synthesis of SiO2/SrMgSi2O6:Eu0.01, Dy0.02 nanoparticles and in vivo imaging after intraperitoneal injection. Luminescence imaging in vivo, 60 s acquisition at intervals of every 5 min. Reproduced with permission from reference .
Figure 10
Figure 10
Principle of in vitro detection of AFP using modified PLNPs. (A) Schematic illustration of the FRET inhibition assay for AFP based on the PL quenching of PEI-PLNPs by Ab-AuNPs. (B) (a-i) Fluorescence images of Bel-7402, L-O2, and 3T3 cells stained with the FRET inhibition probe (PEI-PLNPs/Ab-AuNPs) after the cells had been cultured for 22, 46, and 70 h, respectively. Reproduced with permission from reference .
Figure 11
Figure 11
Schematic illustration of the PLNP based FRET immunoassay conception for PSA detection (up) and analytical results for the determination of PSA in real samples (down). Reproduced with permission from reference .
Figure 12
Figure 12
Detection of GSH in vitro and in vivo using PLNPs and FRET. (A) Schematic illustration of the design for GSH detection using MnO2 modified PLNPs. (B) In vitro PL image of GSH in RAW 264.7 macrophages. (C) In vivo PL image of the sample without excitation. The concentration of the nanoprobe was 1 mg.mL-1. The PL signals were collected at 520 ± 20 nm. The centre of the black dashed circle is the injection site. Reproduced with permission from reference .
Figure 13
Figure 13
In vitro and in vivo detection of AA using modified PLNPs. (A) Schematic Illustration of the Design for AA Detection Using CoOOH-Modified PLNPs. (B) PL response of CoOOH-modified PLNPs solutions in the presence of different electrolytes and biomolecules. (C) Persistent luminescence image of the mouse injected with 0.1 mL of AA (0.1 mol/L) and the nanoprobe (right). Reproduced with permission from reference .
Figure 14
Figure 14
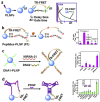
Schematic illustration for (a) PLNPs-based TR-FRET principle, (b-d) TR-FRET detection strategies of caspase-3 protease, miRNA-21 and PDGF protein by using caspase-specific peptide, DNA and aptamer-functionalized PLNPs probes. Reproduced with permission from reference .
Figure 15
Figure 15
(A) PL excitation (black line) and emission (red line) spectra of Cr3+ doped ZGO. (B) Room-temperature persistent luminescence decay curves of ZGO obtained with two different excitations for 2 min under either UV light or a LEDs array source. (C) Persistent luminescence was activated through living tissues following a 2 min orange/red LEDs excitation, and immediately acquired for 3 min under the photon counting system. The inset shows a persistent luminescence decay curve corresponding to the signal from the liver. Reproduced with permission from reference .
Figure 16
Figure 16
In vivo comparison of negatively charged QDs and PLNPs. (A) After intramuscular injection and (B-C) after intravenous injection in healthy mice. The experiments were conducted by injecting the same amount (50 µg per mouse) of QDs (C) and PLNPs (B). Reproduced with permission from reference .
Figure 17
Figure 17
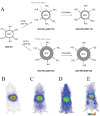
(A) Representation of ZGO functionalization routes with APTES and PEG5000kDa. (B) In vivo biodistribution in healthy mice of ZGO-OH, (C) ZGO-PEG3h, (D) ZGO-PEG6h, and of ZGO-PEG6h injected to tumor bearing mice (E). Reproduced with permission from reference .
Figure 18
Figure 18
(A) ZGO-NH2 PLNPs used for RAW cells labelling in vitro and cells tracking in vivo (B) or following oral administration (C-D) . Reproduced with permission from reference .
Figure 19
Figure 19
LiGa5O8:Cr3+ PLNPs used for in vivo PSPL experiments with labelled cells. (A) NIR images of four phosphor discs taken at different persistent luminescence times (10 min to 1,080 h) after irradiation by a 254 nm lamp for 10 s to 5 min. (B) The PEI-LiGa5O8:Cr3+ nanoparticles labelled 4T1 cells (~2.5 × 10⁷ cells) were illuminated by a 4W 254 nm UV lamp for 15 min, and then subcutaneously injected into the back of a nude mouse. (a) Image taken at 4 h after cell injection. To get the PSPL signal, the mouse was exposed to a white LED for 15 s. (a1) and (a2), Images taken at 10 s and 5 min after the stimulation, respectively. The signals were attributed to PSPL. (b-e) The mouse was exposed daily to the LED flashlight for 15 s, and images were taken at 10 s and 5 min after the stimulation. All images were acquired in the bioluminescence mode with an exposure time of 2 min. Reproduced with permission from reference .
Figure 20
Figure 20
Active tumor targeting with c(RGDyK)-conjugated LGO:Cr nanoparticles in subcutaneous 4T1 tumor model. The c(RGDyK)-LGO:Cr nanoparticles were irradiated by a 254 nm UV lamp for 15 min before the intravenous injection. Luminescence images were acquired before (left) and after illuminating the mouse by a LED flashlight (for 15 s) at 6 h and 24 h after the cell injection. The tumor sites are indicated by pink circles. Reproduced with permission from reference .
Figure 21
Figure 21
ZGO:Cr3+ ,Gd3+ PLNPs as optical and negative MRI contrast agent. (A) Relaxivities r1 and r2 of ZGO nanoparticles suspended in NaOH at 7T. (B) Persistent luminescence images 45 minutes following the injection of UV-excited ZGO:Cr,Gd (4%) dispersed in 5% glucose solution. Black circle corresponds to a global region of interest comprising liver and spleen. (C-E) Magnetic resonance imaging of mice liver recorded at 7T. (C) Reference mouse before the injection of ZGO nanoparticles. (D) Reference mouse, 1 hour after the injection of ZGO:Cr,Gd (2%) nanoparticles. (E) Reference mouse, 1 hour after the injection of ZGO:Cr,Gd (4%) nanoparticles. Reproduced with permission from reference .
Figure 22
Figure 22
Nanorods of ®-Ga2O3:Cr3+ for drug loading and in vivo imaging. (A) TEM images of ®-Ga2O3: Cr3+ (B) Cells viabilities against DOX-loaded ®-Ga2O3: Cr3+ nanorod concentrations. (C) In vivo near infrared persistent luminescence images acquired after intravenous injection (D). Afterglow image of the isolated organs and tumour from a mouse bearing HeLa tumour 48 h post i.v. injection of ®-Ga2O3: Cr3+ re-excited by white light. Repoduced with permission from reference .
Figure 23
Figure 23
Illustration of the synthesis of controlled size mZGC using MSN template and their in vivo imaging application. In vivo recharging of mZGC for persistent luminescence imaging by using a white LED. (A) First charging, (B) 10 min after first charging, (C) second recharging. Reproduced with permission from reference .
Figure 24
Figure 24
Mesoporous ZGO@SiO2 for drug loading and in vivo imaging. (A) Schematic representation of ZGO@SiO2 synthesis. (B) Relative cell viability of U87MG cells after a 24 hours incubation period with either ZGO@SiO2 or ZGO@SiO2-Dox. (C) Persistent luminescence images up to 30 minutes after systemic injection to mouse. Reproduced with permission from reference .
Figure 25
Figure 25
(A) Schematic illustration of the synthesis, surface functionalization and application of the core/shell structure nanoprobe Gd2O3@mSiO2/ZGOCB. (B) T1-weighted MR images of a mouse before (left) and after (right) intravenous injection of Gd2O3@mSiO2/ZGOCB-NH2 (0.15 mg), the red arrow shows the liver. (C) In vivo luminescence images of H22 tumor bearing mice (a) and normal mice (b) after intravenous injection of Dox-Gd2O3@mSiO2/ZGOCB-FA. (D) Ex vivo image of liver, spleen, kidneys, heart, lung and tumor corresponding biodistribution for each organ 6 h after systemic injection. Reproduced with permission from reference .
Figure 26
Figure 26
(A) Schematic representation of the synthetic route to prepare MPNHs-OH. (B) TEM characterization of non-functionalized MPNH-OH. (C) Luminescence detection of nanoparticles suspension before (a) and after (b) application of an external magnetic field. (D) MPNH-COOH biodistribution assessed by optical imaging 10 min after systemic injection. E-H) T2*-weighted MRI-based detection of MPNHs-COOH in vivo. E) Abdominal cross-section of a mouse showing liver before MPNHs-COOH injection. F-H) Respective abdominal cross-sections of mice after MPNH0 , MPNH1, MPNH3-COOH injections showing liver contrast evolution. Reproduced with permission from reference .
Figure 27
Figure 27
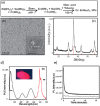
(a) Schematic of the synthetic procedure of sub-10 nm size Cr doped ZnGa2O4 NPs. (b) Typical TEM image showing nearly monodispersed Cr doped ZnGa2O4 NPs dispersed in hexane. The inset is a HRTEM image from a single nanoparticle. (c) XRD pattern of the as-synthesized Cr doped ZnGa2O4 NPs (black curve) matching well with the diffraction pattern of corresponding spinel ZnGa2O4 (red lines, JCPDS No. 38-1240). (d) Excitation (black curve, at the emission of 696 nm) and emission (red curve, excitation at 254 nm) spectra of the Cr:ZnGa2O4 NPs dispersed in hexane. The inset is the Cr:ZnGa2O4 NPs powder digital image under 254 nm hand-held lamp (6 W) excitation. (e) Afterglow decay of Cr:ZnGa2O4 NPs powder after 5 min irradiation with a 254 nm UV lamp (black curve). The grey curve shows the background of the instrument without any sample under the same measurement conditions. Persistent luminescence intensity was monitored at 696 nm as a function of time. Reproduced with permission from reference .
Figure 28
Figure 28
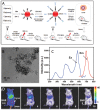
Small ZGO PLNPs for in vivo imaging. (A) TEM and HR-TEM (inset) of USPLNPs@PO-PEG. (B) Excitation (left, emission wavelength = 695 nm) and emission spectra (right, excitation wavelength = 254 nm) of USPLNPs in water. (C) NIR luminescence time decay after UV illumination of a suspension of PEGylated USPLNPs. (D) In vivo imaging in BALB/c mice injected with a suspension of PEGylated USPLNPs: a) visible preview; b) luminescence acquisition after UV excitation. Reproduced with permission from reference .
Figure 29
Figure 29
Small size ZGC-1 nanoparticles synthesized at 220°C for 10 hours using excess of Zn. (A) TEM image and size distribution. (B) Dynamic light scattering patterns of ZGC-1 in water before and after storage for 1 month. (B-1, B-3) bright field and (B-2, B-4) corresponding luminescence pictures of ZGC-1. (C) Deep tissue in vivo imaging before (left) and after (right) in situ excitations with a white LED (5000 lm) light for 30 s. Reproduced with permission from reference .
Figure 30
Figure 30
Up: Synthesis, functionalization and imaging of small ZGO:Cr,Eu NPs. Middle: TEM image of ZGO, excitation and emission spectra. Below: In vivo luminescent image of H22 tumor-bearing mice after intravenous injection of ZGO-FA, and luminescent images of re-excitation at 650 nm at the tumor site. Reproduced with permission from reference .
Figure 31
Figure 31
Persistent luminescence performances of Zn3Ga2Ge2O10:Cr3+ discs. NIR images of four phosphor discs taken at different afterglow times (5 min to 360 h) after irradiation by a 365 nm lamp for 10 s to 5 min. The discs were placed on a hot plate surface for imaging. Reproduced with permission from reference .
Figure 32
Figure 32
(A) Schematic illustration of the process and functionalization of Zn3Ga2Ge2O10:Cr3+ (ZGGO) with anti-EpCAM to target MCF7 cell lines. (B) Confocal microscopic images of a MCF7 cells treated with ZGGO-NH2. (C) MCF7 cells treated with ZGGO-EpCAM. Reproduced with permission from reference .
Figure 33
Figure 33
Zn2.94Ga1.96Ge2O10:Cr3+, Pr3+ synthesis for long term in vivo imaging. (A) NIR afterglow decay images recorded by CCD camera at different times after stopping UV irradiation. (B) In vivo NIR luminescence images of a normal mouse after subcutaneous injection of PEG-PLNPs (0.4 mg, 10 min irradiation with a 254 nm UV lamp before injection). (C) In vivo NIR luminescence images of U87MG tumor-bearing mice (white circles locate the tumor site, a-b) and normal mice, (c,d) after intravenous injection of PEG-PLNPs (a, c) and RGD-PLNPs (b, d) (0.4 mg, 10 min irradiation with a 254 nm UV lamp before injection). Reproduced with permission from reference .
Figure 34
Figure 34
Schematic diagram for the synthesis, surface modification and application of NLPLNPs@MSNs for tumor imaging. Reproduced with permission from reference .
Figure 35
Figure 35
Bimodal imaging agent based on ZGGO nanoparticles coated with DTPA-Gd complexes for in vivo optical (left) and MRI (right). Reproduced with permission from reference .
Figure 36
Figure 36
ZGGO:Cr,Pr@TaOx@SiO2 nanoparticles for optical imaging and CT. (A) Schematic protocol for the preparation of core-shell structured ZGGO:Cr,Pr@TaOx@SiO2. (B) In vivo persistent luminescence imaging of HepG2 tumor bearing nude mice after tail vein injection with PEG-ZGGO:Cr,Pr@TaOx@SiO2. (C) In vivo CT imaging of HepG2 tumor-bearing mice with PEG-ZGGO:Cr,Pr@TaOx@SiO2 via orthotopic injection: pre-injection, 10 min and 2 h post-injection. Reproduced with permission from reference .
Figure 37
Figure 37
Zn1.1Ga1.8Ge0.1O4:Cr3+, Eu3+ TAT PLNPs for in vivo imaging and cell tracking. (A) Schematic representation of LPLNP surface modification. (B) In vivo biodistribution of LPLNP-TAT and LPLNP-TAT-labeled ASC after intravenous injection. Reproduced with permission from reference .
Figure 38
Figure 38
Principle of SrAl2O4:Eu2+,Dy3+ (SAO) coating with PPA and PEG and application for long-term in vivo imaging. Reproduced with permission from reference .
Figure 39
Figure 39
(A) Schematic of test line showing NeutrAvidin phosphor bound to bHEL captured by anti-HEL antibodies. (B) LFA strips showing bHEL serial dilutions with duplicates and detection with Streptavidin gold nanoparticles (top) and NeutrAvidin PLNPs (bottom). (C) Average intensity ratios (Itest line/Icontrol line) and ± standard deviations at different bHEL concentrations from LFA experiments with NeutrAvidin PLNPs. Reproduced with permission from reference .
Figure 40
Figure 40
Schematic synthesis, surface modification of Gd2O3@mSiO2@CaTiO3:Pr3+ (GdSCTP) PLNPs for in vivo imaging. Reproduced with permission from reference .
Figure 41
Figure 41
(HAp/β-TCP) doped with Eu2+, Mn2+ and Ln3+ ions (Ln3+ = Dy3+, Pr3+) and proof of concept for in vivo imaging application. (A) TEM images of HAp/β-TCP nanoparticles synthesized by hydrothermal route, annealed under air and then under reductive atmosphere at 1000°C: (a) spherical nanoparticles, (inset) nanorods. (B) Luminescence decay curves of HAp/β-TCP:Eu2+/Eu3+ (1%), Mn2+ (5%), Dy3+ (2%) (in black) and of HAp/β-TCP:Eu2+/Eu3+ (1%), Mn2+ (5%), Pr3+ (2%) (in grey), excitation wavelength 365 nm, excitation time 120 s. (C) Persistent luminescence spectra of HAp/β-TCP: Eu2+/Eu3+ (1%), Mn2+ (5%), Dy3+ (2%) (in black) and of HAp/β-TCP:Eu2+/Eu3+ (1%), Mn2+ (5%), Pr3+ (in grey), excitation wavelength 365 nm, excitation time 120s. (D) Images of a Balb/c mouse obtained at 5 and 10 min after the injection of 0.8 mg nanoparticles of HAp/β-TCP doped Eu2+/Eu3+, Mn2+ and Dy3+ dispersed in 200 ml of 5% glucose. Reproduced with permission from reference .
Figure 42
Figure 42
(a) Excitation wavelength dependence of the persistent luminescent intensity at 10s after the removal of the excitation ultraviolet light (= 365 nm, 7.43W/m2) from Sr2SnO4:Nd3+ ceramic disk fired at 1773 K, which is monitored at 900 nm (solid circles), and PL excitation spectrum for Sr2SnO4:Nd3+ (solid lines). The inset shows the PL emission spectrum (solid lines) and the persistent luminescence spectrum (solid circles) obtained at a decay time of 10 s after the removal of the excitation ultraviolet light (= 365 nm; 7.43W/m2). (b) Bright field image of the persistent luminescence from a Sr2SnO4:Nd3+ ceramic disk fired at 1773 K. (c) The bright field image of the persistent luminescence from the Sr2SnO4:Nd3+ ceramic disk was covered by a hand. The position of the ceramic disk is indicated by a broken line. (d) Dark field image of the persistent luminescence from Sr2SnO4:Nd3+. Reproduced with permission from reference .

References

    1. Cai W, Chen X. Nanoplatforms for targeted molecular imaging in living subjects. Small. 2007;3:1840–1854. - PubMed
    1. Lee DE, Koo H, Sun IC. et al. Multifunctional nanoparticles for multimodal imaging and theragnosis. Chem. Soc. Rev. 2012;7:2656–2672. - PubMed
    1. Xie J, Liu G, Eden HS. et al. Surface-engineered magnetic nanoparticle platforms for cancer imaging and therapy. Acc. Chem. Res. 2011;44:883–892. - PMC - PubMed
    1. Weissleder R, Pittet MJ. Imaging in the area of molecular oncology. Nature. 2008;452:580–589. - PMC - PubMed
    1. Kobayashi H, Ogawa M, Alford R. et al. New strategies for fluorescent probe design in medical diagnostic imaging. Chem. Rev. 2010;110:2620–2640. - PMC - PubMed

Publication types

MeSH terms