

Present status of amorphous In-Ga-Zn-O thin-film transistors
- PMID: 27877346
- PMCID: PMC5090337
- DOI: 10.1088/1468-6996/11/4/044305
Present status of amorphous In-Ga-Zn-O thin-film transistors
Abstract
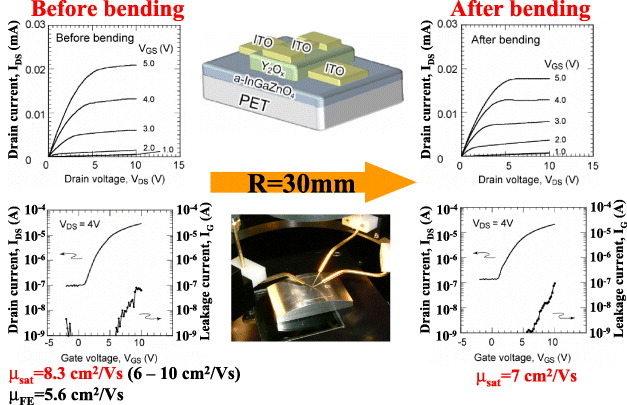
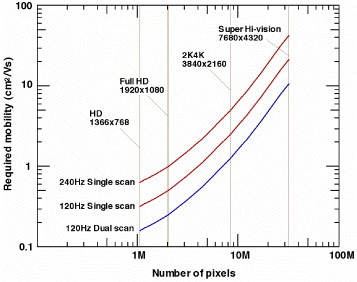
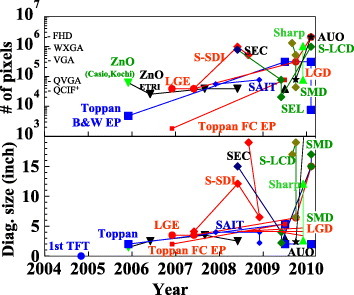
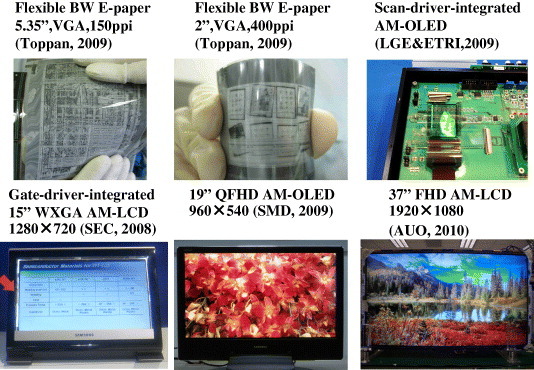
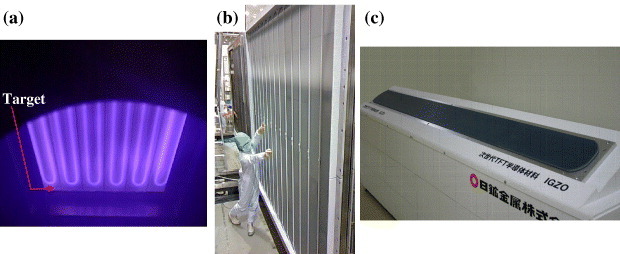
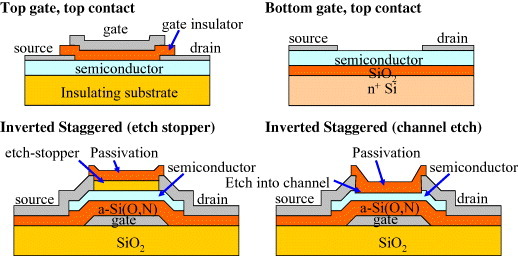
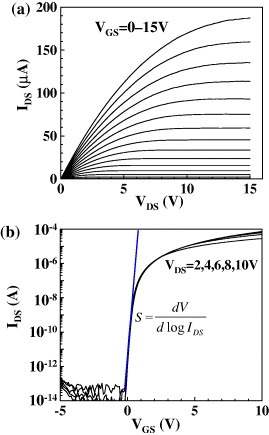
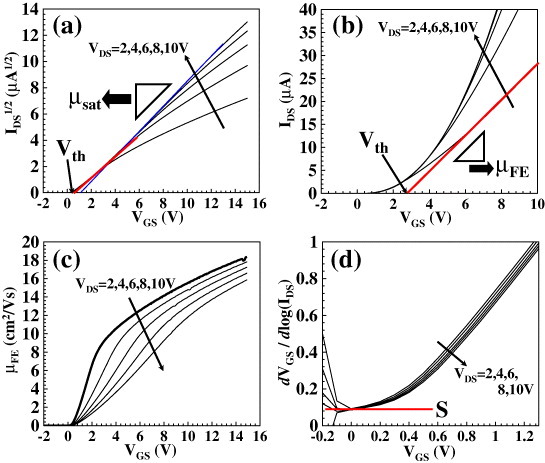
The present status and recent research results on amorphous oxide semiconductors (AOSs) and their thin-film transistors (TFTs) are reviewed. AOSs represented by amorphous In-Ga-Zn-O (a-IGZO) are expected to be the channel material of TFTs in next-generation flat-panel displays because a-IGZO TFTs satisfy almost all the requirements for organic light-emitting-diode displays, large and fast liquid crystal and three-dimensional (3D) displays, which cannot be satisfied using conventional silicon and organic TFTs. The major insights of this review are summarized as follows. (i) Most device issues, such as uniformity, long-term stability against bias stress and TFT performance, are solved for a-IGZO TFTs. (ii) A sixth-generation (6G) process is demonstrated for 32″ and 37″ displays. (iii) An 8G sputtering apparatus and a sputtering target have been developed. (iv) The important effect of deep subgap states on illumination instability is revealed. (v) Illumination instability under negative bias has been intensively studied, and some mechanisms are proposed. (vi) Degradation mechanisms are classified into back-channel effects, the creation of traps at an interface and in the gate insulator, and the creation of donor states in annealed a-IGZO TFTs by the Joule heating; the creation of bulk defects should also be considered in the case of unannealed a-IGZO TFTs. (vii) Dense passivation layers improve the stability and photoresponse and are necessary for practical applications. (viii) Sufficient knowledge of electronic structures and electron transport in a-IGZO has been accumulated to construct device simulation models.
Keywords: amorphous oxide semiconductor; liquid crystal display; mass production; mobility; organic light-emitting diode display; stability; thin-film transistor.
Figures
Similar articles
-
Quantum Confinement Effect in Amorphous In-Ga-Zn-O Heterojunction Channels for Thin-Film Transistors.Materials (Basel). 2020 Apr 20;13(8):1935. doi: 10.3390/ma13081935. Materials (Basel). 2020. PMID: 32325945 Free PMC article.
-
Graded Channel Junctionless InGaZnO Thin-Film Transistors with Both High Transporting Properties and Good Bias Stress Stability.ACS Appl Mater Interfaces. 2020 Sep 30;12(39):43950-43957. doi: 10.1021/acsami.0c13873. Epub 2020 Sep 18. ACS Appl Mater Interfaces. 2020. PMID: 32886486
-
Rare-metal-free high-performance Ga-Sn-O thin film transistor.Sci Rep. 2017 Mar 14;7:44326. doi: 10.1038/srep44326. Sci Rep. 2017. PMID: 28290547 Free PMC article.
-
A Review for Compact Model of Thin-Film Transistors (TFTs).Micromachines (Basel). 2018 Nov 15;9(11):599. doi: 10.3390/mi9110599. Micromachines (Basel). 2018. PMID: 30445799 Free PMC article. Review.
-
IGZO-Based Electronic Device Application: Advancements in Gas Sensor, Logic Circuit, Biosensor, Neuromorphic Device, and Photodetector Technologies.Micromachines (Basel). 2025 Jan 21;16(2):118. doi: 10.3390/mi16020118. Micromachines (Basel). 2025. PMID: 40047564 Free PMC article. Review.
Cited by
-
Investigating the Local Bonding Structure of Amorphous Zinc Tin Oxide to Elucidate the Effect of Altering the Intercation Ratio.J Phys Chem C Nanomater Interfaces. 2024 Sep 20;128(39):16733-16739. doi: 10.1021/acs.jpcc.4c04225. eCollection 2024 Oct 3. J Phys Chem C Nanomater Interfaces. 2024. PMID: 39380974 Free PMC article.
-
Analysis of Threshold Voltage Shift for Full VGS/VDS/Oxygen-Content Span under Positive Bias Stress in Bottom-Gate Amorphous InGaZnO Thin-Film Transistors.Micromachines (Basel). 2021 Mar 19;12(3):327. doi: 10.3390/mi12030327. Micromachines (Basel). 2021. PMID: 33808738 Free PMC article.
-
Amorphous thin-film oxide power devices operating beyond bulk single-crystal silicon limit.Sci Rep. 2021 May 3;11(1):9435. doi: 10.1038/s41598-021-88222-7. Sci Rep. 2021. PMID: 33941794 Free PMC article.
-
Defect Passivation and Carrier Reduction Mechanisms in Hydrogen-Doped In-Ga-Zn-O (IGZO:H) Films upon Low-Temperature Annealing for Flexible Device Applications.Materials (Basel). 2022 Jan 3;15(1):334. doi: 10.3390/ma15010334. Materials (Basel). 2022. PMID: 35009480 Free PMC article.
-
Artificial semiconductor/insulator superlattice channel structure for high-performance oxide thin-film transistors.Sci Rep. 2013;3:2737. doi: 10.1038/srep02737. Sci Rep. 2013. PMID: 24061388 Free PMC article.
References
-
- Kim H D, Park J-S, Mo Y G and Kim S S. 2009. 9th Int. Meeting on Information Display (12–16 October 2009, Seoul, Korea) 3-1
-
- Hung M-C, Lin W-T, Chang J J, Chen P-L, Wu C-Y, Lin C-J, Chiu H-L, Huang C-Y and Kao Y-C. 2010. Int. Workshop on Transparent Amorphous Oxide Semiconductors 2010 (25–26 January 2010, Tokyo, Japan)
-
- Kamiya T. and Hosono H. NPG Asia Mater. 2010;2:1522.
-
- Kamiya T, Nomura K. and Hosono H. J. Disp. Technol. 2009;5:273. doi: 10.1109/JDT.2009.2021582. - DOI
Publication types
LinkOut - more resources
Full Text Sources
Other Literature Sources