Review
. 2012 Nov 20;13(5):053003.
doi: 10.1088/1468-6996/13/5/053003. eCollection 2012 Oct.

Revisiting some chalcogenides for thermoelectricity

Affiliations
Review

Revisiting some chalcogenides for thermoelectricity

Antoine Maignan et al. Sci Technol Adv Mater. .

Abstract

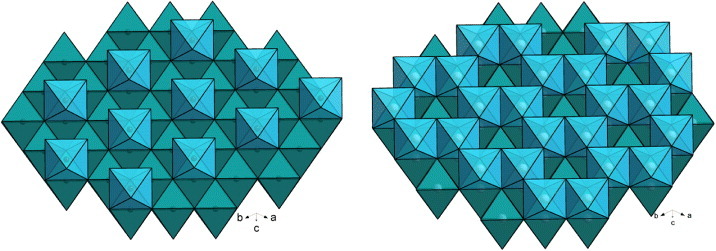
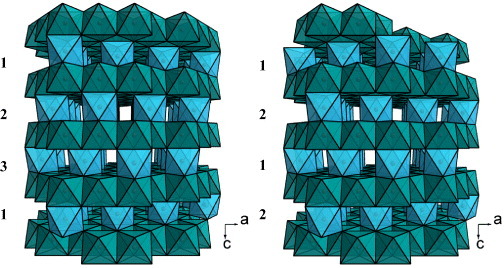
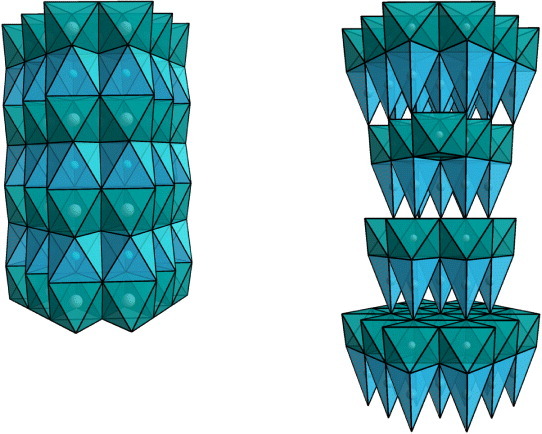
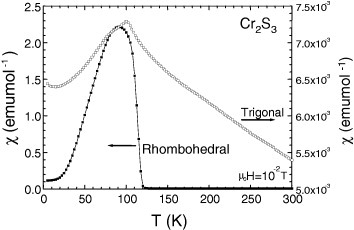
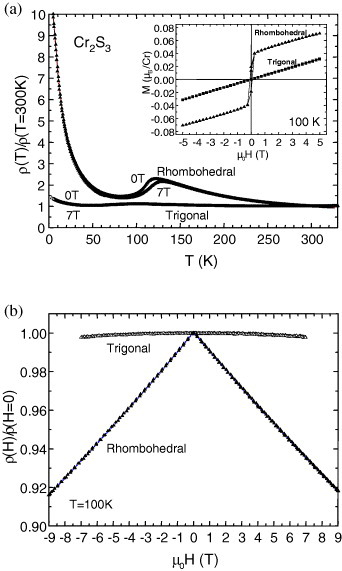
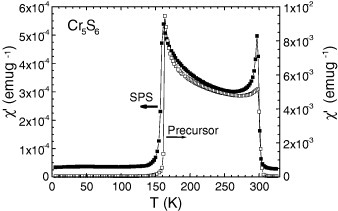
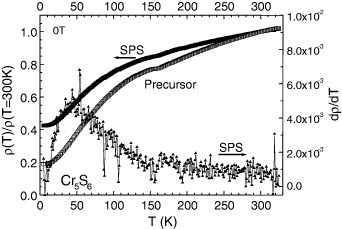
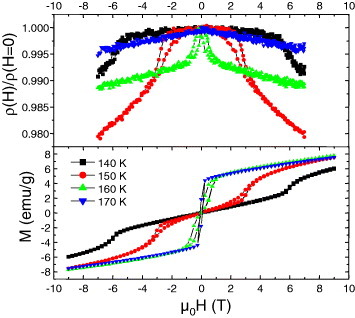
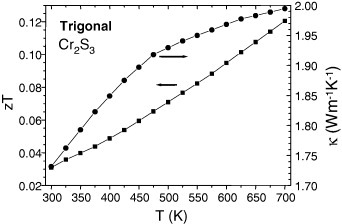
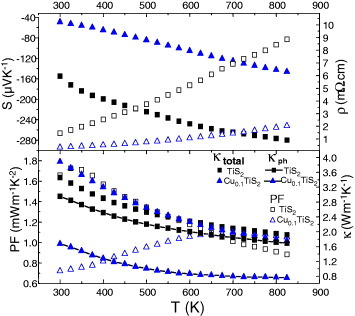
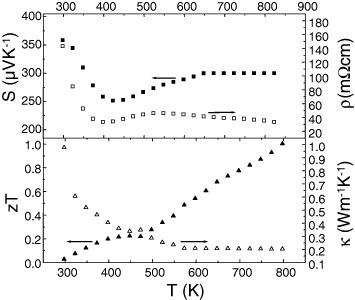
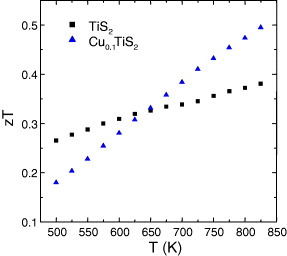
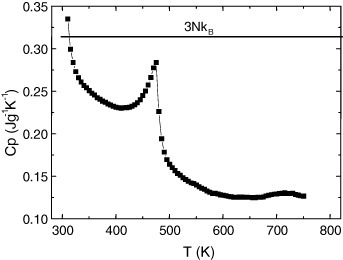
Thermoelectric materials that are efficient well above ambient temperature are needed to convert waste-heat into electricity. Many thermoelectric oxides were investigated for this purpose, but their power factor (PF) values were too small (∼10-4 W m-1 K-2) to yield a satisfactory figure of merit zT. Changing the anions from O2- to S2- and then to Se2- is a way to increase the covalency. In this review, some examples of sulfides (binary Cr-S or derived from layered TiS2) and an example of selenides, AgCrSe2, have been selected to illustrate the characteristic features of their physical properties. The comparison of the only two semiconducting binary chromium sulfides and of a layered AgCrSe2 selenide shows that the PF values are also in the same order of magnitude as those of transition metal oxides. In contrast, the PF values of the layered sulfides TiS2 and Cu0.1TiS2 are higher, reaching ∼10-3 W m-1 K-2. Apparently the magnetism related to the Cr-S network is detrimental for the PF when compared to the d0 character of the Ti4+ based sulfides. Finally, the very low PF in AgCrSe2 (PF = 2.25 × 10⁻⁴ W m1 K-2 at 700 K) is compensated by a very low thermal conductivity (κ = 0.2 W m-1 K-1 from the measured Cp) leading to the highest zT value among the reviewed compounds (zT700K = 0.8). The existence of a glassy-like state for the Ag+ cations above 475 K is believed to be responsible for this result. This result demonstrates that the phonon engineering in open frameworks is a very interesting way to generate efficient thermoelectric materials.

Keywords: chromium selenide; chromium sulfide; thermoelectricity; titanium sulfide.


Figures

Figure 1
Figure 1
Structural models for Cr2S3 (left) and Cr5S6 (right). The stacking of S layers creates octahedral voids which are fully occupied to form a dense CrS layer of CrS6 edge-shared octahedra which alternates with a partially filled layer, Cr1/3S (left) and Cr2/3S (right) for Cr2S3 and Cr5S6, respectively.
Figure 2
Figure 2
Structural models for Cr2S3. Two sequences, 1–2–3 and 1–2–1–2, are obtained along the stacking direction c, corresponding to the rhombohedral and trigonal forms, respectively.
Figure 3
Figure 3
Structures of CuxTiS2 (left) and AgCrSe2 (right). Both structures can be described as a stacking of CdI2-type layers, TiS2 or CrSe2 (Ti or Cr cations are at the centers of the green octahedra), with Cu cation in the van der Waals spacing (blue octahedra) or Ag in tetrahedral coordination (blue tetrahedra), respectively.
Figure 4
Figure 4
Temperature-dependent magnetic susceptibility (χ = M/H) for Cr2S3 before (rhombohedral R-Cr2S3, left y-axis) and after SPS (trigonal T-Cr2S2.8, right y-axis). The measurements were carried out in the zero-field cooling mode.
Figure 5
Figure 5
(a) Normalized electrical resistivity (ρ) as a function of temperature for both Cr2S3 samples, rhombohedral R-Cr2S3 and trigonal T-Cr2S2.8. The data collected upon cooling in H = 0 and 7 T reveal the existence of a negative magnetoresistance in the TN region for the rhombohedral precursor R-Cr2S3. Inset: magnetic field driven magnetization (M) for both Cr2S3 samples (T = 100 K). (b) Magnetic field (H) driven normalized resistivity collected at 100 K for both Cr2S3 samples.
Figure 6
Figure 6
Temperature dependence of the ac magnetic susceptibility (χ′, real part) for Cr5S6, before and after SPS (μ0Hac = 10 Oe, f = 100 Hz).
Figure 7
Figure 7
Normalized electrical resistivity for Cr5S6 (left y-axis). The corresponding dρ/dT = f(T) curve is also given for the SPS sample (right y-axis).
Figure 8
Figure 8
Top panel: magnetic field (H) driven resistance ratio for Cr5S6. The temperatures are indicated in the bottom panel where the corresponding M(H) curves are given. The measurements were performed with current perpendicular to H.
Figure 9
Figure 9
Temperature-dependent specific heat C of the Cr5S6 precursor measured upon warming (right y-axis) and corresponding χ(T) curves measured upon cooling (c) and warming (w) after zero-field-cooling (zfc) and field-cooling (fc) processes (left y-axis).
Figure 10
Figure 10
Temperature-dependent Seebeck coefficient (S) for the precursor and SPS-treated Cr2S3 (a) and Cr5S6 (b).
Figure 11
Figure 11
Temperature dependences of ρ and S for SPS-treated Cr5S6.
Figure12
Figure12
SPS-densified Cr5S6: PF and κ versus temperature.
Figure 13
Figure 13
Trigonal densified Cr2S3 sample T-Cr2S2.8. Thermal conductivity (right y-axis), and zT (left y-axis) versus temperature.
Figure 14
Figure 14
CuxTiS2 (x = 0.00 and x = 0.10). Top panel: S(T) (solid symbols), ρ(T) (open symbols). Lower panel: PF(T), κ(T) [total and lattice part κph].
Figure 15
Figure 15
AgCrSe2: ρ(T), S(T), zT(T) and κ(T).
Figure 16
Figure 16
zT curves for CuxTiS2 with x = 0 and 0.10.
Figure 17
Figure 17
Temperature dependence of specific heat for AgCrSe2. The horizontal line indicates the Dulong Petit value 3NkB.

References

    1. Rowe D M, editor. CRC Handbook of Thermoelectrics. London: Taylor and Francis; 1995.
    1. Snyder G F. and Toberer E. Nature Mater. 2008;7:105. doi: 10.1038/nmat2090. - DOI - PubMed
    1. Koumoto K, Terasaki I. and Funahashi R. MRS Bull. 2006;31:206. doi: 10.1557/mrs2006.46. - DOI
    1. Terasaki I. J. Appl. Phys. 2011;110(053705) doi: 10.1063/1.3626459. - DOI
    1. Rao C N R. and Pishardy K P R. Prog. Solid State Chem. 1976;10:207. doi: 10.1016/0079-6786(76)90009-1. - DOI

LinkOut - more resources