Review
. 2015 May 8;16(3):034605.
doi: 10.1088/1468-6996/16/3/034605. eCollection 2015 Jun.

Geosynthetics in geoenvironmental engineering

Affiliations
Review

Geosynthetics in geoenvironmental engineering

Werner W Müller et al. Sci Technol Adv Mater. .

Abstract

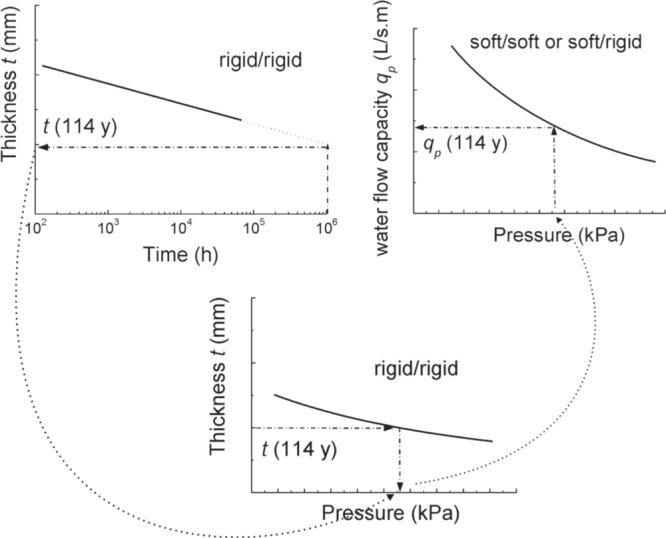
Geosynthetics are planar polymeric products, which are used in connection with soil, rock or other soil-like materials to fulfill various functions in geoenvironmental engineering. Geosynthetics are of ever-growing importance in the construction industry. Sealing of waste storage facilities to safely prevent the emission of wastewater, landfill gas and contaminated dust as well as the diffusion of pollutants into the environment and coastal protection against storms and floods and reconstruction after natural disaster are important fields of application. We will give an overview of the various geosynthetic products. Two examples of the material problems related to geosynthetics are discussed in detail: the effect of creep on the long-term performance of geocomposite drains and the numerical simulation of the interaction of soil with geogrids. Both issues are of importance for the use of these products in landfill capping systems. The various functions, which geosynthetics may fulfill in the protection of coastal lines, are illustrated by case studies. The geosynthetic market is evaluated and economical and environmental benefits, as well as environmental side effects related to the use of geosynthetics, are discussed.

Keywords: coastal protection; geocomposite drain; geoenvironmental engineering; geogrid; geosynthetics; geotextile; landfill capping system.


Figures

Figure 1.
Figure 1.
Various samples of geosynthetics. From bottom to top: rough black surface of a high density polyethylene (HDPE) geomembrane, white carrier nonwoven geotextile, black geonet, white nonwoven filter geotextile (folded back), black woven geogrid and a white sand-filled geocontainer made of a nonwoven.
Figure 2.
Figure 2.
Geomembrane installation as part of the construction of a base liner system of a landfill. Source: Schicketanz, Aachen.
Figure 3.
Figure 3.
Geocomposite drain consisting of needle-punched nonwoven filter and carrier geotextiles of polypropylene staple fibers each having a mass per area of 200 g m2 and a drain core of flexible wave shaped random arrays of extruded PP strands having a mass per area of about 600–700 g m2.
Figure 4.
Figure 4.
Geocomposite drain consisting of needle-punched nonwoven filter and carrier geotextiles of polypropylene staple fibers each having a mass per area of 200 g m2. A biplanar HDPE geonet with mass per area of about 900 g m2 was used as drain core.
Figure 5.
Figure 5.
Installation of a geocomposite drain (top). Geocomposite drains are in most cases used on more or less steep slopes of landfill capping systems (bottom).
Figure 6.
Figure 6.
Schematic illustration of the method to determine the long-term water flow capacity of geocomposite drains from short-term experimental values.
Figure 7.
Figure 7.
Short-term water flow capacity (gray) and long-term water flow capacity (black) as function of normal stress σ and tangent of slope angle δ (or ratio between shear and normal stress) for a bedding rigid/soft of a geocomposite drain sample as shown in figure 3.
Figure 8.
Figure 8.
Shear strength envelope in the diagram of shear stress versus normal stress for a sample geocomposite drain as shown in figure 3 with welded components and critical displacement sk as function of normal stress as obtained from a direct shear test.
Figure 9.
Figure 9.
Progression of shear stress with the displacement at various normal stresses σ as typically observed in the direct shear test (geocomposite drain as in figure 3 with welded bonds (top) and as in figure 4 with laminated bonds (bottom)). Arrows mark the critical displacement sk at which shear failure starts.
Figure 10.
Figure 10.
Creep curves as obtained for the geocomposite drain product shown in figure 3 at normal stresses of 146 and 200 kPa. The polymeric drain core recovers from collapse after releasing the stress.
Figure 11.
Figure 11.
Failure time with respect to drain core collapse versus normal stress as measured in creep rupture tests of the geocomposite drain sample shown in figure 3. Gray circles: ratio of shear stress to normal stress 1:3. Black circles: pure normal stress.
Figure 12.
Figure 12.
Geogrids are used to prevent sliding on long and steep slopes during installation and use of a landfill capping system [58].
Figure 13.
Figure 13.
Anchorage trench of a geogrid [59].
Figure 14.
Figure 14.
Schematic picture of an anchoring construction and the various components in a landfill capping system. The relevant failure mechanisms are indicated.
Figure 15.
Figure 15.
Schematic view of a geogrid. It consists of longitudinal elements (LE) and transverse elements (TE). At the crossing of both elements are the junctions (J). The indicated parameters are used to describe the geometry of the geogrid. The soil which surrounds the embedded geogrid and fills the openings will resist any movement of the geogrid. Thereby an ‘Earth pressure’ or a ‘bearing resistance’ σp is mobilized in front of each section of the TE.
Figure 16.
Figure 16.
Illustration of the discrete segment model, which was used to simulate the load transfer mechanisms and pull-out behavior of a geogrid. Above: a normal segment of the longitudinal element, below: a segment, which contained a transverse element with ng junctions.
Figure 17.
Figure 17.
Example of the relation between shear strength τsg(s) due to interface friction and displacement s at a segment (top-right panel). Such a type of curve is typically measured in a shear box test of the friction between geogrid and soil. Example of a diagram of tensile force Z versus strain used for a segment (middle-right panel). Tensile strength which is transfered per junction ZK(s) from LE to TE and compensated by the soil resistance as function of displacement s (bottom-right panel). Failure of the junction may occur at certain level. Distribution of the pull-out resistance (top-left panel) and the displacement (middle-left panel) along the imbedded geogrid length during a ‘numerical’ pull-out test of a flexible geogrid with limited junction strength. The result of the simulated pull-out test is shown at the bottom-left panel: pull-out resistance Pr of the geogrid versus pull-out displacement u. Various stages of the pull-out process are indicated by consecutive numbers.
Figure 18.
Figure 18.
(a) Schematic view of revetments of dikes and forelands [11]. (b) Canal embankment: relocation of revetment elements and exposure of the layer underneath. Geotextile filters may prevent erosion of the mineral liner [33].
Figure 19.
Figure 19.
Geotextile tubes hyraulically filled with sand as reclamation dike unit. Source: [60].
Figure 20.
Figure 20.
Test field of geotextile tubes hyraulically filled with sand for scour protection. Source: Cantré and Saathoff, Universität Rostock, Chair of Geotechnics and Coastal Engineering.
Figure 21.
Figure 21.
Nonwoven geotextile containers have advantages compared to woven geotextile containers because of high robustness and large elongation at break [36, 37].
Figure 22.
Figure 22.
(a) Storm tide barrage at the Eider river. Scheme of the realized profile of bed stabilization at the outer embankment [36, 37]. It shows the crossover from the deep, seaward scour (left) to the shallow embankment in front of the storm tide barrage construction, which is located at about 150 m to the right (M Thw: Mean high tide water level). (b). Landward aerial view of the storm tide barrage at the Eider river. Source: Ulf Jungjohann, Heide, Germany.
Figure 23.
Figure 23.
Mega sand container with a by then unprecedented size of 20 m (length) × 4.80 m (diameter) as presented in 1999 on an open day for the public at the construction site [39, 40].
Figure 24.
Figure 24.
Island Sylt, 1999. Geotextile sand cushions successfully defended the historic house ‘Kliffende’ against storms, which strongly eroded the cliffs on the north and south sides of the sand cushion barrier [61]. Source: V Frenzel, Sylt-Picture.
Figure 25.
Figure 25.
Schematic illustration: scour protection with nonwoven geotextile sand container and installation of monopile foundation of off-shore wind energy turbines [42].

References

    1. Koerner R M. Designing with Geosynthetics. London: Prentice-Hall; 1998.
    1. Müller W W. HDPE Geomembranes in Geotechnics. Berlin: Springer; 2007.
    1. Sarsby R W, editor. Geosynthetics in Civil Engineering. Cambridge: Woohhead Publishing Limited; 2007.
    1. 2009 Recommended Descriptions of Geosynthetics, Functions, Geosynthetics Terminology, Mathematical and Graphical Symbols (Easley, SC: International Geosynthetics Society (IGS) Secretariat)
    1. Terzaghi K, Peck R B. and Mesri G. Soil Mechanics in Engineering Practice. New York: Wiley; 1996.