. 2017 Apr;50(2):e12319.
doi: 10.1111/cpr.12319. Epub 2016 Nov 23.

Downregulation of B-myb promotes senescence via the ROS-mediated p53/p21 pathway, in vascular endothelial cells

Affiliations

Downregulation of B-myb promotes senescence via the ROS-mediated p53/p21 pathway, in vascular endothelial cells

Zhihui Zhou et al. Cell Prolif. 2017 Apr.

Abstract

Objectives: To reveal whether B-myb is involved in preventing senescence of vascular endothelial cells, and if so, to identify possible mechanisms for it.

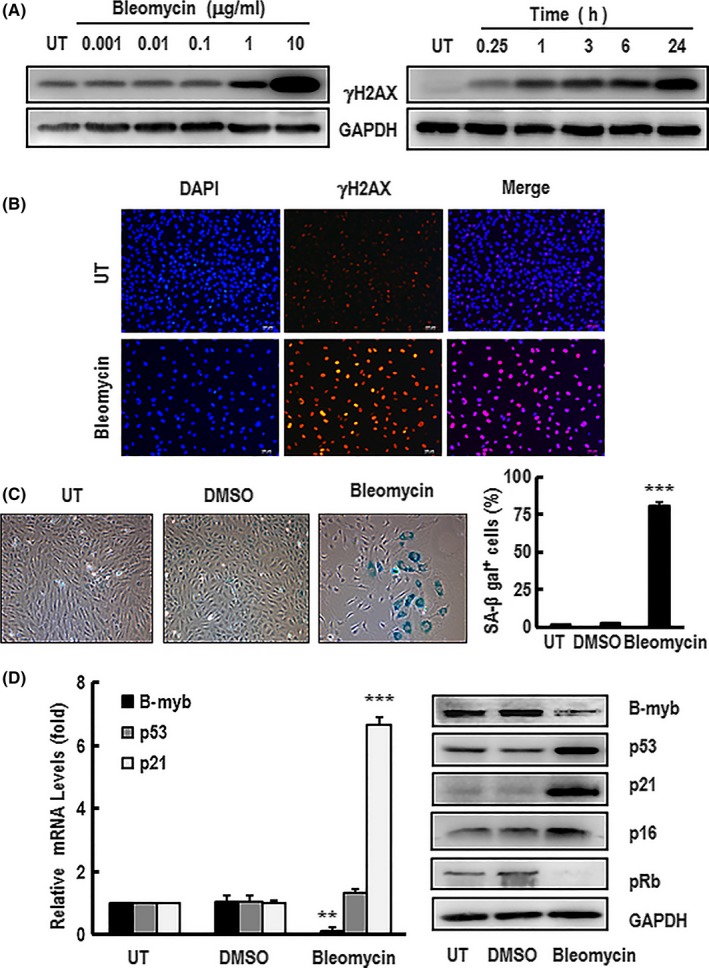
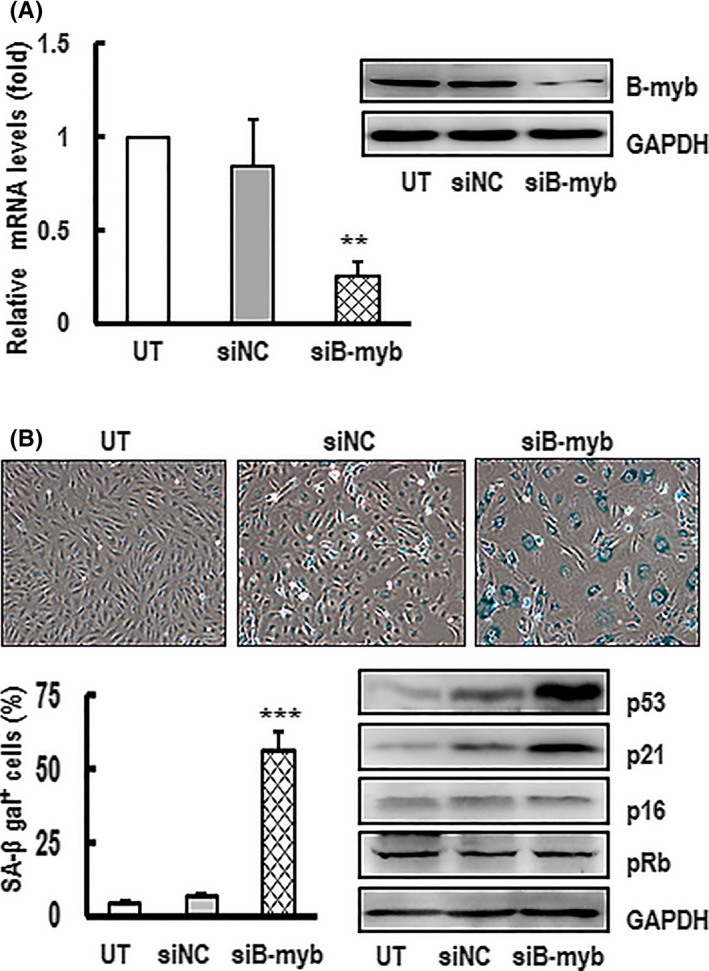
Materials and methods: C57/BL6 male mice and primary human aortic endothelial cells (HAECs) were used. Bleomycin was applied to induce stress-related premature senescence. B-myb knockdown was achieved using an siRNA technique and cell senescence was assessed using the senescence-associated β-galactosidase (SA-β-gal) assay. Intracellular reactive oxygen species (ROS) production was analysed using an ROS assay kit and cell proliferation was evaluated using KFluor488 EdU kit. Capillary tube network formation was determined by Matrigel assay. Expressions of mRNA and protein levels were detected by real-time PCR and western blotting.

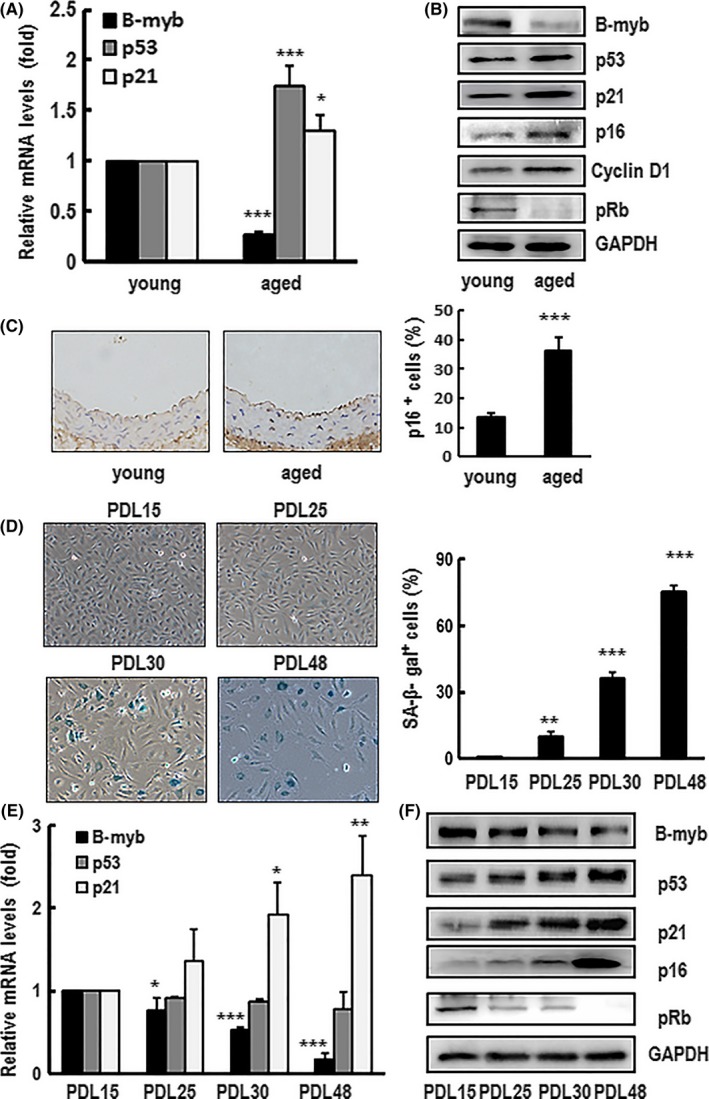
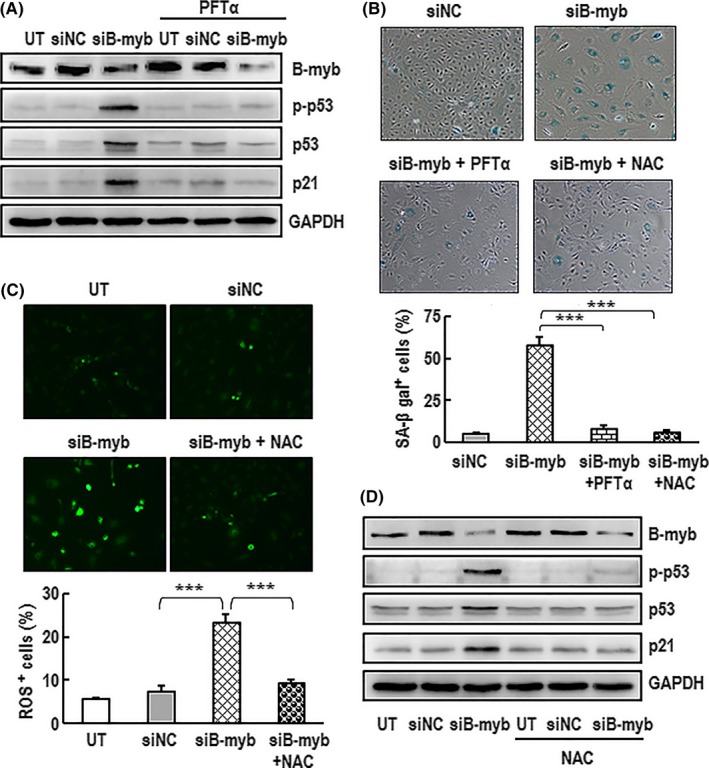
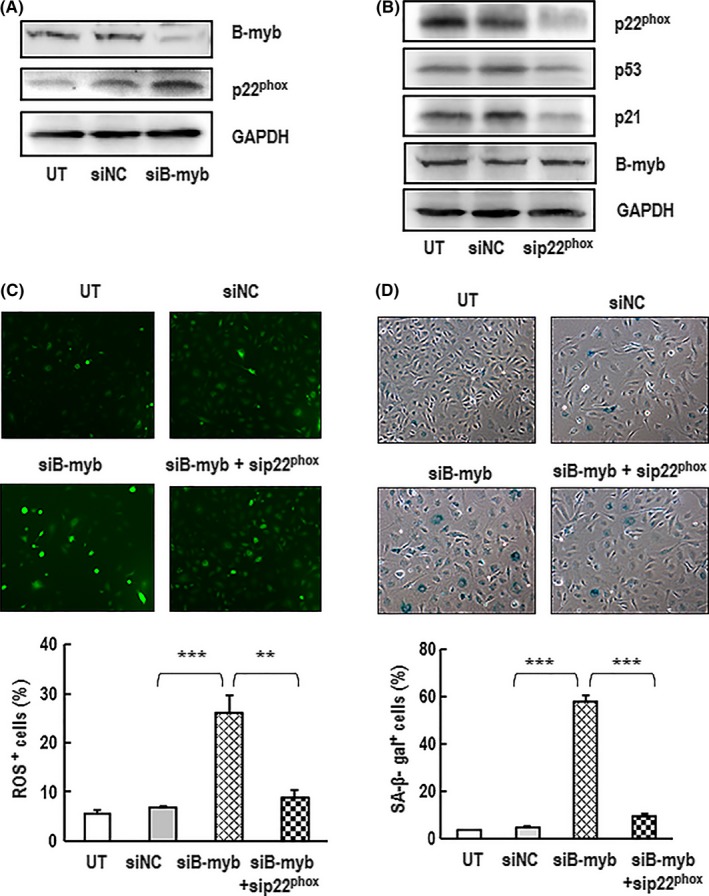
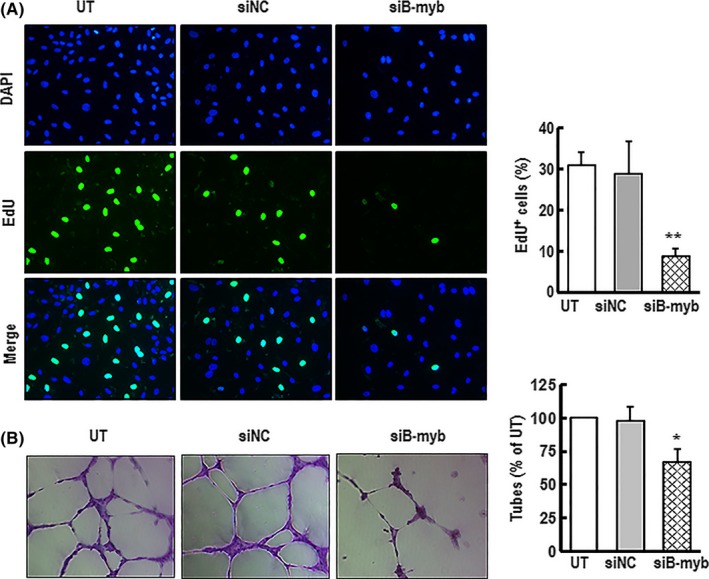
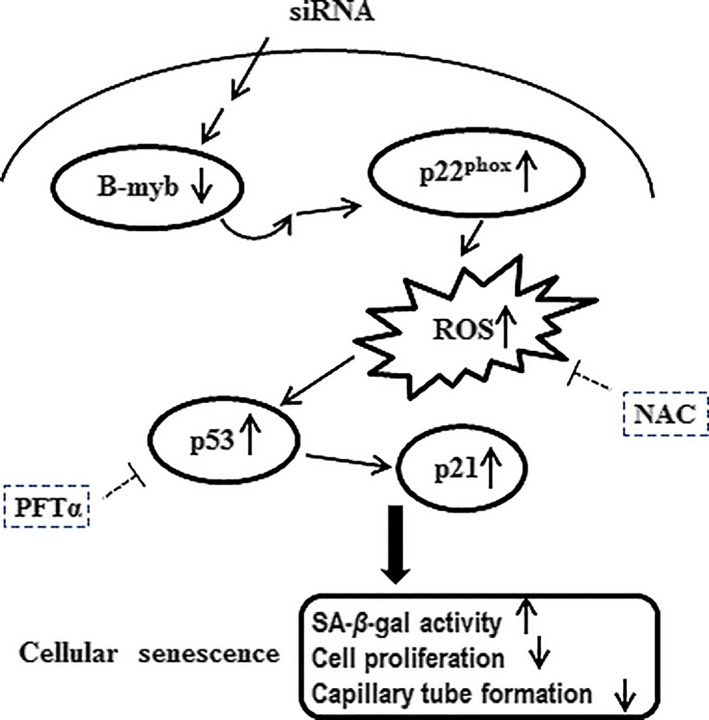
Results: B-myb expression significantly decreased, while p53 and p21 expressions increased in the aortas of aged mice. This expression pattern was also found in replicative senescent HAECs and senescent HAECs induced by bleomycin. B-myb knockdown resulted in upregulation of p22phox , ROS accumulation and cell senescence of HAECs. Downregulation of B-myb significantly inhibited cell proliferation and capillary tube network formation and activated the p53/p21 signalling pathway. Blocking ROS production or inhibiting p53 activation remarkably attenuated SA-β-gal activity and delayed cell senescence induced by B-myb-silencing.

Conclusion: Downregulation of B-myb induced senescence by upregulation of p22phox and activation of the ROS/p53/p21 pathway, in our vascular endothelial cells, suggesting that B-myb may be a novel candidate for regulating cell senescence to protect against endothelial senescence-related cardiovascular diseases.


Figures

Figure 1
Figure 1
B‐myb was downregulated in the aortas of aged mice and human aortic endothelial cells (HAECs) undergoing replicative senescence. (A, B) The mRNA and/or protein expression levels of B‐myb, p53, p21, p16, pRb and cyclin D1 in the aortas of young (3 months) and aged (24 months) mice groups were analysed by real‐time PCR and western blotting. Each relative mRNA value was justified to the housekeeping gene GAPDH before normalization with that of the controls. Data are presented as mean ± SEM of three independent experiments. ∗ and ∗∗∗ indicate P<.05 and P<.001, respectively, between the two groups. A typical group of blots is shown and similar results were obtained in three separate experiments. GAPDH was used as a loading control. (C) Representative image of immunohistochemistry analysis performed with p16 antibody. A typical group of immunostaining is shown and similar results were obtained from young and aged groups. The percentage of senescent cells marked with p16 was calculated. Data are presented as mean ± SEM of three different samples. *** indicates P<.001 between the two groups. (D) Primary cultured HAECs at 15, 25, 30 and 48 population doubling (PDL) were stained by senescence‐associated β‐galactosidase (SA‐β‐gal). The SA‐β‐gal‐positive cells were directly observed under Nikon inverted microscope, and the representative images were shown (×100 magnification). After analysing SA‐β‐gal‐positive cells, the percentage rate is presented as mean ± SEM of three independent experiments. ** and *** indicate P<.01 and P<.001, respectively, compared with PDL15 cells. (E, F) The mRNA and/or protein expression levels of B‐myb, p53, p21, p16 and pRb in different PDLs cells were detected by real‐time PCR and western blotting. Each relative mRNA value was justified to the housekeeping gene GAPDH before normalization with that of the controls. Data are presented as mean ± SEM of three independent experiments. *, ** and *** indicate P<.05, P<.01and P<.001, respectively, compared with PDL15 cells. A typical group of blots is shown, and similar results were obtained in three separate experiments. GAPDH was used as a loading control
Figure 2
Figure 2
HAEC premature senescence induced by bleomycin influenced the expression of B‐myb, p53, p21, p16 and pRb. A, The dose‐response curves and time course of activation of γH2AX were detected by western blotting after HAECs were treated with bleomycin in the indicated concentrations for 24 h or 10 μg/mL bleomycin for the time period indicated. GAPDH was used as a loading control. These blots were obtained from one of three independent experiments. B, Cells were stimulated with 10 μg/mL bleomycin for 24 h before immunostaining with antibodies against γH2AX (red) and counterstaining with DAPI (blue). A representative group image of stained cells was observed under fluorescence microscope (×100 magnification). HAECs were treated with 10 μg/mL bleomycin for 60 min following replacement of normal culture medium for 4 d. C, The SA‐β‐gal‐positive cells were observed under inverted microscope (×100 magnification) after the treated cells were stained with senescence‐associated β‐galactosidase (SA‐β‐gal). The percentage rate of SA‐β‐gal‐positive cells was analysed. Data are presented as mean ± SEM of three independent experiments. *** indicates P<.001 compared with the control. D, The expression mRNA and/or protein levels of B‐myb, p53, p21, p16 and pRb in the treated cells were detected by real‐time PCR and western blotting, respectively. GAPDH was used for normalization. The mRNA data are presented as mean ± SEM of three independent experiments. ** and *** indicate P<.01 and P<.001, respectively, compared with the control. A typical group of blots for analysing the expression proteins levels of B‐myb, p53 and p21 in the cells is showed from one of three independent experiments. GAPDH was used as a loading control
Figure 3
Figure 3
Inhibition of B‐myb expression promoted HAECs undergoing premature senescence and upregulating p53 and p21 expression. A, HAECs were transfected with siRNA against B‐myb (siB‐myb) or the controls (siNC) for 3 d. The knockdown efficiencies of B‐myb mRNA and protein levels were confirmed by real‐time PCR and western blotting. GAPDH was used for normalization. The mRNA data are presented as mean ± SEM of three independent experiments. ** indicates P<.01 compared with the control. A typical group of blots was shown from one of three independent experiments. GAPDH was used as a loading control. B, The percentage rate of SA‐β‐gal‐positive cells and the expression protein levels of p53, p21, p16 and pRb were analysed after the cells were transfected with siB‐myb or siNC for 7 d. The SA‐β‐gal‐positive cells were observed under inverted microscope (×100 magnification) after the treated cells were stained with senescence‐associated β‐galactosidase (SA‐β‐gal). A representative group image of stained cultures is shown. The percentage rate of SA‐β‐gal‐positive cells was analysed. Results are presented as the mean ± SEM of three independent experiments. *** indicates P<.001 compared with the control. A typical group of blots for analysing the expression protein levels of p53 and p21 in the cells is shown from one of three independent experiments. GAPDH was used as a loading control
Figure 4
Figure 4
Silenced B‐myb induced cell premature senescence through the ROS/p53/p21 pathway. A, HAECs were per‐incubated with PFTα (3 μmol/L) for 60 min followed by transfected with siB‐myb or siNC in the presence of PFTα (3 μmol/L) for 7 d. The expression levels of B‐myb, p‐p53, p53 and p21 proteins were analysed by western blotting. GAPDH was used as a loading control. A typical group of blots is shown from one of three independent experiments. B, Cells were incubated with PFTα (3 μmol/L) or NAC (5 mmol/L) for 60 min followed by transfection with siB‐myb in the presence of PFTα (3 μmol/L) or NAC (5 mmol/L) for 7 d. The cells were then stained with SA‐β‐gal. A representative group image of stained cultures is shown (×100 magnification). The percentage rate of SA‐β‐gal‐positive cells was analysed. Data are presented as mean ± SEM of three independent experiments. *** indicates P<.001 compared between two groups. C, Cells were per‐incubated with NAC (5 mmol/L) for 60 min followed by transfection with siB‐myb in the presence of NAC (5 mmol/L) for 7 d. The production of intracellular ROS in the cells was determined with ROS indicator DCFHDA. A representative group image of stained cultures is shown (×100 magnification). The percentage rate of ROS‐positive cells was analysed. Data are presented as mean ± SEM of three independent experiments. *** indicates P<.001 compared between two groups. D, Cells were incubated with or without NAC (5 mmol/L) for 60 min followed by transfection with siB‐myb or siNC in the presence of NAC (5 mmol/L) for 7 d. The expression levels of B‐myb, p‐p53, p53 and p21 protein in the cell were analysed by western blotting. GAPDH was used as a loading control. A typical group of blots is shown from one of three independent experiments
Figure 5
Figure 5
NADPH oxidase was involved in B‐myb silencing induced cell premature senescence. A, HAECs were transfected with siB‐myb or siNC for 7 d. The protein expression levels of B‐myb, p22phox were analysed by western blotting. GAPDH was used as a loading control. A typical group of blots is shown from one of three independent experiments. B, Cells were transfected with sip22phox or siNC for 7 d. The protein expression levels of B‐myb, p53, p21 and p22phox in the cells were analysed by western blotting. GAPDH was used as a loading control. A typical group of blots is shown from one of three independent experiments. C, Cells were transfected with siB‐myb and sip22phox for 7 d. The productions of intracellular ROS in the cells were determined with ROS indicator DCFHDA. A representative group image of stained cultures was shown (×100 magnification). The percentages rate of ROS‐positive cells was analysed. Data are presented as mean ± SEM of three independent experiments. ** and *** indicate P<.05 and P<.001, respectively, between the two groups. D, Cells were transfected with siB‐myb and sip22phox for 7 d. The cells were then stained with SA‐β‐gal. A representative group image of stained cultures was shown (×100 magnification). The percentages rate of SA‐β‐gal‐positive cells was analysed. Data are presented as mean ± SEM of three independent experiments. *** indicates P<.001 between the two groups
Figure 6
Figure 6
Downregulation of B‐myb expression in HAECs inhibited cell proliferation and the formation of capillary tube networks. A, HAECs were transfected with siB‐myb or siNC for 3 d. The cell proliferation was detected by KFluor488‐EdU. A typical representative cell proliferation images are shown (green) (×200 magnification). The percentage rate of EdU‐positive cells was analysed. Results are presented as mean ± SEM of four independent experiments. ** indicates P<.01 compared with the control. B, After cells transfection with siB‐myb or siNC for 7 d, the cells were seeded on top of the Matrigel‐coated wells and incubated for 6 h at 37°C. Tubular structures were photographed through inverted microscope after the cells were stained with crystal violet. Representative images of formed tubes are shown (×100 magnification). The circumferences of formed capillary‐like tube were measured. Data are presented as mean ± SEM of three independent experiments. * indicates P<.05 compared with the control
Figure 7
Figure 7
Schematic summary of the signalling pathway underlying the senescence of HAECs induced by downregulation of B‐myb. Knockdown of B‐myb by siB‐myb upregulates p22phox, which can promote ROS production in primary cultured HAECs. Excessive ROS accumulation can activate p53/p21 pathway which is the major pathway of senescence, causing further cellular senescence. The upregulation of p53 and p21 can be blocked by ROS scavenger NAC or specific p53 inhibitor PFTα in B‐myb knockdown‐induced senescence. These findings suggest that activation of ROS/p53/p21 signalling pathway is involved in B‐myb knockdown‐induced senescence in HAECs

Similar articles

Cited by

References

    1. Salama R, Sadaie M, Hoare M, Narita M. Cellular senescence and its effector programs. Genes Dev. 2014;28:99–114. - PMC - PubMed
    1. Kuilman T, Michaloglou C, Mooi WJ, Peeper DS. The essence of senescence. Genes Dev. 2010;24:2463–2479. - PMC - PubMed
    1. Harley CB, Futcher AB, Greider CW. Telomeres shorten during aging of human fibroblasts. Nature. 1990;345:458–460. - PubMed
    1. Bodnar AG, Ouellette M, Frolkis M, et al. Extension of life span by introduction of telomerase into normal human cells. Science. 1998;279:349–352. - PubMed
    1. Yu Q, Katlinskaya YV, Carbone CJ, et al. DNA‐damage‐induced type I interferon promotes senescence and inhibits stem cell function. Cell Rep. 2015;11:785–797. - PMC - PubMed

MeSH terms

Associated data