. 2017 Jul 1;23(13):3428-3441.
doi: 10.1158/1078-0432.CCR-16-2020. Epub 2016 Nov 22.

Alternative Splicing of EZH2 pre-mRNA by SF3B3 Contributes to the Tumorigenic Potential of Renal Cancer

Affiliations

Alternative Splicing of EZH2 pre-mRNA by SF3B3 Contributes to the Tumorigenic Potential of Renal Cancer

Ke Chen et al. Clin Cancer Res. .

Erratum in

Abstract

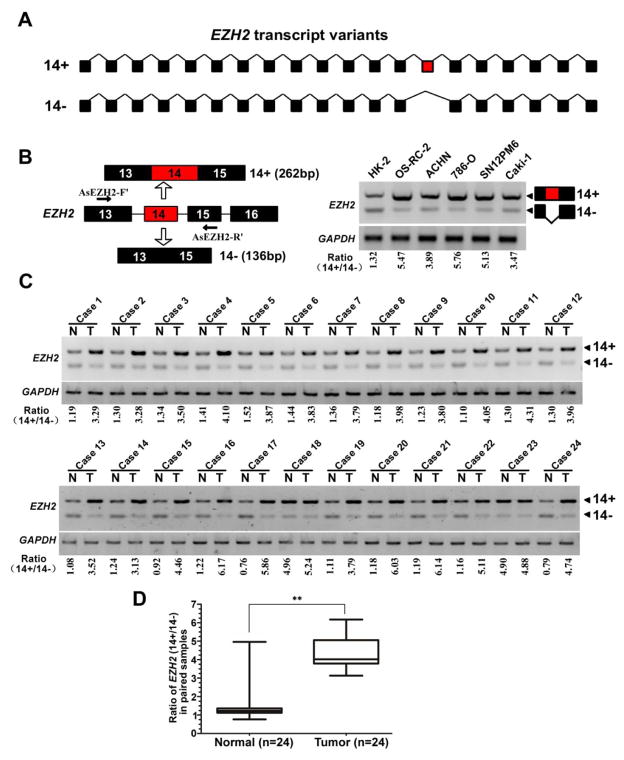
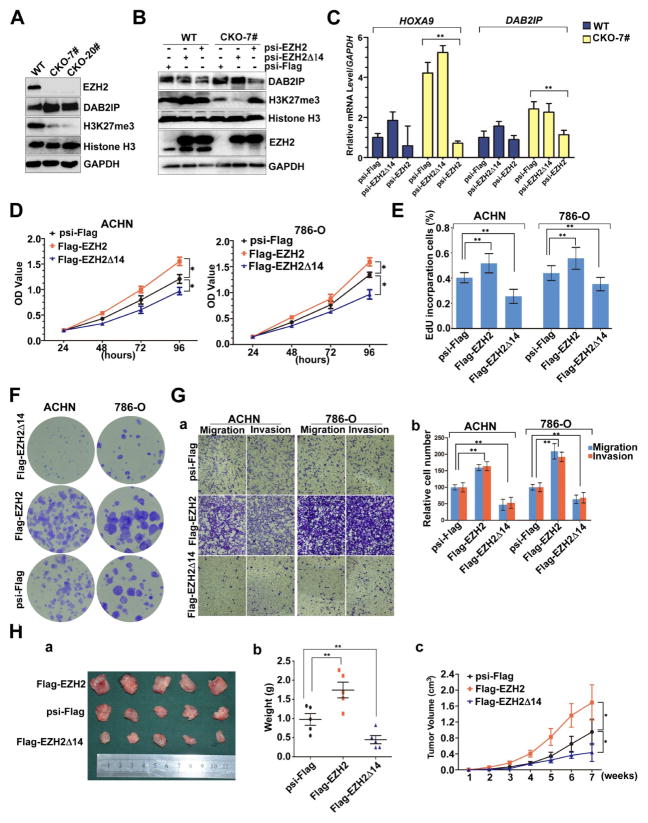
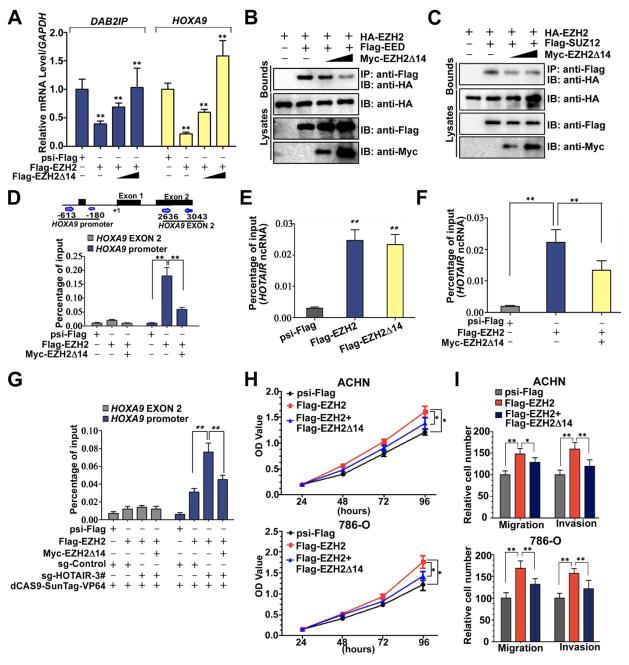
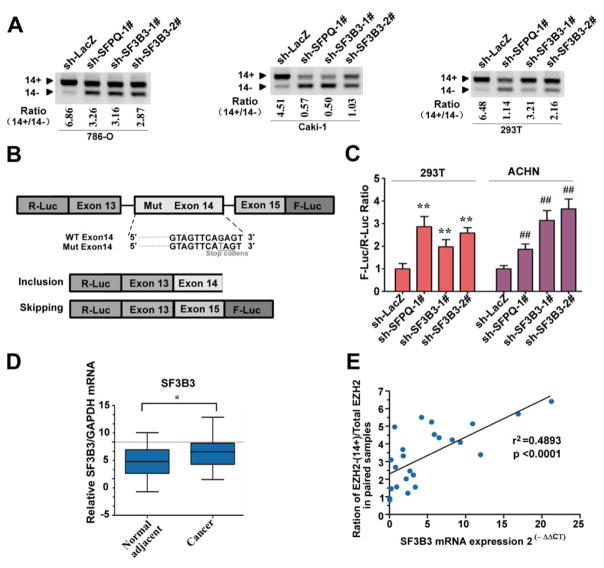
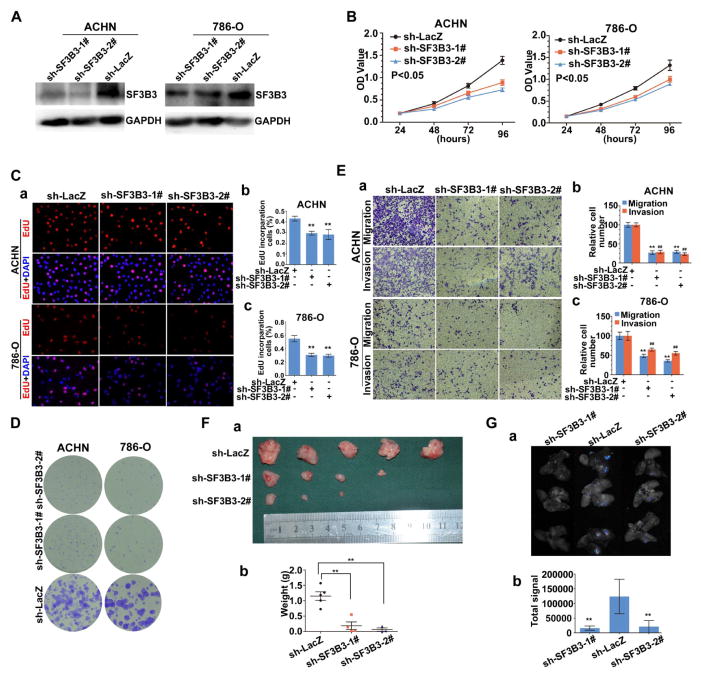
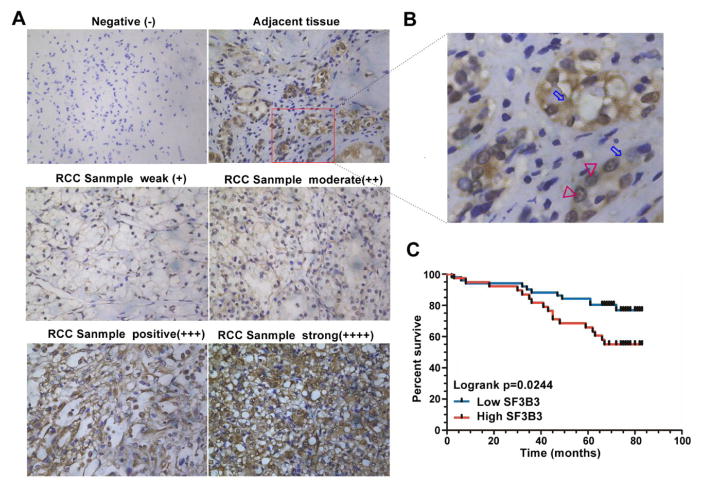
Purpose: Deregulation or mutation of the EZH2 gene causes various tumors, including clear cell renal cell carcinoma (ccRCC). Although several splice variants of EZH2 have been identified, little is known about how EZH2 splicing is regulated or the contribution of alternative splicing to its protumorigenic functions.Experimental Design: We conducted RT-PCR, Western blot analysis, and IHC techniques to examine EZH2 and its alternative splicing transcript expression in renal cancer tissue and renal cancer cell lines. Proliferation, migration, clonogenicity, and tumorigenicity of renal cancer cells either exhibiting knockdown of EZH2 or its splicing factor SF3B3 were assessed by CCK8, Transwell assay, and murine xenograft experiments.Results: We found that the inclusion of alternative EZH2 exon 14 was significantly increased in ccRCC samples and renal cancer cell lines. In ccRCC lines, enforced expression of EZH2Δ14 inhibited, and EZH2 promoted, cell growth, migration, proliferation, and tumorigenicity in a xenograft model. Mechanistic studies demonstrated that EZH2Δ14 isoform functions as a dominant-negative inhibitor of full-length EZH2. Coexpression of EZH2Δ14 variant with full-length EZH2 not only abrogated DAB2IP and HOXA9 suppression but also inhibited EZH2-driven tumorigenesis. Strikingly, the splicing factor SF3B3 stimulates inclusion of exon14 and has pro-proliferative activity. Importantly, the upregulation of SF3B3 expression observed in clinical ccRCC samples parallels the increased inclusion of EZH2 exon14, and the SF3B3 level is associated with higher tumor stage and poor overall survival.Conclusions: These results suggest SF3B3 as a key regulator of EZH2 pre-mRNA splicing and SF3B3 may represent a novel prognostic factor and potential therapeutic target in ccRCC. Clin Cancer Res; 23(13); 3428-41. ©2016 AACR.


Conflict of interest statement

Disclosure of Potential Conflicts of Interest

No potential conflicts of interest were disclosed

Figures

Fig. 1
Fig. 1. EZH2 exon 14 inclusion is upregulated in renal cancers
(A) Schematic representation of the EZH2 exon structure to highlight the alternative splicing between exons 13 and 15 generating EZH2-14+ (EZH2) and EZH2-14− (EZH2Δ14) variants. (B) Left: diagrams for detection of EZH2-14+ and EZH2-14− mRNA. Primer pairs and product sizes for the two variants are shown. Right: Expression of EZH2-14+ and EZH2-14− mRNA in one normal kidney proximal tubular epithelial cell line (HK2) and five cancer cell lines (OS-RC-2, ACHN, 786-O, SN12PM6, Caki-1) by RT PCR. Ratio for 14+/14− is listed below the panel. (C) Expression of EZH2-14+ and EZH2-14− mRNA in 24 paired renal cancer tissues and adjacent non-tumor tissues by RT-PCR. GAPDH transcript level was used as the load control. (D) Quantification of data from c for exon14 inclusion/exclusion ratio. ** indicates significant differences, P < 0.01.
Fig. 2
Fig. 2. EZH2Δ14 and full-length EZH2 have opposite roles in RCC development, and EZH2Δ14 lacks H3K27 methyltransferase activity
(A) Western blot analysis shows upregulation of DAB2IP (a known downstream gene of EZH2) and almost loss of histone H3K27 trimethylation in EZH2-knockout 786-O cell lines. Total histone H3 and GAPDH were shown as control. (B) Reintroduction of EZH2 into the KO cells can, but EZH2Δ14 can not, restore the histone H3K27 trimethylation and DAB2IP levels. Rescue experiments were carried out by transfecting EZH2-mut or EZH2Δ14-mut (sgRNA target sequence was partially substituted without affecting the amino acid residues) plasmids. (C) RT qPCR analysis of endogenous EZH2 target genes (HOXA9 and DAB2IP) in EZH2 WT and KO cells transduced with EZH2-mut and EZH2Δ14-mut. Expression was normalized to cells transduced with the control vector in wt cells. Data are plotted as the mean ± SD of 3 independent experiments. **indicates significant differences, P < 0.01. (D) The cell viability of ACHN and 786-O cells expressing Flag-EZH2 or Flag-EZH2Δ14 was determined by CCK8 assays at indicated time points. Data presented are means ± SD from three independent experiments. (E) Quantification of EdU incorporated-cells in indicated engineered cell lines. ** indicates significant differences, P < 0.01. (F) Relative colony formation units of Flag-EZH2- or Flag-EZH2Δ14-transfected stable ACHN and 786-O cells. (G) ACHN and 786-O cells expressing Flag-EZH2 or Flag-EZH2Δ14 were subjected to migration and invasion assay. a. Representative photographs were taken at ×200 magnification. b,c. The number of migrated and invaded cells was quantified in 4 random images from each group. ** indicates significant differences, P < 0.01. (H) a. Photographs of tumors excised 7 weeks after inoculation of stably transfected ACHN cells into nude mice. b. The tumor volume of Flag-EZH2-/Flag-EZH2Δ14-treated ACHN cells in nude mice at the end of 7 weeks after transplantation. c. Mean tumor volume measured by caliper on the indicated weeks. * P < 0.05. **indicates significant differences, P < 0.01.
Fig. 3
Fig. 3. EZH2Δ14 isoform acts as a dominant-negative inhibitor of full-length EZH2
(A) qPCR analysis of expression of PRC2 target genes HOXA9 and DAB2IP in ACHN cells transfected with psi-Flag (control), or Flag-EZH2 (0.4μg) and Flag-EZH2Δ14 (0, 0.2, or 0.6μg) plasmids. Means ± standard deviations for n = 3 are shown. **p < 0.01 vs. Ctrl. (B) EZH2Δ14 binds to EED and competes with the full-length EZH2. (C) EZH2Δ14 binds to SUZ12 and competes with the full-length EZH2. (D) Effects of EZH2Δ14 overexpression on the full-length EZH2 recruitment to the HOXA9 gene promoter in ACHN cells. At 24 h after transfection, cells were subjected to ChIP qPCR. **indicates significant differences, P < 0.01. (E) RNA immunoprecipitation (RIP) show that EZH2Δ14 and the full-length EZH2 can bind to the HOTAIR in ACHN cells. Transfected ACHN cells were harvested for western blots and RIP with anti-Flag. Retrieved HOTAIR ncRNA was analysed by RT qPCR. Means ± standard deviations for n = 3 are shown. ** P < 0.01 vs. Ctrl. (F) Effect of EZH2Δ14 overexpression on the binding of HOTAIR ncRNA to the full-length EZH2. **indicates significant differences, P < 0.01. (G) EZH2Δ14 inhibits HOTAIR-enhanced binding of EZH2 to the HOXA9 promoter. **indicates significant differences, P < 0.01. (H, I) EZH2Δ14 abrogates cell growth, migration and invasion induced by full-length EZH2. ACHN and 786-O cells were infected with different combinations of lentivirus as indicated. At 72 h after infection, CCK8 assays and transwell assays were performed to determine the cell growth (H), migration and invasion (I). * P < 0.05 vs. Ctrl. ** P < 0.01 vs. Ctrl.
Fig. 4
Fig. 4. SF3B3 regulates EZH2 alternative splicing and its expression correlates with levels of the full-length EZH2
(A) SF3B3 regulated EZH2 exon 14 inclusion is cell-type independently. EZH2 exon 14 splicing was measured by RT PCR in various cell lines (786-O, Caki-1, 293T) stably expressing sh-LacZ, sh-SFPQ, or sh-SF3B3. RT PCR was performed as described in Fig. 1B. (B) Schematic representation of splicing dual-reporter assay that mimics endogenous splicing by insertion of EZH2 genome fragment (from exon 13 to 15) harbors a point mutation in exon 14 to create stop codons. (C) The bar graph depicts the skipping of EZH2 exon 14 as measured by the firefly (F-Luc) to Renilla (R-Luc) luciferase ratio. 293T and ACHN cells were infected with lentivirus expressing sh-LacZ, sh-SFPQ, sh-SF3B3-1#, or sh-SF3B3-2#. After 3 d, these stable knockdown cell lines were transiently transfected with the splicing reporter. After transfection for 24 h, luciferase activities were measured. Data are mean ± s.d., n = 3 independent experiments, **P < 0.01. (D) SF3B3 is upregulated in renal clear cell carcinomas. Total RNA isolated from paired ccRCC tumors and adjacent normal tissues were assayed by real-time RT-PCR. * P < 0.05. (E) Positive correlation between EZH2-(14+)/EZH2 total mRNA ratio and expression levels of SF3B3 was observed in RCC samples. Relative mRNA levels of SF3B3 and the corresponding levels of EZH2 (ratio of EZH2-(14+)/EZH2 total mRNA) was plotted in each patient sample (P < 0.05, R2 = 0.4319).
Fig. 5
Fig. 5. SF3B3 is required for tumorigenesis of renal cancer cells
(A) Generation of SF3B3-knockdown ACHN and 786-O cells. ACHN and 786-O cells were infected with lentivirus with control sh-LacZ (Control) and sh-SF3B3s, respectively. Western blot analysis of the selected clones (sh-LacZ, sh-SF3B3-1#, and sh-SF3B3-2#) was performed to evaluate the expression of SF3B3. GAPDH is an internal control. * P < 0.05 vs. sh-LacZ. (B) The cell viability of ACHN and 786-O cells expressing sh-LacZ or sh-SF3B3 was determined by CCK8 assays at indicated time points. Data presented are means ± SD from three independent experiments. (C) Representative micrographs (a) and quantification (b,c) of EdU incorporated-cells in indicated engineered cell lines. ** P < 0.01 vs. sh-LacZ. (D) Relative colony formation units of sh-SF3B3- or sh-LacZ-transfected stable ACHN and 786-O cells. (E) ACHN and 786-O cells expressing sh-SF3B3 or sh-LacZ were subjected to migration and invasion assay. a. Representative photographs were taken at ×200 magnification. b,c. The number of migrated and invaded cells was quantified in 4 random images from each group. ** P < 0.01 vs. sh-LacZ. ## P < 0.01 vs. sh-LacZ. (F) ACHN cells expressing sh-SF3B3 or sh-LacZ were transplanted into mice. a. Representative images of the isolated tumors from injected mice. b. Tumor weight of each nude mouse at the end of 7 weeks. ** P < 0.01 vs. sh-LacZ. (G) a. Representative bioluminescent images of lungs of nude mice at the 30th days after IV. injection of renal cancer cell. b. Quantification analysis of fluorescence signal from captured bioluminescence images. ** P < 0.01 vs. sh-LacZ.
Fig. 6
Fig. 6. High expression of SF3B3 is associated with poor prognosis in patients with renal cancer
(A) Normal renal tissues and ccRCC samples were collected and subjected to immunohistochemical staining with a SF3B3 antibody. (B) Higher magnification images of the square regions in red line in A. Red triangles indicate the nucleus. Blue arrows indicate the cytoplasm. (C) Kaplan-Meier curve showing overall survival of kidney cancer patients with high or low SF3B3 expression (p = 0.0244 by log-rank test).

References

    1. Simon JA, Lange CA. Roles of the EZH2 histone methyltransferase in cancer epigenetics. Mutat Res. 2008;647:21–9. - PubMed
    1. Wagener N, Holland D, Bulkescher J, Crnkovic-Mertens I, Hoppe-Seyler K, Zentgraf H, et al. The enhancer of zeste homolog 2 gene contributes to cell proliferation and apoptosis resistance in renal cell carcinoma cells. Int J Cancer. 2008;123:1545–1550. - PubMed
    1. Wagener N, Macher-Goeppinger S, Pritsch M, Husing J, Hoppe-Seyler K, Schirmacher P, et al. Enhancer of zeste homolog 2 (EZH2) expression is an independent prognostic factor in renal cell carcinoma. BMC cancer. 2010;10:524. - PMC - PubMed
    1. Xu B, Abourbih S, Sircar K, Kassouf W, Mansure JJ, Aprikian A, et al. Enhancer of zeste homolog 2 expression is associated with metastasis and adverse clinical outcome in clear cell renal cell carcinoma: a comparative study and review of the literature. Arch Pathol Lab Med. 2013;137:1326–1336. - PubMed
    1. Hinz S, Weikert S, Magheli A, Hoffmann M, Engers R, Miller K, et al. Expression profile of the polycomb group protein enhancer of Zeste homologue 2 and its prognostic relevance in renal cell carcinoma. J Urol. 2009;182:2920–2925. - PubMed

Publication types