. 2017 Jan;173(1):703-714.
doi: 10.1104/pp.16.01626. Epub 2016 Nov 22.

Natural Variation of Molecular and Morphological Gibberellin Responses

Affiliations

Natural Variation of Molecular and Morphological Gibberellin Responses

Youn-Jeong Nam et al. Plant Physiol. 2017 Jan.

Abstract

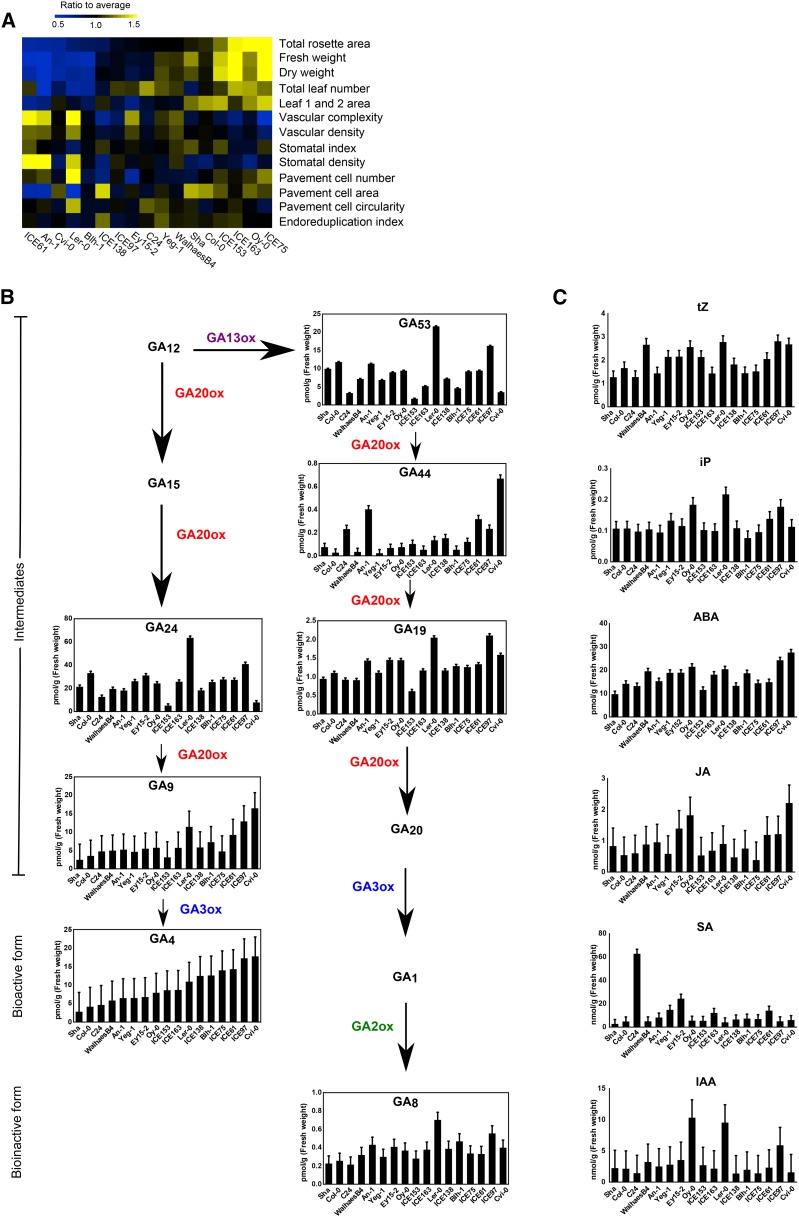
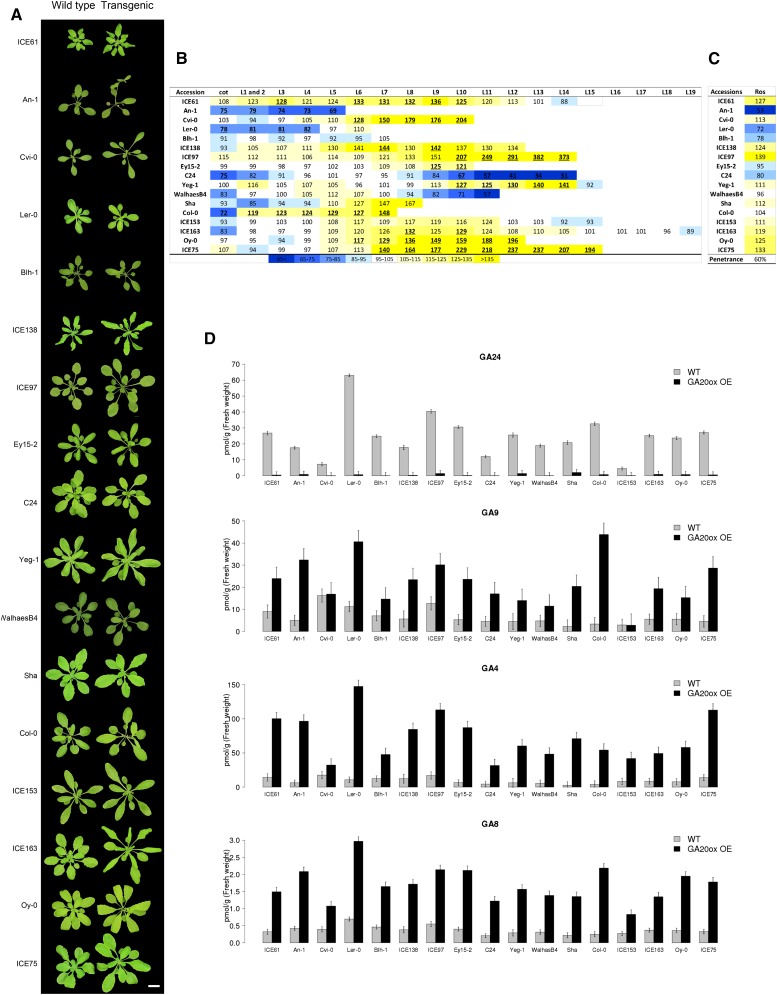
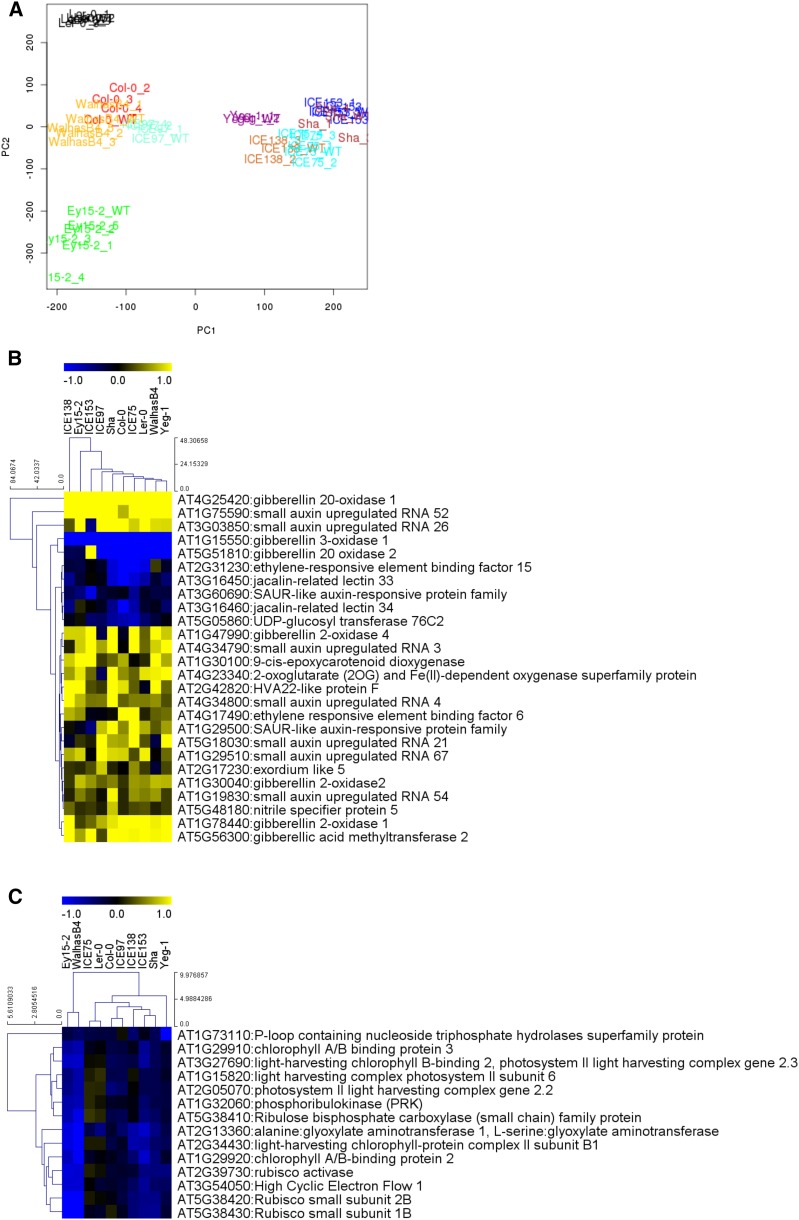
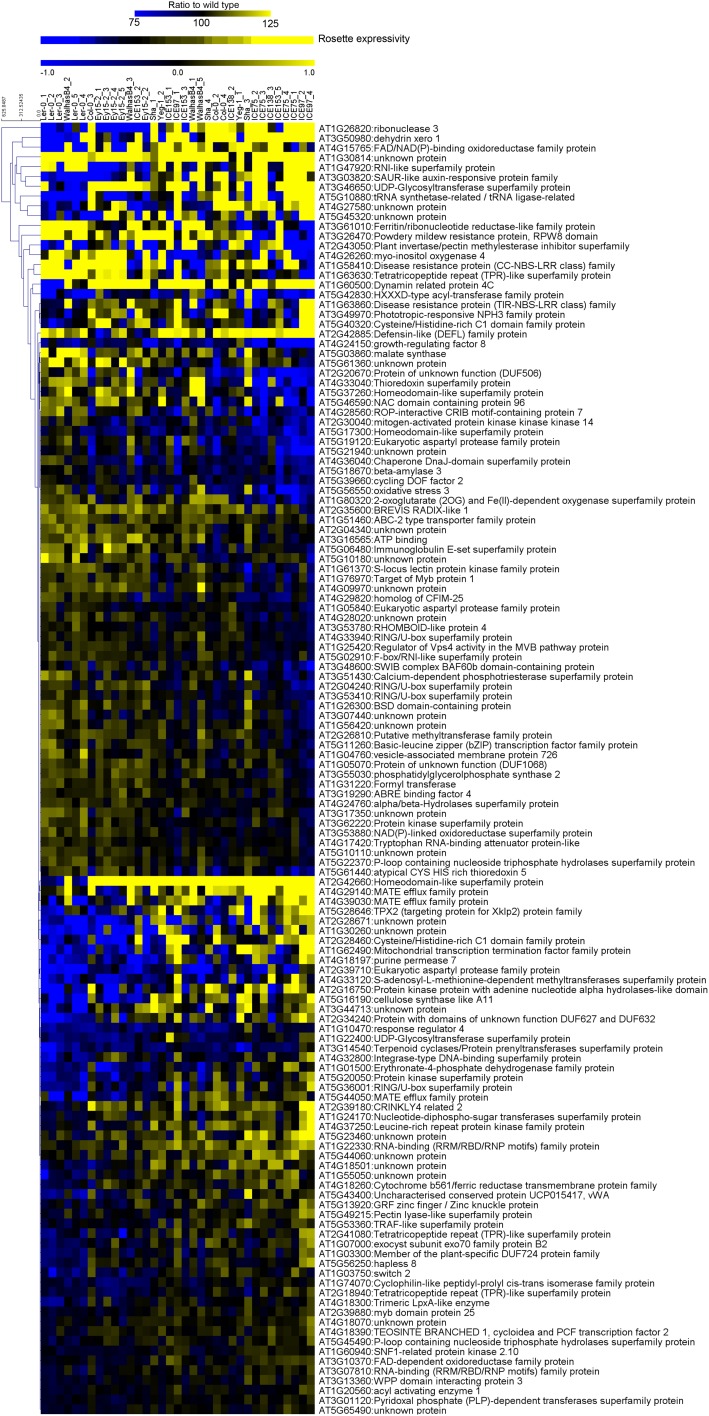
Although phytohormones such as gibberellins are essential for many conserved aspects of plant physiology and development, plants vary greatly in their responses to these regulatory compounds. Here, we use genetic perturbation of endogenous gibberellin levels to probe the extent of intraspecific variation in gibberellin responses in natural accessions of Arabidopsis (Arabidopsis thaliana). We find that these accessions vary greatly in their ability to buffer the effects of overexpression of GA20ox1, encoding a rate-limiting enzyme for gibberellin biosynthesis, with substantial differences in bioactive gibberellin concentrations as well as transcriptomes and growth trajectories. These findings demonstrate a surprising level of flexibility in the wiring of regulatory networks underlying hormone metabolism and signaling.


Figures

Figure 1.
Figure 1.
Variability in leaf size-related parameters and hormone content in 17 Arabidopsis accessions. A, Heat map representing the distance to the average of 17 accessions for 13 leaf size-related parameters (n = 3). Accessions are arranged based on the value of the rosette area. The measurements and calculations can be found in Supplemental Table S2. B, Basal GA levels in 17 accessions. GA biosynthesis (GA20ox and GA3ox) and catabolic (GA2ox) enzymes are indicated with different colors. GA20 and GA1 were not detected. C, Basal levels of cytokinins (tZ and iP), ABA, JA, SA, and IAA in the 17 accessions (n = 3). Error bars represent se.
Figure 2.
Figure 2.
Phenotype of GA20ox1 overexpressing (OE) lines of 17 Arabidopsis accessions. A, Image of 25-d-old rosettes of representative GA20ox1 OE lines and their corresponding wild type. Bar = 2 cm. B, Heat map representing, per accession, the average predicted percent difference in each leaf area between GA20ox1 OE lines and their corresponding wild type. Bold with underline: P value < 0.05. C, Heat map showing the estimated expressivity and penetrance (Sel, selective; Ros, rosette; see “Materials and Methods”) of GA20ox1 OE. D, GA levels in GA20ox1 OE lines. The normalized values represent the average concentrations between all transgenics for one accession and are represented with se bars (n = 3).
Figure 3.
Figure 3.
PCA of transcriptomics data and heat maps representing the fold change of differentially expressed genes in GA20ox1 OE lines. A, PCA plot representing classifications of transcriptomics data of wild-type and GA20ox1 OE lines. Each accession is displayed in a different color. W, wild type; 1-5, independent transgenic lines. B and C, Differentially expressed genes involved in hormone metabolism (B) and photosynthesis (C). Yellow and blue colors represent increased and decreased expression, respectively, in comparison with the wild types. Only DE genes that show at least 1.5-fold change difference are shown. Hierarchical clustering was done for both genes and samples with Manhattan distance metrics.
Figure 4.
Figure 4.
Correlation analysis between phenotypic and transcriptomic data. Heat maps represent the DE genes correlated with rosette expressivity and the expressivity of the rosette leaves. Yellow and blue correspond to increased and decreased expression, respectively, in comparison with the wild type. The DE genes with at least 1.5-fold change are indicated with an asterisk. Hierarchical clustering was done for genes with Manhattan distance metrics. Samples were ordered in function of the expressivity (correlation coefficient > |0.5|, adj-P value < 0.05).

References

    1. Anders S, Pyl PT, Huber W (2015) HTSeq--a Python framework to work with high-throughput sequencing data. Bioinformatics 31: 166–169 - PMC - PubMed
    1. Andriankaja M, Dhondt S, De Bodt S, Vanhaeren H, Coppens F, De Milde L, Mühlenbock P, Skirycz A, Gonzalez N, Beemster GTS, Inzé D (2012) Exit from proliferation during leaf development in Arabidopsis thaliana: a not-so-gradual process. Dev Cell 22: 64–78 - PubMed
    1. Boyes DC, Zayed AM, Ascenzi R, McCaskill AJ, Hoffman NE, Davis KR, Görlach J (2001) Growth stage-based phenotypic analysis of Arabidopsis: a model for high throughput functional genomics in plants. Plant Cell 13: 1499–1510 - PMC - PubMed
    1. Chandler CH, Chari S, Dworkin I (2013) Does your gene need a background check? How genetic background impacts the analysis of mutations, genes, and evolution. Trends Genet 29: 358–366 - PMC - PubMed
    1. Chari S, Dworkin I (2013) The conditional nature of genetic interactions: the consequences of wild-type backgrounds on mutational interactions in a genome-wide modifier screen. PLoS Genet 9: e1003661. - PMC - PubMed

Publication types

MeSH terms