Review
. 2008 Jan 6;8(2):711-738.
doi: 10.3390/s8020711.

Evanescent field Sensors Based on Tantalum Pentoxide Waveguides - A Review

Affiliations
Review

Evanescent field Sensors Based on Tantalum Pentoxide Waveguides - A Review

Katrin Schmitt et al. Sensors (Basel). .

Abstract

Evanescent field sensors based on waveguide surfaces play an important rolewhere high sensitivity is required. Particularly tantalum pentoxide (Ta₂O₅) is a suitablematerial for thin-film waveguides due to its high refractive index and low attenuation.Many label-free biosensor systems such as grating couplers and interferometric sensors aswell as fluorescence-based systems benefit from this waveguide material leading toextremely high sensitivity. Some biosensor systems based on Ta₂O₅ waveguides alreadytook the step into commercialization. This report reviews the various detection systems interms of limit of detection, the applications, and the suitable surface chemistry.

Keywords: Ta2O5.; biosensors; evanescent field; label-free detection.


Figures

Figure 1.
Figure 1.
Refractive index n and extinction coefficient k of a thin Ta2O5 layer on glass (n = 1.52) versus wavelength (light source: Xe arc lamp with corresponding interference filters); measurements performed at an angle of incidence of 50° by means of spectroscopic ellipsometry (EP3, Nanofilm Technologie GmbH, Göttingen, Germany).
Figure 2.
Figure 2.
Three-layer planar waveguide system comprising substrate, waveguide and cover layer, with refractive indices ns, nw, and nc, respectively.
Figure 3.
Figure 3.
The principle of evanescent field sensing. A waveguide layer on a substrate is guiding a light mode with phase velocity v1. A change in the effective refractive index and thus a decrease in the phase velocity v2 < v1 is caused by either a change in the cover refractive index Δnc or a change in the adlayer thickness Δtad due to molecule adsorption, e.g. binding of an antigen to a capture antibody. From [21].
Figure 4.
Figure 4.
Theoretical sensitivities of a waveguide to a) cover refractive index changes and b) surface adlayer changes versus waveguide thickness. Parameters for calculation: ns = 1.52, nw = 2.1, nc = 1.333 and λ = 675 nm. From [21].
Figure 5.
Figure 5.
(a) Schematic of the input grating coupler instrument. In an angular scan, the TE0 and TM0 modes are successively excited by an s- and a p-polarized laser beam. L = lever arm; MS = micrometer screw; SM = stepping motor; Cu = cuvette; Laser = He-Ne laser (λ = 632.8 nm); FP = Foster prism; M1 and M2 = mirrors; P = incident power; P′ = power of incoupled guided mode; α = angle of incidence; D1 and D2 = silicon photodetectors. (b) Detailed view of the sensor: C = liquid cover; F = waveguiding film of thickness dF on glass substrate S. From [34], Copyright Elsevier (1990).
Figure 6.
Figure 6.
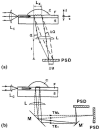
(a) Schematic of output grating coupler sensor; F = waveguide; S = substrate; C = sample; Lc = cylindrical lens of short focal length fc (e.g. fc = 5 mm); L = cylindrical lens of focal length f (e.g. f = 300 mm); α = outcoupling angle; Δα = change in outcoupling angle proportional to the effective index change Δn; PSD = position-sensitive-detector; Δu = displacement of centre of the light spot on the PSD. (b) Schematics of output grating coupler measuring the effective index changes Δn(TE0) and Δn(TM0) of the TE0 and TM0 modes; M, M′ = mirrors. From [39], Copyright Elsevier (1990).
Figure 7.
Figure 7.
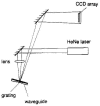
Optical arrangement for reflected-mode operation of integrated optical grating coupler. From [41], Copyright Elsevier (1996).
Figure 8.
Figure 8.
Schematic of wavelength interrogated optical sensor WIOS. From [46], Copyright Elsevier (2003).
Figure 9.
Figure 9.
(a) Cut through dual period sensor chip. (b) Cut through thickness-modulated sensor chip. From [46], Copyright Elsevier (2003).
Figure 10.
Figure 10.
Young interferometer as described in [21]. Light from a light source is coupled into the waveguide sensor chip by a grating after being split in two beams by a double slit. The two beams are guided separately down the waveguide, forming sensing and reference path, and coupled out by a second grating. The interference pattern is recorded behind another double slit by a CCD line sensor.
Figure 11.
Figure 11.
left: Schematic optical set-up used for first model-assays for volume detection’, interference filters were used for selection of the excitation or emission light and photodiodes or photomultiplier for signal detection; right: comparison of set-ups for volume detection and detection of backcoupled and guided luminescence light, using a second outcoupling grating where different wavelength can be discriminated by the outcoupling angle. From [31], Copyright Elsevier (1997).
Figure 12.
Figure 12.
Detection principle of evanescent field fluorescence on planar waveguides (principle of ZeptoREADER): excitation light is coupled into a thin-film waveguide; surface confined fluorescence of bound labeled molecules is detected by a CCD camera. Adapted from [2, 19]
Figure 13.
Figure 13.
Schematic of the Waveguide Excitation Fluorescence Microscope (WExFM); photograph of the system on a standard inverted microscope. From [10], Copyright Elsevier (2005).
Figure 14.
Figure 14.
Bidentate und monodentate phosphate coordination to tantalum ions. Adapted from [61].

Similar articles

Cited by

References

    1. Ehrat M., Kresbach G.M. DNA and protein microarrays and their contributions to proteomics and genomics. Chimia. 2001;55:35–39.
    1. Pawlak M., Schick E., Bopp M.A., Schneider M.J., Oroszlan P., Ehrat M. Zeptosens' protein microarrays: A novel high performance microarray platform for low abundance protein analysis. Proteomics. 2002;2:383–393. - PubMed
    1. Miklos G.L., Maleszka R. Protein functions and biological contexts. Proteomics. 2001;1:169–178. - PubMed
    1. Weissenstein U., Schneider M.J., Pawlak M., Cicenas J., Eppenberger-Castori S., Oroszlan P., Ehret S., Geurts-Moespot A., Sweep F.C.G.J., Eppenberger U. Protein chip based miniaturized assay for simultaneous quantitative monitoring of cancer biomarkers in tissue extracts. Proteomics. 2006;6:1427–1436. - PubMed
    1. Templin M.F., Stoll D., Pawlak M., Joos T.O. Protein Microarrays: Neue Systeme für die Proteomforschung. GIT Labor-Fachzeitschrift. 2006;50:890–892.

LinkOut - more resources