Review
. 2008 Feb 22;8(2):1157-1173.
doi: 10.3390/s8021157.

Imaging In Mice With Fluorescent Proteins: From Macro To Subcellular

Affiliations
Review

Imaging In Mice With Fluorescent Proteins: From Macro To Subcellular

Robert M Hoffman. Sensors (Basel). .

Abstract

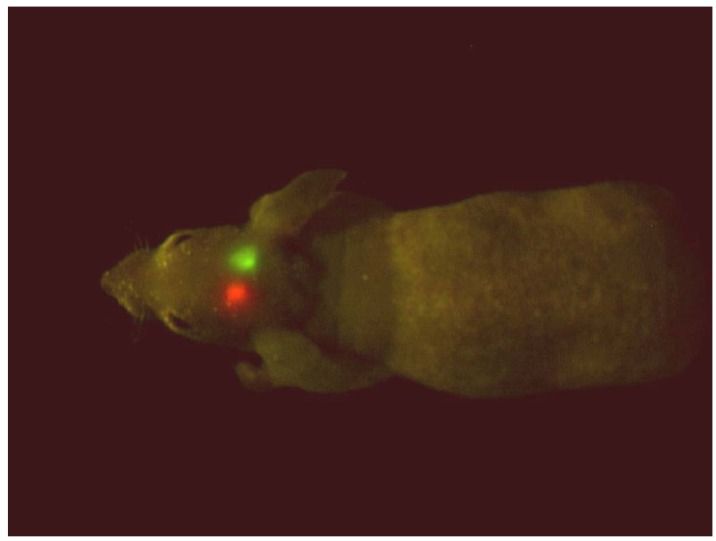
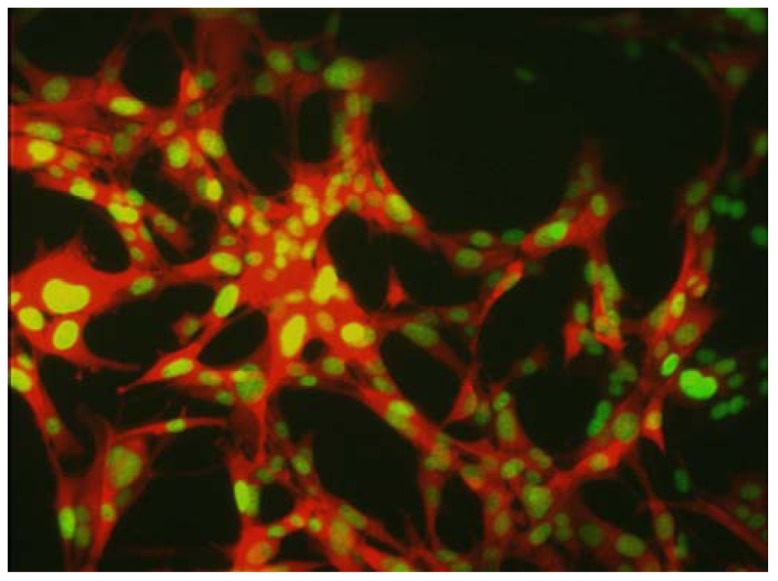
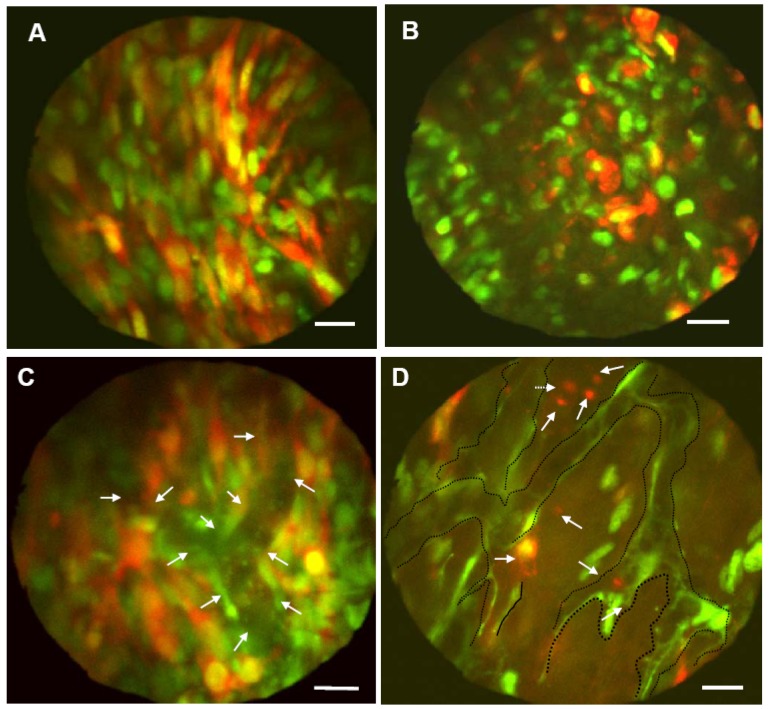
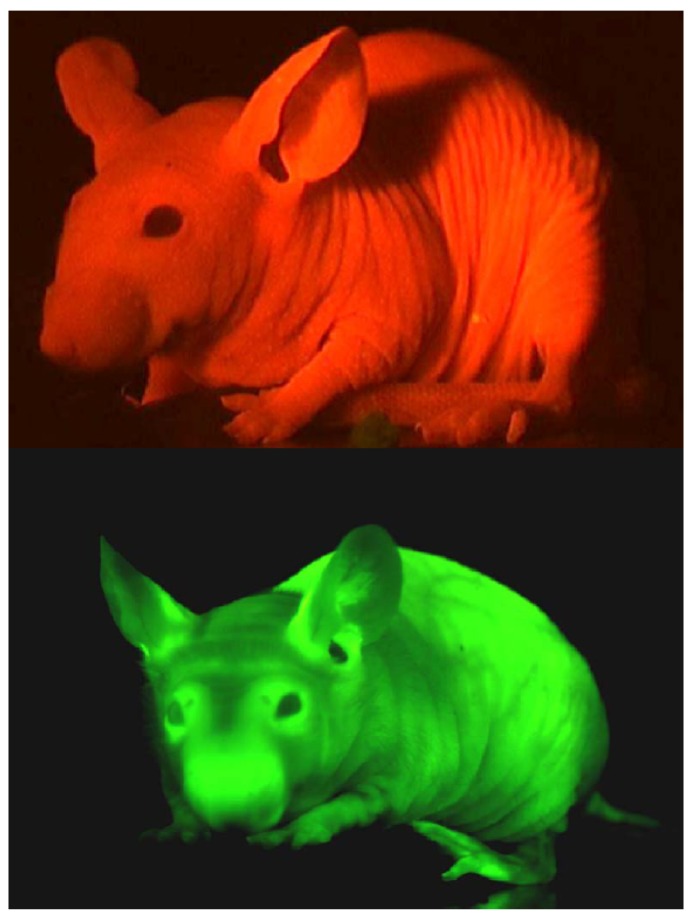
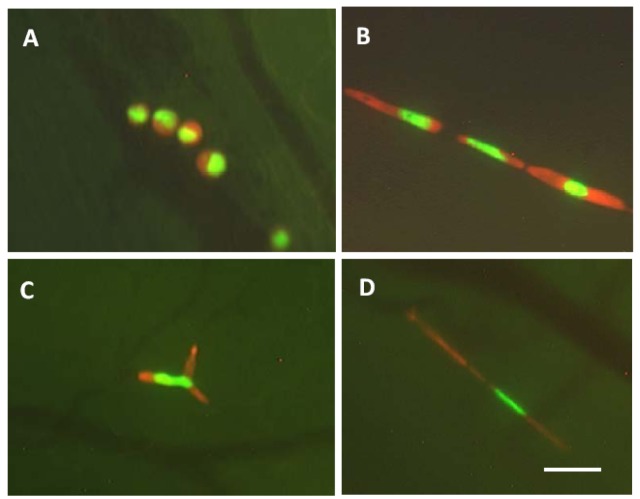
Whole-body imaging with fluorescent proteins has been shown to be a powerfultechnology with many applications in small animals. Brighter, red-shifted proteins can makewhole-body imaging even more sensitive due to reduced absorption by tissues and less scatter.For example, a new protein called Katushka has been isolated that is the brightest known proteinwith emission at wavelengths longer than 620 nm. This new protein offers potential for non-invasive whole-body macro imaging such as of tumor growth. For subcellular imaging, toobserve cytoplasmic and nuclear dynamics in the living mouse, cancer cells were labeled in thenucleus with green fluorescent protein and with red fluorescent protein in the cytoplasm. Thenuclear and cytoplasmic behavior of cancer cells in real time in blood vessels was imaged as theytrafficked by various means or adhered to the vessel surface in the abdominal skin flap. Duringextravasation, real-time dual-color imaging showed that cytoplasmic processes of the cancer cellsexited the vessels first, with nuclei following along the cytoplasmic projections. Both cytoplasmand nuclei underwent deformation during extravasation. Cancer cells trafficking in lymphaticvessels was also imaged. To noninvasively image cancer cell/stromal cell interaction in the tumormicroenvironment as well as drug response at the cellular level in live animals in real time, wedeveloped a new imageable three-color animal model. The model consists of GFP-expressingmice transplanted with the dual-color cancer cells. With the dual-color cancer cells and a highlysensitive small animal imaging system, subcellular dynamics can now be observed in live mice inreal time. Fluorescent proteins thus enable both macro and micro imaging technology and thereby provide the basis for the new field of in vivo cell biology.

Keywords: cancer cells; cellular dynamics; green fluorescent protein; in vivo cellular imaging; mice; red fluorescent protein; whole-body imaging.


Figures

Figure 1.
Figure 1.. External vs. internal quantitative imaging
A, External and B, open images of a single, representative, control mouse at autopsy on day 17 after surgical orthotopic implantation (SOI). Extensive locoregional and metastatic growth is visualized by selectively exciting DsRed2-expressed in the tumors. A strong correlation between the fluorescence visualized externally and that obtained after laparotomy is evident, despite the presence of intra-abdominal ascites. C, Red fluorescent area quantified using external fluorescence imaging correlated strongly with tumor volume measured directly. At autopsy, measurement of externally visualized fluorescent area and direct measurements of the primary tumor of each mouse were obtained. Significant correlation (r 0.89, P 0.05) was observed between these values [6].
Figure 2.
Figure 2.. Whole-body imaging of green fluorescent protein (GFP) and red fluorescent protein (RFP) tumors in the brain in a nude mouse
GFP- and RFP-expressing brain tumors implanted in the brain in a single nude mouse. The excitation light was produced with a simple blue-LED flashlight equipped with an excitation filter with a central peak of 470 nm. The image was acquired with a Hamamatsu charge-coupled device (CCD) camera [4].
Figure 3.
Figure 3.. Stable high GFP- and RFP-expressing dual-color cancer cells in vitro
Mouse mammary tumor (MMT) cells were initially transduced with RFP and the neomycin resistance gene. The cells were subsequently transduced with histone H2B-GFP and the hygromycin resistance gene. Double transformants were selected with G418 and hygromycin, and stable clones were established. Bar = 50 μm [31].
Figure 4.
Figure 4.. Whole-body, noninvasive, subcellular imaging of drug response of dual-color mouse mammary cancer cells and GFP stromal cells
MMT-GFP-RFP cells were injected in the footpad of GFP transgenic nude mice. A, Whole-body image of untreated MMT-GFP-RFP cells in the footpad of a live GFP mouse. Note the numerous spindle-shaped MMT-GFP-RFP cancer cells interdispersed among the GFP host cells. B, Whole-body image of MMT-GFP-RFP cancer cells in a live GFP nude mouse 12 h after treatment with doxorubicin (10 mg/kg). The cancer cells lost their spindle shape, and the nuclei appear contracted. C, Whole-body image of MMT-GFP-RFP tumor. Numerous spindle-shaped MMT-GFP-RFP cells interacted with GFP-expressing host cells. Well-developed tumor blood vessels and real-time blood flow were visualized by whole-body imaging (arrows). D, In vivo drug response of MMT-GFP-RFP cancer cells and GFP stromal cells 12 h after i.v. injection of 10 mg/kg doxorubicin. All of the visible MMT-GFP-RFP cells lost their spindle shape. Many of the cancer cells fragmented (arrows). Tumor blood vessels were damaged (dashed black lines), and the number of cancer cells was dramatically reduced 12 h after chemotherapy. Bar = 20 μm [10].
Figure 5.
Figure 5.. Transgenic RFP and GFP nude mice
Transgenic mice ubiquitously-expressing GFP [33] or RFP [34] were originally developed. These mice were crossed on to the nude background [35].
Figure 6.
Figure 6.. Imaging nuclear and cytoplasmic deformation of cancer cells in the vessels in the skin
A, Nondeformed cells are within a microvessel. The cells in the microvessel are round and the nuclei oval. The cells occupy the full diameter of the vessel. B, The cells and nuclei are elongated to fit a capillary. C, The cells are arrested at the capillary bifurcation. Because of the difference of the deformability between cytoplasm and nucleus, only the cytoplasm is bifurcated. The nucleus is also deformed but remains intact. D, Cytoplasmic fragmentation in very thin capillary. Bar = 50 μm [27].
Figure 7.
Figure 7.. Imaging nuclear-cytoplasmic dynamics of intravascular trafficking of cancer cells
A, Schematic diagram of the skin flap model in live mice for imaging intravascular trafficking and extravasation. An arc-shaped incision was made in the abdominal skin, and then the skin flap was spread and fixed on a flat stand. HT-1080-GFP-RFP cells were injected into the epigastric cranialis vein through a catheter. Immediately after injection, the inside surface of the skin flap was directly observed. B, HT-1080-GFP-RFP cell crawls smoothly along the vessel wall without rolling in a capillary (arrow). The nucleus and cytoplasm are slightly stretched. The nucleus is in the front of the cell while the cell is crawling. When the cell advanced into a part of the capillary where the diameter is smaller than of deformation limit of the cell, the cell could not advance any further. Bar = 100 μm. C, HT-1080-GFP-RFP cell, trafficking at low velocity, advanced between other cells and the vessel wall. The moving cancer cell contacted the other cells (arrow). The cell deformed slightly and continued to move without adhesion. Bar = 100 μm. Right, schematics of (B) and (C). D, One cancer cell migrating in the post capillary with slow velocity. The cytoplasm is at the head of the cell while the cell is moving in a large vein, but the nucleus is at the head in a small vein. The velocity of the cells in (A) and (B) is an average of 24.2 μm/s. The average velocity in cells in (D) and (E), however, is only 6.1 μm/s because the cells are in a narrower vein. Images were taken every 3.30 seconds. Bar = 50 μm. E, Multicellular aggregate collided with another aggregate that was already attached to the vessel wall. The two aggregates attached and formed a larger aggregation. Some cells (arrow) escaped from the aggregate because of weak adhesion and recommenced movement. Images were taken every 1.04 seconds. Bar = 100 μm. Images were acquired in real time with the Olympus OV100. Right, schematics of (B) and (C) [21].
Figure 8.
Figure 8.. Time-lapse imaging of nuclear-cytoplasmic dynamics of extravasation of cancer cells
A, 12 hours after injection dual color MMT cells, the skin flap was opened and fixed on a flat stand. Images were acquired every hour for 24 hours with the skin flap open. Two dual color MMT cancer cells are visualized in the process of extravasation 24 hours after injection (arrows). The cancer cells extended fine cytoplasmic projections into the host tissue at the onset of extravasation. One of the cells extended two fine cytoplasmic projections into the host tissue (arrowhead). The nuclei then migrated along the cytoplasmic projection until the whole cell came out of the vessel. Subsequently, the whole cell extravasated. Bar = 20 μm. B, 48 and 72 hours after injection. Cytoplasmic processes were extended along the vessel wall 48 hours after injection (arrows). Cells extravasated in the same direction of the cytoplasmic projections (broken arrows). Images were acquired every 24 hours by opening and closing the skin flap. Bar = 50 μm. C, Invasion and proliferation of MMT cells around a vessel after extravasation. Bar = 50 μm. Images were acquired with the Olympus OV100. Right, schematics of (A), (B), and (C) [21].
Figure 9.
Figure 9.. Imaging tumor-cell shedding in lymphatic vessels
A footpad tumor, formed after injection of HT1080-GFP-RFP cells, was stimulated by 25- or 250-g weight for 10 s each to increase the internal pressure of the tumor. Stimulations were conducted on the same mouse with a minimum 5-min interval. A cylindrical weight with a 10-mm diameter was used for the stimulation. After stimulation, video rate imaging visualized cancer cell trafficking in the lymphatic vessel with the Olympus OV100 system at x100 magnification for 1 min. The numbers of cell fragments, single cells, and emboli shed into the lymphatic vessel were counted by reviewing the saved movie files. The major axis of the maximum-size shed embolus in each experiment was also measured. A, No weight stimulation onto the footpad. There are only a few fragmented cells in the lymph duct. B, After a 10-s stimulation with a 25-g weight on the footpad, single cells as well as cell fragments are observed trafficking in the lymph duct. C and D, After a 10-s stimulation with the 250-g weight on the footpad, more cell emboli, single cells, and fragments were shed in the lymph duct. Dual-color cell was useful to distinguish the cell condition. D, A high magnification image of the embolus is also shown. Bar 200 μm [36].

References

    1. Hoffman R.M. The multiple uses of fluorescent proteins to visualize cancer in vivo. Nat. Rev. Cancer. 2005;5:796–806. - PubMed
    1. Chishima T., Miyagi Y., Wang X., Yamaoka H., Shimada H., Moossa A.R., Hoffman R.M. Cancer invasion and micrometastasis visualized in live tissue by green fluorescent protein expression. Cancer Res. 1997;57:2042–2047. - PubMed
    1. Yang M., Baranov E., Jiang P., Sun F-X., Li X-M., Li L., Hasegawa S., Bouvet M., Al-Tuwaijri M., Chishima T., Shimada H., Moossa A.R., Penman S., Hoffman R.M. Whole-body optical imaging of green fluorescent protein-expressing tumors and metastases. Proc. Natl. Acad. Sci. USA. 2000;97:1206–1211. - PMC - PubMed
    1. Yang M., Luiken G., Baranov E., Hoffman R.M. Facile whole-body imaging of internal fluorescent tumors in mice with an LED flashlight. BioTechniques. 2005;39:170–172. - PubMed
    1. Matz M.V., Fradkov A.F., Labas Y.A., Savitsky A.P., Zaraisky A.G., Markelov M.L., Lukyanov S.A. Fluorescent proteins from nonbioluminescent Anthozoa species. Nat. Biotechnol. 1999;17:969–973. - PubMed

LinkOut - more resources