. 2008 Mar 25;8(3):2017-2042.
doi: 10.3390/s8032017.

Monitoring the Effects of Forest Restoration Treatments on Post-Fire Vegetation Recovery with MODIS Multitemporal Data

Affiliations

Monitoring the Effects of Forest Restoration Treatments on Post-Fire Vegetation Recovery with MODIS Multitemporal Data

Willem J D Van Leeuwen. Sensors (Basel). .

Abstract

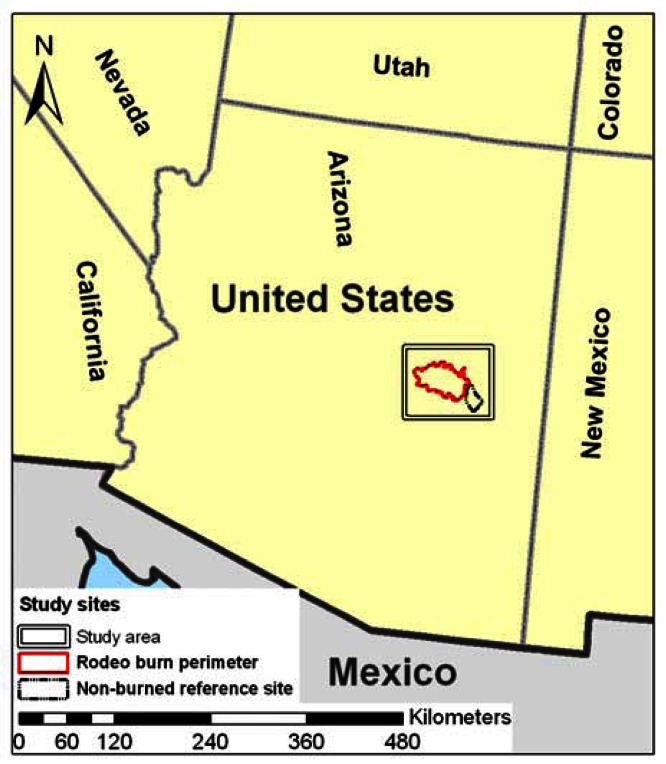
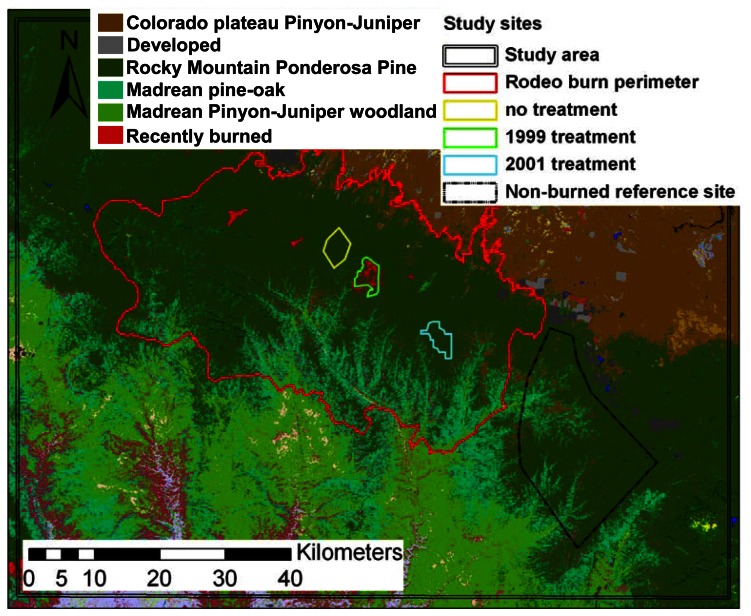
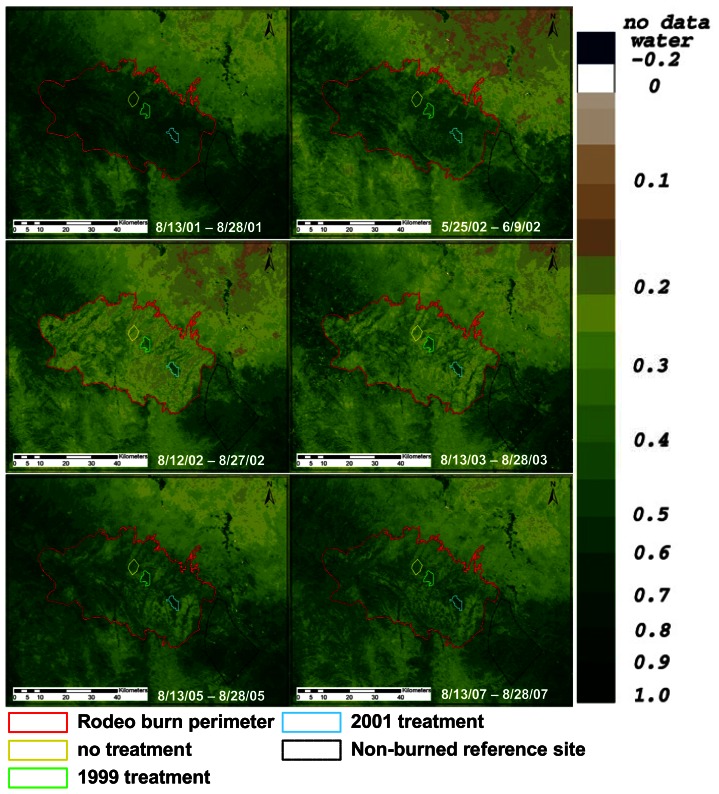
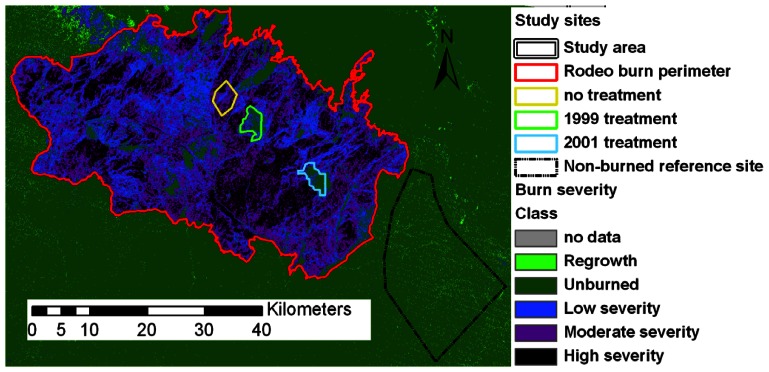
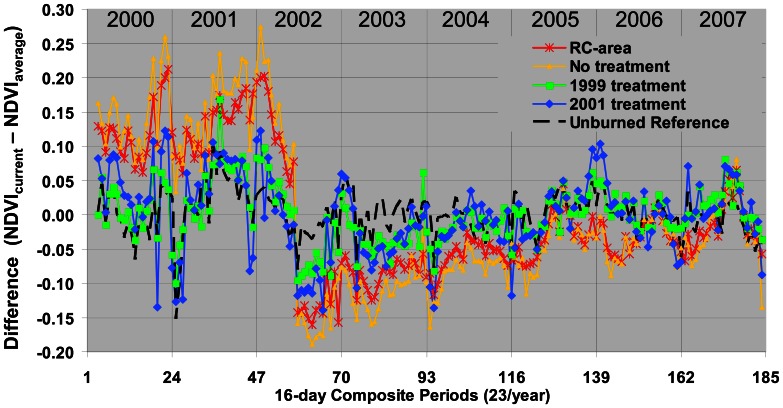
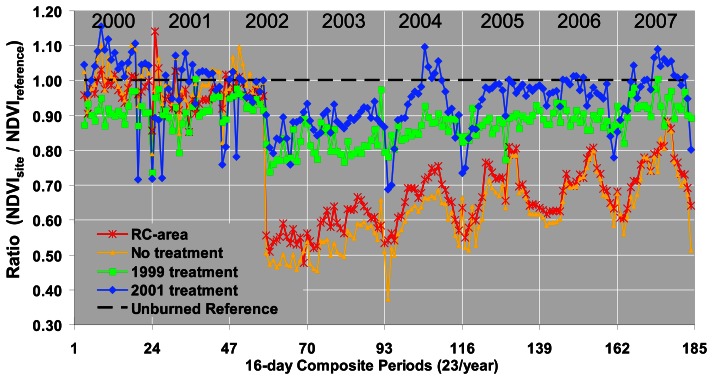
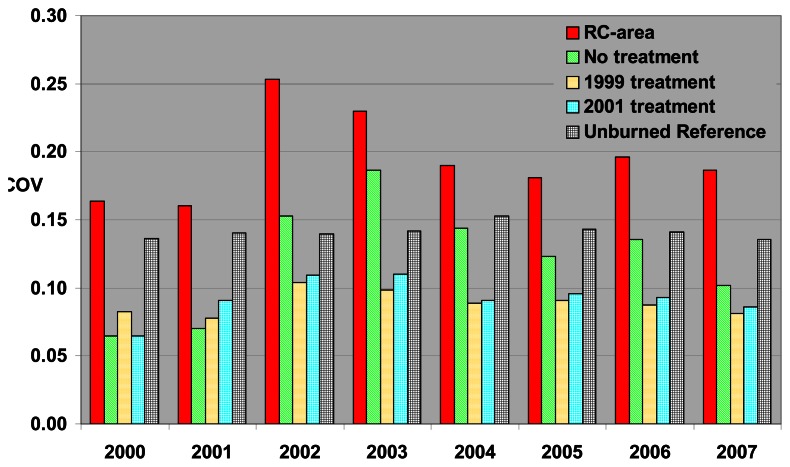
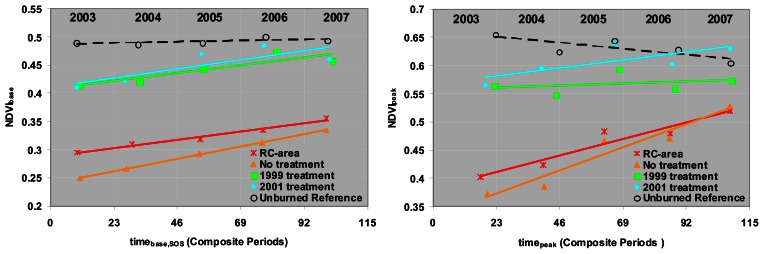
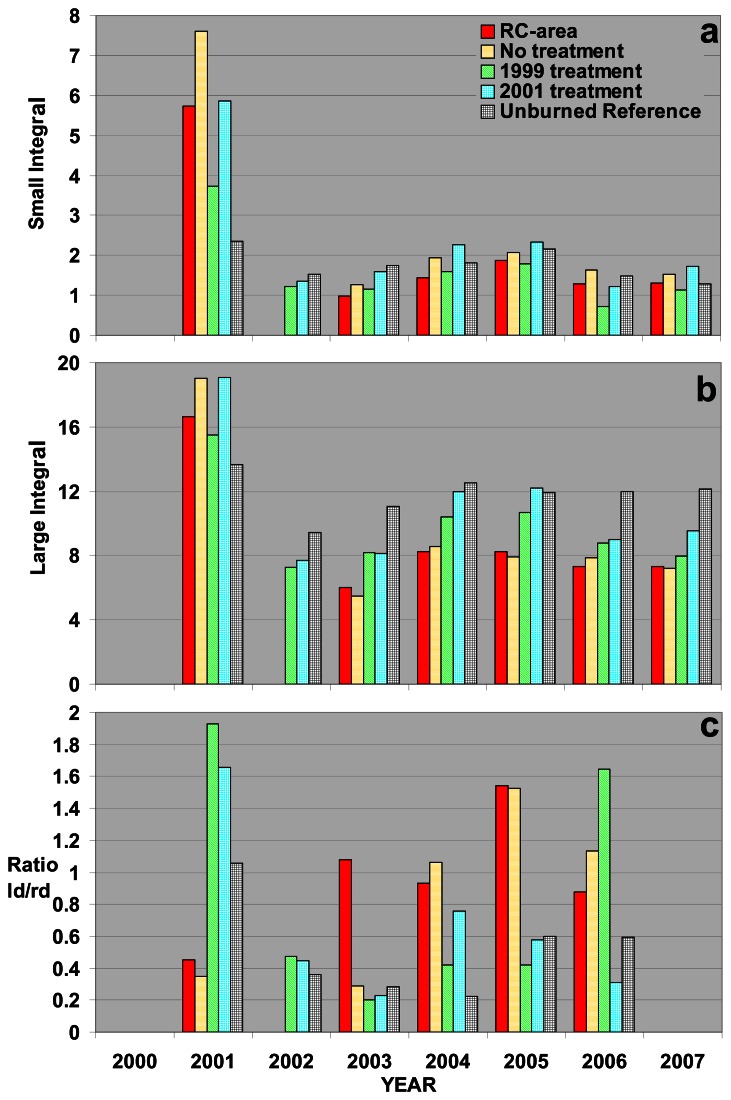
This study examines how satellite based time-series vegetation greenness data and phenological measurements can be used to monitor and quantify vegetation recovery after wildfire disturbances and examine how pre-fire fuel reduction restoration treatments impact fire severity and impact vegetation recovery trajectories. Pairs of wildfire affected sites and a nearby unburned reference site were chosen to measure the post-disturbance recovery in relation to climate variation. All site pairs were chosen in forested uplands in Arizona and were restricted to the area of the Rodeo-Chediski fire that occurred in 2002. Fuel reduction treatments were performed in 1999 and 2001. The inter-annual and seasonal vegetation dynamics before, during, and after wildfire events can be monitored using a time series of biweekly composited MODIS NDVI (Moderate Resolution Imaging Spectroradiometer - Normalized Difference Vegetation Index) data. Time series analysis methods included difference metrics, smoothing filters, and fitting functions that were applied to extract seasonal and inter-annual change and phenological metrics from the NDVI time series data from 2000 to 2007. Pre- and post-fire Landsat data were used to compute the Normalized Burn Ratio (NBR) and examine burn severity at the selected sites. The phenological metrics (pheno-metrics) included the timing and greenness (i.e. NDVI) for the start, peak and end of the growing season as well as proxy measures for the rate of green-up and senescence and the annual vegetation productivity. Pre-fire fuel reduction treatments resulted in lower fire severity, which reduced annual productivity much less than untreated areas within the Rodeo-Chediski fire perimeter. The seasonal metrics were shown to be useful for estimating the rate of post-fire disturbance recovery and the timing of phenological greenness phases. The use of satellite time series NDVI data and derived pheno-metrics show potential for tracking vegetation cover dynamics and successional changes in response to drought, wildfire disturbances, and forest restoration treatments in fire-suppressed forests.

Keywords: LANDSAT.; MODIS; fire severity; fuel reduction treatments; phenology; vegetation recovery.


Figures

Figure 1.
Figure 1.
General location of the study area in Arizona and the position of the Rodeo-Chediski burn perimeter
Figure 2.
Figure 2.
Annual mean cumulative spring (Jan.-June) and monsoon (July-Dec.) precipitation data showing the drop in precipitation in 2002.
Figure 3.
Figure 3.
Study sites and land cover classification map based on SWReGAP [35].The study sites are dominated by Ponderosa pine and some Madrean pine oak.
Figure 4.
Figure 4.
MODIS NDVI time series imagery for the selected study sites are shown for August (2001) and June (2002) before the Rodeo-Chediski fire showing relatively high NDVI values for the study sites. Low NDVI values are observed for the August (2002) right after the fire, with the NDVI gradually increasing in the August images for 2003, 2005 and 2007.
Figure 5.
Figure 5.
An example of the phenological metrics that are retrieved based on time series (blue curve) of 16-day composites of MODIS NDVI data for Ponderosa pine land cover and TIMESAT software [33]. The brown line is the fitted curve with the brown circles indicating the start and end of the growing seasons.
Figure 6.
Figure 6.
Pre- and post-fire RGB (ETM bands 7, 4, and 3) color composites for June 5, 2002 and July 7, 2002, respectively. The Rodeo-Chediski fire was on June 18, 2002. The selected sites and fire perimeter are indicated as well. Some clouds and their shadows are visible in the Northeast side of the burn perimeter in the post-fire scene.
Figure 7.
Figure 7.
Examples of the effect of low severity (left) and high severity (right) fires on sites inside Apache-Sitgreaves National Forest. Fuel reduction treatments (thinning) were applied at the site displayed in the picture to the left. Pictures taken in May, 2004.
Figure 8.
Figure 8.
Locations of the 1999 and 2001 prescribed fire treatments on Apache-Sitgreaves National Forest lands reveal that the fire mostly avoided the two treatment areas. Burn severity for the entire study area, including the reference site and Rodeo–Chediski fire area, was classified based on the ΔNBR that was derived from the pre-fire image acquired on 5 June 2002, and the post-fire image acquired on 7 July 2002. Values of ΔNBR were classified into five fire severity categories (adapted from [37]) based on ΔNBR ranges that correspond with visible indications of fire damage to understory and tree foliage and crowns: Regrowth (ΔNBR <-100, Unburned (-100≤ΔNBR <100), Low severity (100≤ΔNBR <270, ground fire; foliage still green), Moderate severity (270≤ΔNBR <550, green and brown foliage with significant foliage consumed by fire), and High severity (ΔNBR >550, crown fire; complete consumption of foliage). Fire severity was reduced greatly within treatment units (outlined with light green and blue polygons;.
Figure 9.
Figure 9.
MODIS NDVI times series data for all composite periods of 2000-2007. Seasonality and an abrupt decrease in the NDVI are seen for all sites except the unburned reference site. The NDVI for the complete Rodeo-Chediski (RC) area drops the most. The results of the post-fire linear regression vegetation recovery model are shown for years 2003 through 2007.
Figure 10.
Figure 10.
MODIS NDVI difference from long term NDVI average times series data for all composite periods of 2000-2007. The NDVI for the Rodeo-Chediski (RC) area and untreated area drop the most, while the reference site show little variation around the mean. Most extreme variation in this metric occurs during winter time, suggesting that sub-pixel clouds and snow covered pixels have not been compensated for completely.
Figure 11.
Figure 11.
The ratio between unburned seasonal reference site NDVI values and the seasonal NDVI values of the1999 and 2001 treated and burned sites show the difference in seasonality using the reference site as the base values.
Figure 12.
Figure 12.
The yearly median COV values are a measure of the relative changes in spatial heterogeneity for the five sites. The COV values peak during the wildfire event (year 2002) and decrease gradually during the years after the fire.
Figure 13.
Figure 13.
Phenological timing metrics are shown for each site and each year for which the data was available and reliable. a) SOS – Start of Season, b) POS – Peak of season and c) LOS – Length of season.
Figure 14.
Figure 14.
Phenological NDVI based metrics are shown for each site and each year for which the data was available. a) NDVI base values, b) NDVI Peak values, and c) Amplitude (NDVI units).
Figure 15.
Figure 15.
Post-fire vegetation recovery results based on the linear vegetation recovery models applied to the inter-annual NDVIbase (left side) and NDVIpeak (right side) phenological metrics and associated times, timebase, SOS and timepeak values.
Figure 16.
Figure 16.
NDVI based phenology metrics are shown for each site and each year for which the data were available. a) Small yearly integral, b) Large yearly integral, and c) Ratio of the left derivative (ld) and right derivative (rd).

References

    1. Westerling A. L., Hidalgo H. G., Cayan D. R., Swetnam T. W. Warming and earlier spring increase western US forest wildfire activity. Science. 2006;313:940–943. - PubMed
    1. Finney M.A., McHugh C.W., Grenfell I.C. Stand- and landscape-level effects of prescribed burning on two Arizona wildfires. Canadian Journal of Forest Research-Revue Canadienne de Recherche Forestiere. 2005;35:1714–1722.
    1. Idris M.H., Kuraji K., Suzuki M. Evaluating vegetation recovery following large-scale forest fires in Borneo and northeastern China using multi-temporal NOAA/AVHRR images. Journal of Forest Research. 2005;10:101–111.
    1. Goetz S.J., Fiske G.J., Bunn A.G. Using satellite time-series data sets to analyze fire disturbance and forest recovery across Canada. Remote Sensing of Environment. 2006;101:352–365.
    1. Lin W.-T., Chou W.-C., Lin C.-Y., Huang P.-H., Tsai J.-S. Vegetation recovery monitoring and assessment at landslides caused by earthquake in Central Taiwan. Forest Ecology and Management. 2005;210:55–66.

LinkOut - more resources