

Inter-Comparison of ASTER and MODIS Surface Reflectance and Vegetation Index Products for Synergistic Applications to Natural Resource Monitoring
- PMID: 27879830
- PMCID: PMC3673426
- DOI: 10.3390/s8042480
Inter-Comparison of ASTER and MODIS Surface Reflectance and Vegetation Index Products for Synergistic Applications to Natural Resource Monitoring
Abstract
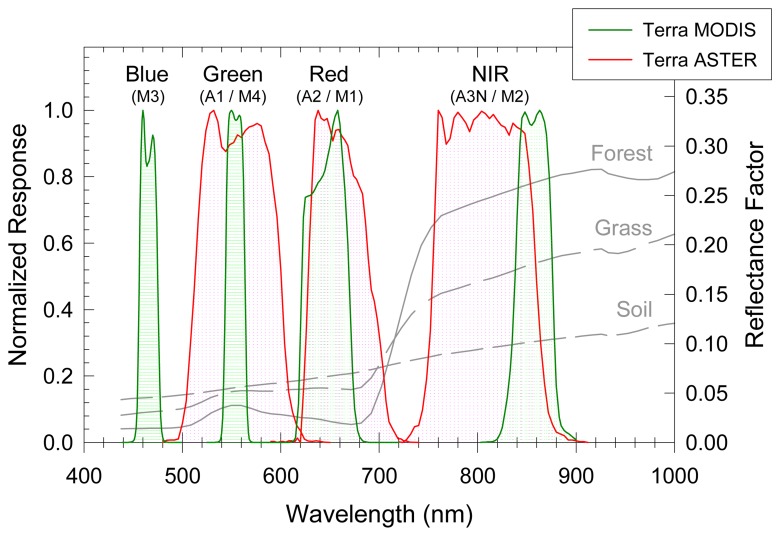
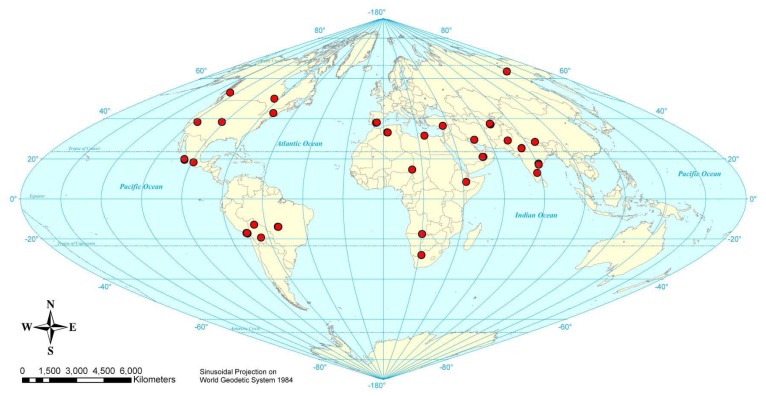
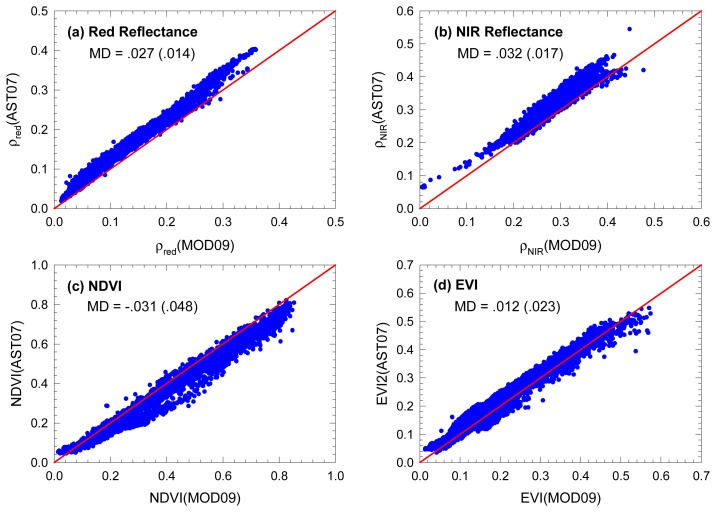
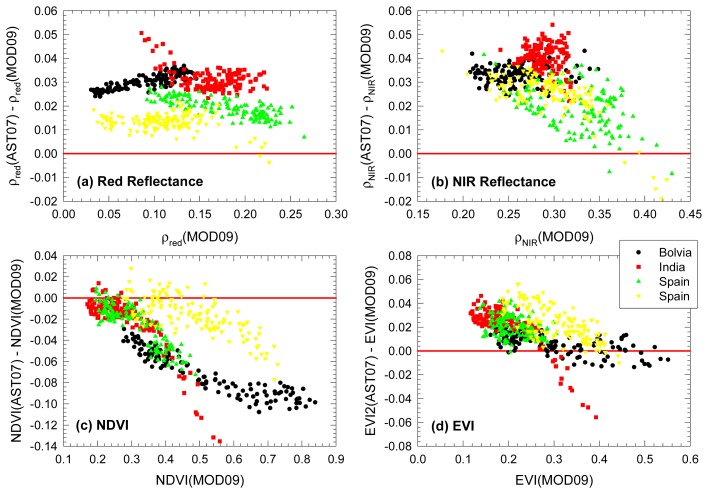
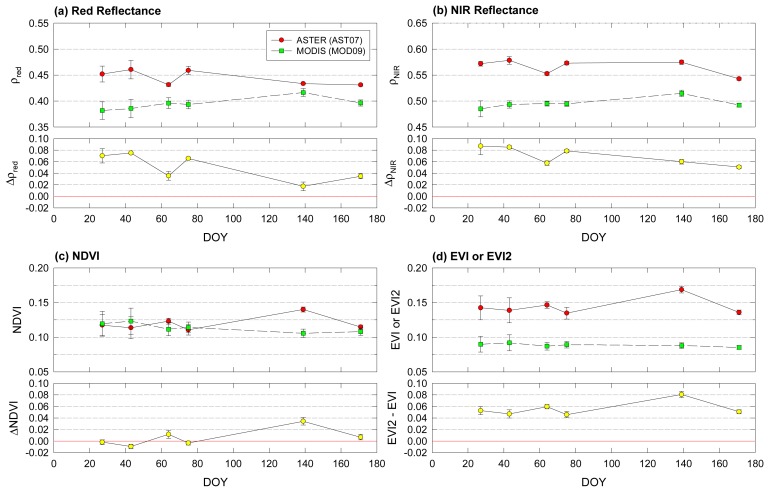
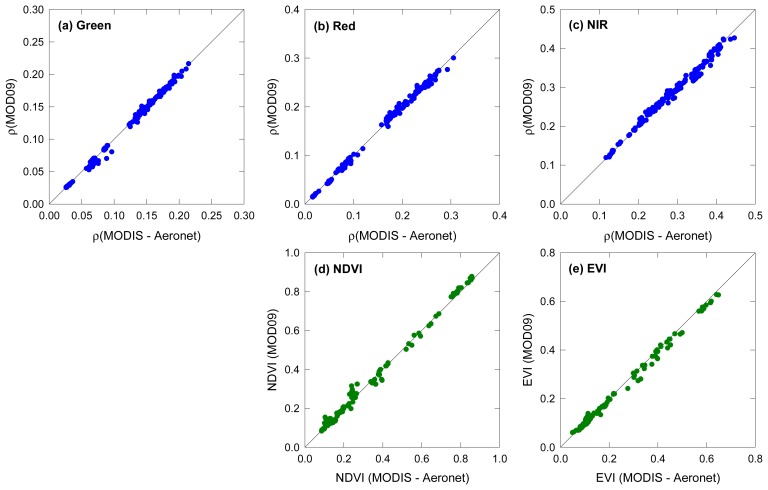
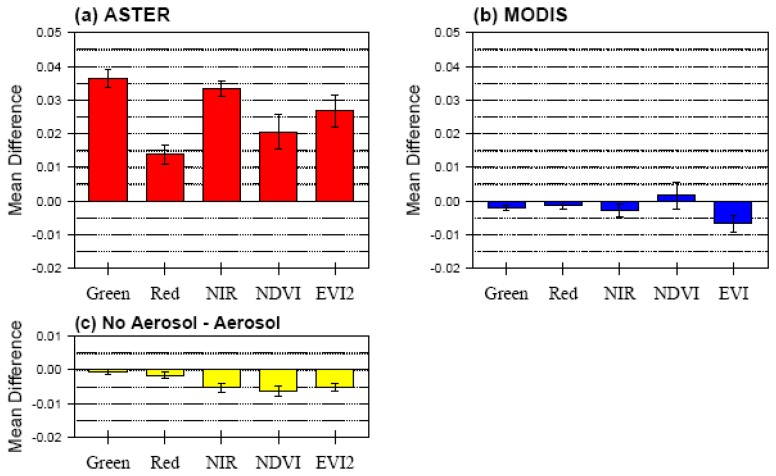
Synergistic applications of multi-resolution satellite data have been of a great interest among user communities for the development of an improved and more effective operational monitoring system of natural resources, including vegetation and soil. In this study, we conducted an inter-comparison of two remote sensing products, namely, visible/near-infrared surface reflectances and spectral vegetation indices (VIs), from the high resolution Advanced Thermal Emission and Reflection Radiometer (ASTER) (15 m) and lower resolution Moderate Resolution Imaging Spectroradiometer (MODIS) (250 m - 500 m) sensors onboard the Terra platform. Our analysis was aimed at understanding the degree of radiometric compatibility between the two sensors' products due to sensor spectral bandpasses and product generation algorithms. Multiple pairs of ASTER and MODIS standard surface reflectance products were obtained at randomly-selected, globally-distributed locations, from which two types of VIs were computed: the normalized difference vegetation index and the enhanced vegetation indices with and without a blue band. Our results showed that these surface reflectance products and the derived VIs compared well between the two sensors at a global scale, but subject to systematic differences, of which magnitudes varied among scene pairs. An independent assessment of the accuracy of ASTER and MODIS standard products, in which "in-house" surface reflectances were obtained using in situ Aeronet atmospheric data for comparison, suggested that the performance of the ASTER atmospheric correction algorithm may be variable, reducing overall quality of its standard reflectance product. Atmospheric aerosols, which were not corrected for in the ASTER algorithm, were found not to impact the quality of the derived reflectances. Further investigation is needed to identify the sources of inconsistent atmospheric correction results associated with the ASTER algorithm, including additional quality assessments of the ASTER and MODIS products with other atmospheric radiative transfer codes.
Keywords: ASTER; MODIS; product inter-comparison; surface reflectance; vegetation index.
Figures


References
-
- McRoberts R.E., Tomppo E.O. Remote sensing support for national forest inventories. Remote Sens. Environ. 2007;110(4):412–419.
-
- Marsett R.C., Qi J.G., Heilman P., Biedenbender S.H., Watson M.C., Amer S., Weltz M., Goodrich D., Marsett R. Remote sensing for grassland management in the arid Southwest. Rangeland Ecol. Manage. 2006;59(5):530–540.
-
- Morton D.C., DeFries R.S., Shimabukuro Y.E., Anderson L.O., Espirito-Santo F.D.B., Hansen M., Carroll M. Rapid assessment of annual deforestaion in the Brazilian Amazon using MODIS data. Earth Interact. 2005;9(8) doi: 10.1175/EI139.1. - DOI
-
- Morisette J.T., Jarnevich C.S., Ullah A., Cai W.J., Pedelty J.A., Gentle J.E., Stohlgren T.J., Schnase J.L. A tamarisk habitat suitability map for the continental United States. Front. Ecol. Environ. 2006;4(1):11–17.
-
- Hill M.J., Held A.A., Leuning R., Coops N.C., Hughes D., Cleugh H.A. MODIS spectral signals at a flux tower site: Relationships with high-resolution data, and CO2 flux and light use efficiency measurements. Remote Sens. Environ. 2006;103(3):351–368.
LinkOut - more resources
Full Text Sources
