

Remote Sensing and Wetland Ecology: a South African Case Study
- PMID: 27879892
- PMCID: PMC3675558
- DOI: 10.3390/s8053542
Remote Sensing and Wetland Ecology: a South African Case Study
Abstract
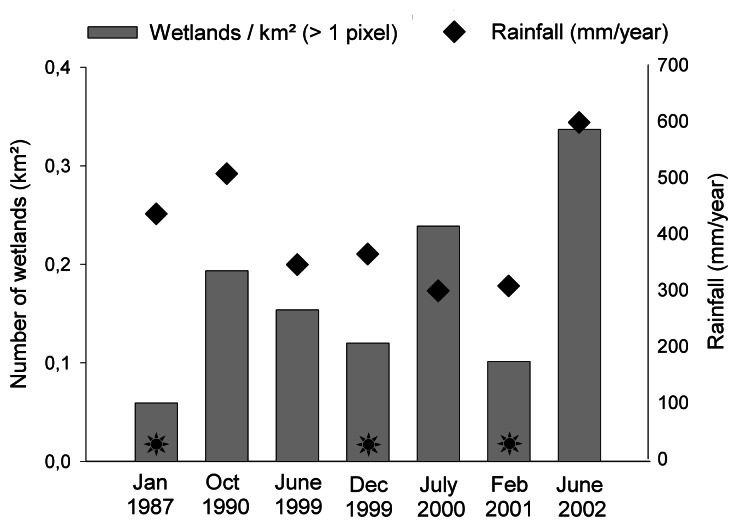
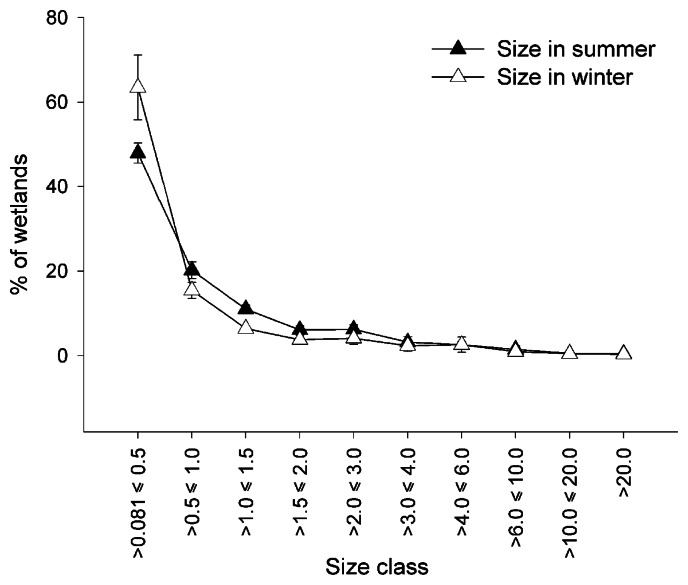
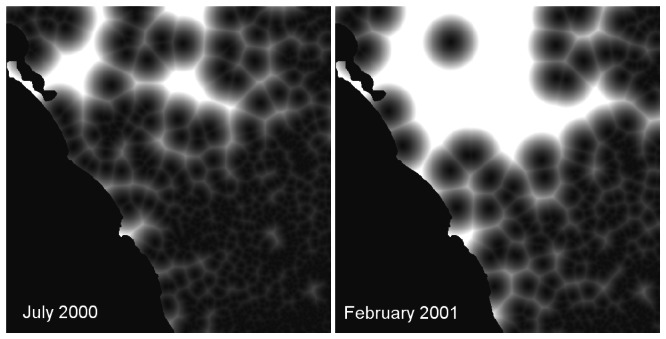
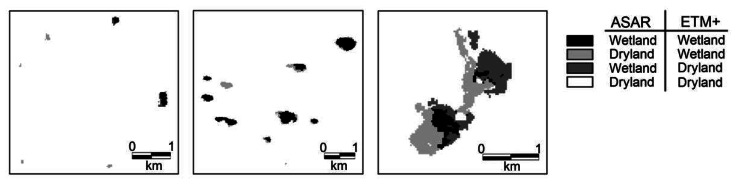
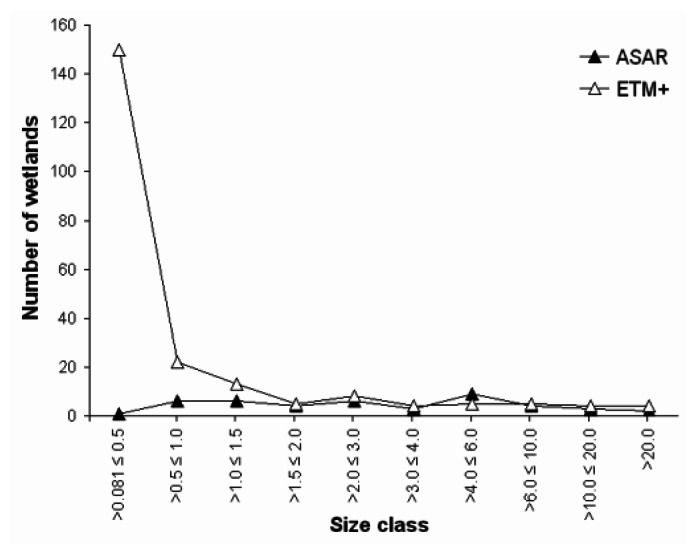
Remote sensing offers a cost efficient means for identifying and monitoring wetlands over a large area and at different moments in time. In this study, we aim at providing ecologically relevant information on characteristics of temporary and permanent isolated open water wetlands, obtained by standard techniques and relatively cheap imagery. The number, surface area, nearest distance, and dynamics of isolated temporary and permanent wetlands were determined for the Western Cape, South Africa. Open water bodies (wetlands) were mapped from seven Landsat images (acquired during 1987 - 2002) using supervised maximum likelihood classification. The number of wetlands fluctuated over time. Most wetlands were detected in the winter of 2000 and 2002, probably related to road constructions. Imagery acquired in summer contained fewer wetlands than in winter. Most wetlands identified from Landsat images were smaller than one hectare. The average distance to the nearest wetland was larger in summer. In comparison to temporary wetlands, fewer, but larger permanent wetlands were detected. In addition, classification of non-vegetated wetlands on an Envisat ASAR radar image (acquired in June 2005) was evaluated. The number of detected small wetlands was lower for radar imagery than optical imagery (acquired in June 2002), probably because of deterioration of the spatial information content due the extensive pre-processing requirements of the radar image. Both optical and radar classifications allow to assess wetland characteristics that potentially influence plant and animal metacommunity structure. Envisat imagery, however, was less suitable than Landsat imagery for the extraction of detailed ecological information, as only large wetlands can be detected. This study has indicated that ecologically relevant data can be generated for the larger wetlands through relatively cheap imagery and standard techniques, despite the relatively low resolution of Landsat and Envisat imagery. For the characterisation of very small wetlands, high spatial resolution optical or radar images are needed. This study exemplifies the benefits of integrating remote sensing and ecology and hence stimulates interdisciplinary research of isolated wetlands.
Keywords: Envisat; Landsat; Wetland monitoring; wetland distribution and density; wetland ecology.
Figures
Similar articles
-
A Review of Wetland Remote Sensing.Sensors (Basel). 2017 Apr 5;17(4):777. doi: 10.3390/s17040777. Sensors (Basel). 2017. PMID: 28379174 Free PMC article. Review.
-
Mapping forested wetlands in the Great Zhan River Basin through integrating optical, radar, and topographical data classification techniques.Environ Monit Assess. 2015 Nov;187(11):696. doi: 10.1007/s10661-015-4914-7. Epub 2015 Oct 20. Environ Monit Assess. 2015. PMID: 26486357
-
Land cover mapping of wetland areas in an agricultural landscape using SAR and Landsat imagery.J Environ Manage. 2009 May;90(7):2270-7. doi: 10.1016/j.jenvman.2007.06.030. Epub 2008 Apr 2. J Environ Manage. 2009. PMID: 18387730
-
Land use and land cover mapping in wetlands one step closer to the ground: Sentinel-2 versus landsat 8.J Environ Manage. 2019 Oct 1;247:484-498. doi: 10.1016/j.jenvman.2019.06.084. Epub 2019 Jun 27. J Environ Manage. 2019. PMID: 31254763
-
[Review on wetland water level monitoring using interferometric synthetic aperture radar].Ying Yong Sheng Tai Xue Bao. 2020 Aug;31(8):2841-2848. doi: 10.13287/j.1001-9332.202008.035. Ying Yong Sheng Tai Xue Bao. 2020. PMID: 34494807 Review. Chinese.
Cited by
-
Ecosystem evaluation (1989-2012) of Ramsar wetland Deepor Beel using satellite-derived indices.Environ Monit Assess. 2014 Nov;186(11):7909-27. doi: 10.1007/s10661-014-3976-2. Epub 2014 Aug 5. Environ Monit Assess. 2014. PMID: 25092138
References
-
- Johnson L.B., Gage S.H. Landscape approaches to the analysis of aquatic ecosystems. Freshwat. Biol. 1997;37:113–132.
-
- Baker C., Lawrence R., Montagne C., Patten D. Mapping wetlands and riparian areas using Landsat ETM+ imagery and decision-tree-based models. Wetlands. 2006;26:465–474.
-
- Baker C., Lawrence R., Montagne C., Patten D. Change detection of wetland ecosystems using Landsat imagery and change vector analysis. Wetlands. 2007;27:610–619.
-
- Cohen W.B., Goward S.N. Landsat's role in ecological applications of remote sensing. BioScience. 2004;54:535–545.
-
- Ozesmi S.L., Bauer M.E. Satellite remote sensing of wetlands. Wetlands Ecol. Manage. 2002;10:381–402.
LinkOut - more resources
Full Text Sources
