. 2016 Nov 23;14(11):e1002579.
doi: 10.1371/journal.pbio.1002579. eCollection 2016 Nov.

Distribution of Misfolded Prion Protein Seeding Activity Alone Does Not Predict Regions of Neurodegeneration

Affiliations

Distribution of Misfolded Prion Protein Seeding Activity Alone Does Not Predict Regions of Neurodegeneration

James Alibhai et al. PLoS Biol. .

Abstract

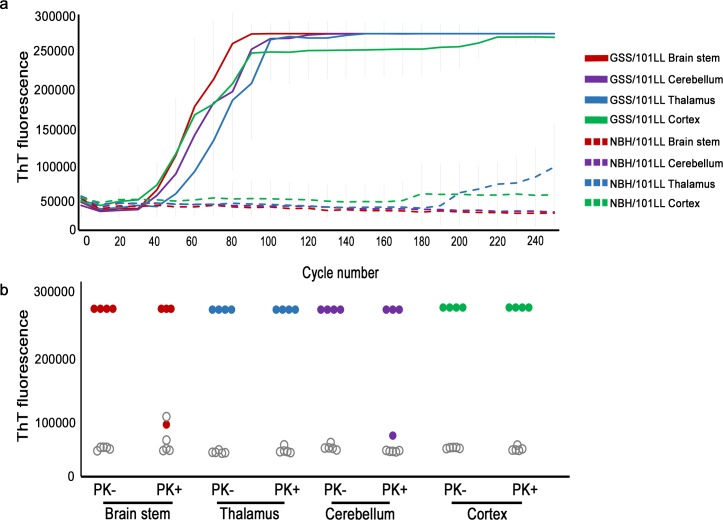
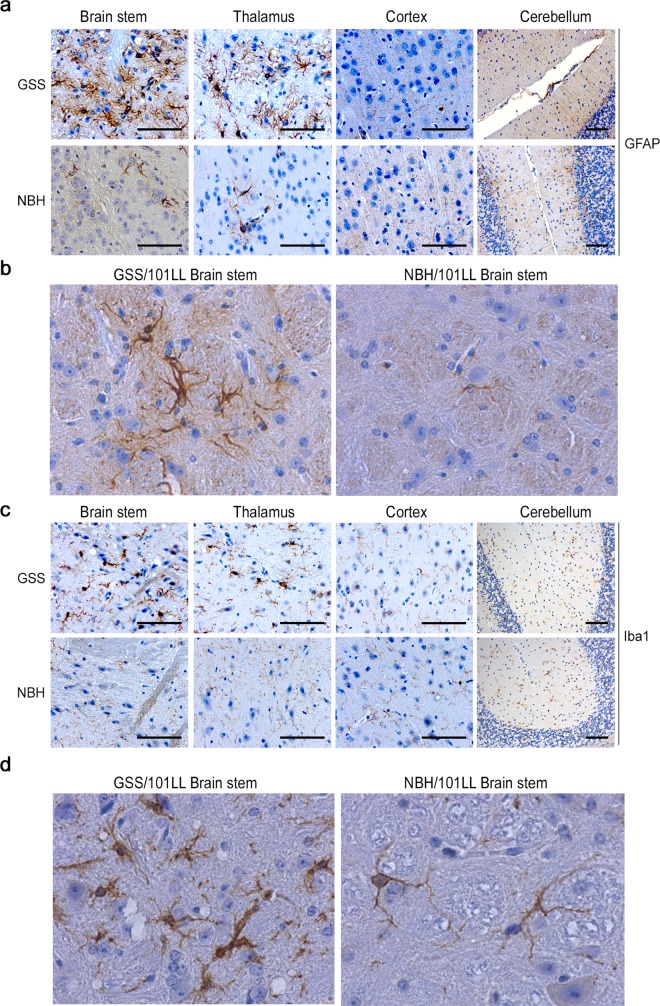
Protein misfolding is common across many neurodegenerative diseases, with misfolded proteins acting as seeds for "prion-like" conversion of normally folded protein to abnormal conformations. A central hypothesis is that misfolded protein accumulation, spread, and distribution are restricted to specific neuronal populations of the central nervous system and thus predict regions of neurodegeneration. We examined this hypothesis using a highly sensitive assay system for detection of misfolded protein seeds in a murine model of prion disease. Misfolded prion protein (PrP) seeds were observed widespread throughout the brain, accumulating in all brain regions examined irrespective of neurodegeneration. Importantly, neither time of exposure nor amount of misfolded protein seeds present determined regions of neurodegeneration. We further demonstrate two distinct microglia responses in prion-infected brains: a novel homeostatic response in all regions and an innate immune response restricted to sites of neurodegeneration. Therefore, accumulation of misfolded prion protein alone does not define targeting of neurodegeneration, which instead results only when misfolded prion protein accompanies a specific innate immune response.


Conflict of interest statement

The authors have declared that no competing interests exist.

Figures

Fig 1
Fig 1. Detection of misfolded PrP using IHC at different time-points in different brain regions.
(a) At 150 dpi, small quantities of fine-punctate misfolded PrP deposits can be detected in the midbrain. This positive staining could be observed in five of twelve GSS/101LL mice tested, but no staining was observed in any NBH/101LL animal in any brain region (n = 12). At 220 dpi, fine-punctate misfolded PrP deposits were detectable in both the midbrain and brain stem, which was observed in four of six GSS/101LL mice tested, but no staining was observed in any NBH/101LL animal in any brain region (n = 6). At clinical onset of disease (291.1 ± 5.3 dpi), misfolded PrP staining could be observed in midbrain, brain stem, and the thalamus but not in cortex or cerebellum in GSS/101LL mice. This staining pattern was observed in all mice tested at this stage (n = 9), whereas no staining was observed in any NBH/101LL animal in any brain region tested (n = 4). Scale bars: midbrain = 100 μm, brain stem, thalamus, cortex, and cerebellum = 200 μm. (b) Quantification of PrP+ staining intensity. The levels of PrP+ staining are originally high in the midbrain, but at later time-points in other brain regions, such as brain stem and thalamus, the levels of PrP+ staining increase to comparable levels to that of the midbrain. In cortex and cerebellum, no change in PrP+ staining was observed. Quantitation was performed using colour deconvolution plug-in to Image-J software.
Fig 2
Fig 2. RT-QuIC shows widespread detection of misfolded prion seeds beyond levels detected using IHC.
(a) ThT fluorescence readout over time during the RT-QuIC assay. Each solid line represents a GSS/101LL brain region, whereas each dotted line represents a NBH/101LL brain region. These data are comprised of the averages from triplicate RT-QuIC reactions from three separate repeat experiments collected from four separate GSS/101LL dissected brains and five NBH/101LL dissected brains all at the terminal stage of disease (291.1 ± 5.3 dpi). The different brain regions are colour coded to illustrate the brain stem (red), thalamus (blue), cerebellum (purple), and cortex (green) for both the GSS/101LL and NBH/101LL samples. (b) RT-QuIC ThT fluorescence readout at 48 h (respective to cycle 190 in the RT-QuIC assay) using samples with or without PK exposure. ThT fluorescence increases are observed in each PK-exposed brain region of GSS/101LL mice (n = 4), showing that the misfolded PrP responsible for the seeding event has obtained a PK-resistant conformation in all GSS/101LL brain regions. No increase in ThT fluorescence was observed in NBH/101LL control brain regions (n = 5), demonstrating the specificity of prion seeding ability in GSS/101LL brain regions. GSS/101LL samples are presented as red (brain stem), blue (thalamus), purple (cerebellum), or green (cortex), and region-matched NBH/101LL controls are plotted in the same columns as grey open dots. These data are comprised of triplicate RT-QuIC reactions for each brain region of each animal tested.
Fig 3
Fig 3. Morphological glial cell responses are restricted to specific brain regions.
(a) Severe astrogliosis is observed in the brain stem and thalamus of GSS/101LL but is not detected in NBH/101LL age-matched controls or in the cortex or cerebellum of GSS/101LL mice. (b) High magnification image demonstrating the change in astrocyte expression of GFAP in GSS/101LL mice compared to equivalent NBH/101LL brain regions. (c) A distinct change in cell morphology to that of a hypertrophied cell body and short thick processes could be observed in Iba1+ cells, indicative of activated microglia, in GSS/101LL brain stem and thalamus. No change in cell morphology was observed in either NBH/101LL age- and region-matched control samples or in GSS/101LL cortex and cerebellum samples. (d) High magnification image to highlight the shortening and thickening of microglial processes, a characteristic common to morphologically activated microglia. These findings are observed consistently across all animals tested; GSS/101LL (n = 9), NBH/101LL (n = 4). Scale bars = 100 μm.
Fig 4
Fig 4. Changes in neuronal markers demonstrate specific neuronal populations targeted to certain brain regions.
(a) Tyrosine hydroxylase staining of midbrain neurons. No visible change in staining pattern could be observed in any GSS/101LL animal tested at 240 dpi (n = 6) compared to age- and region-matched NBH/101LL controls (n = 6). A marked loss of staining pattern is observed in the midbrain neurons upon clinical onset (291.1 ± 5.3 dpi), indicative of a loss of tyrosine hydroxylase neurons upon clinical onset of disease. Scale bar = 200 μm. (b) MAP2 staining in brain stem has marked loss of MAP2 cell–associated staining compared to NBH/101LL brain stem age-matched control. Overall, levels of MAP2 staining are visibly lost in the ventral-medial parts of the thalamus compared to region- and age-matched NBH/101LL controls. No change could be observed in the staining pattern of MAP2 in any part of the cortex or cerebellum compared to region- and age-matched NBH/101LL controls. These findings are observed consistently across all animals tested; GSS/101LL (n = 9), NBH/101LL (n = 4). Scale bars = 100 μm. (c) Higher magnification examples of MAP2 neurons lost in the gigantoreticular nuclei of the brain stem but no loss of neurons evidenced in the cortex. (d) Parvalbumin staining of Purkinje cells of the cerebellum at clinical stages of disease in GSS/101LL animals (291.1 ± 5.3 dpi; n = 3) compared to age-matched NBH/101LL controls (n = 3). Scale bars = 100 μm. (e) Neuronal cell counts of substantia nigra (SN) neurons of the midbrain, gigantocellular reticular nuclei (Gi) of the brain stem, and retrosplenial granular region (RSGc) of the cortex from three representative animals. Cells counted based upon the number of cells showing positive staining for either tyrosine hydroxylase (TyHy+) in the SN or MAP2 in the Gi and RSGc. (f) Quantification of MAP2+ staining intensity from three representative animals showing a loss of MAP2 staining in brain stem and the thalamus but no change in the cortex or cerebellum. Quantification of staining was performed using colour deconvolution plug-in of Image-J software.
Fig 5
Fig 5. Neither quantity nor time of exposure of misfolded prion seeds are responsible for restricted neurodegeneration.
(a) RT-QuIC titration of brain region homogenates (n = 4) shows that all brain regions dilute to a concentration of at least 0.001% (w/v) of the wet sample weight (10−5). Data shown are the average ThT fluorescence levels after 60 h incubation in RT-QuIC of triplicate RT-QuIC reactions. Grey open dots represent NBH/101LL region-matched controls. (b) RT-QuIC run on GSS/101LL brain regions at several time-points throughout the incubation period. Each sample was run at a concentration of 0.1% (w/v) of the wet sample weight (10−3) for n = 5 GSS/101LL and NBH/101LL mice at each time-point, with exception of clinical (terminal) stage of disease (n = 4) and run in triplicate RT-QuIC reactions. Grey open dots demonstrate average ThT fluorescence of NBH controls (n = 5) at each time-point. Data shown are the ThT fluorescence levels after 48 h incubation in RT-QuIC.
Fig 6
Fig 6. All GSS/101LL brain regions show disease-associated gene expression changes.
(A) Biolayout Express3D graph showing a spatial representation of genes orientated according to their correlation to one another. Three major and separate components of highly correlated genes were formed using this software, which we term components A–C. This structure was used by the Markov clustering algorithm to divide the graph into clusters of co-expressed transcripts, which are shown in the graph as different colours. Representative clusters, shown as numbers 1–6, are shown on the graph, which highlights the expression differences found between each of the three major components identified. These can be viewed as average gene expression as bar graphs (B). (C) Filtered gene lists from the GSS/101LL cerebellum, thalamus, and brain stem are overlaid onto the original graph. Shown here are the filtered genes highlighted in yellow (cerebellum), purple (thalamus), or turquoise (brain stem) as part of component B of the main graph shown in (A). The highlighted genes in each brain region were observed predominantly within the same part of the graph rather than segregating into distinct groups, demonstrating that these differentially expressed genes between brain regions were highly correlated.
Fig 7
Fig 7. Disease-associated gene expression changes can be predominantly attributed to microglia in all GSS/101LL brain regions tested.
(a) Spider graph representation of component B genes after filtering. Up-regulation of genes in all GSS/101LL brain regions, but particularly increased in GSS/101LL brain stem and thalamus compared to GSS/101LL cerebellum and cortex. N = number of genes present after data are filtered that constitute the average intensity value. The number of genes represented is highest in GSS/101LL brain stem but lowest in GSS/101LL cortex. (b) Gene expression can be attributed to specific cell types when overlaid onto previous microarray datasets. These data show a simplified version to demonstrate how different genes that are known to have selective expression in specific cell types in vivo can be attributed to their expected cell type. For example, Cd11b is a gene generally regarded as a pan-macrophage marker, and hence we show the increased expression of this gene in macrophage/microglial cell populations compared to other cell types. Colony-stimulating factor 1 (Csf1) is a gene that is up-regulated during immune cell activation, shown here by its increased expression in lipopolysaccharide-activated macrophages. Gfap is a gene expressed highly in astrocytes, and, indeed, we show the high and specific expression of Gfap in astrocytes in this dataset. Finally, synapsin I is a synaptic-specific protein and therefore will most commonly be expressed in neurons, as is shown here. (c) Attribution of genes that are identified in component b to their respective cell type shows that a majority of genes that are identified in component b can be attributed to macrophage/microglia. (d) Representation of the macrophage/microglia gene list overlap of different brain regions tested.
Fig 8
Fig 8. Microglial-neuron communication may define the relative resilience or susceptibility of neurons to degenerate.
Microglia are known to survey the neuronal parenchyma and interact intermittently with all parts of the neuron. The accumulation of misfolded PrP, and potentially the different types of aggregates, will have an impact on the communication and interaction between neurons and microglia. As a result, we observe different microglial responses during disease as well as selective vulnerability of neurons to degenerate in specific brain regions. It remains unclear whether the physiological differences of neuronal signalling, the known gene expression differences of microglia between brain regions [37], or the different types of misfolded PrP aggregate are responsible for the different microglial activation states. Based on the associations between the different microglial activation states, the restricted neurodegeneration observed, and current knowledge of the importance of innate immune activation in defining severity of neurodegeneration, we speculate that the different microglial activation states could be defining neurodegeneration between different brain regions. This could either occur as a protective microglial response in regions showing resilience to neurodegeneration or a contributor to neurodegeneration in susceptible regions, or both. Our study highlights the need to further understand the basis for different microglial activation states, which could allow future studies to manipulate microglial responses from a primed activated state to one that regulates homeostasis and, thus, could represent a vital therapeutic target for intervention during disease.

References

    1. Soto C, Estrada LD (2008) Protein misfolding and neurodegeneration. Arch Neurol 65: 184–189. 10.1001/archneurol.2007.56 - DOI - PubMed
    1. Bueler H, Aguzzi A, Sailer A, Greiner RA, Autenried P, et al. (1993) Mice devoid of PrP are resistant to scrapie. Cell 73: 1339–1347. - PubMed
    1. Manson JC, Clarke AR, Hooper ML, Aitchison L, McConnell I, et al. (1994) 129/Ola mice carrying a null mutation in PrP that abolishes messenger RNA production are developmentally normal. Molecular Neurobiology 8: 121–127. 10.1007/BF02780662 - DOI - PubMed
    1. Brandner S, Isenmann S, Raeber A, Fischer M, Sailer A, et al. (1996) Normal host prion protein necessary for scrapie-induced neurotoxicity. Nature 379: 339–343. 10.1038/379339a0 - DOI - PubMed
    1. Cunningham C, Deacon R, Wells H, Boche D, Waters S, et al. (2003) Synaptic changes characterize early behavioural signs in the ME7 model of murine prion disease. Eur J Neurosci 17: 2147–2155. - PubMed