

Paradoxical Sleep Deprivation Causes Cardiac Dysfunction and the Impairment Is Attenuated by Resistance Training
- PMID: 27880816
- PMCID: PMC5120843
- DOI: 10.1371/journal.pone.0167029
Paradoxical Sleep Deprivation Causes Cardiac Dysfunction and the Impairment Is Attenuated by Resistance Training
Abstract
Background: Paradoxical sleep deprivation activates the sympathetic nervous system and the hypothalamus-pituitary-adrenal axis, subsequently interfering with the cardiovascular system. The beneficial effects of resistance training are related to hemodynamic, metabolic and hormonal homeostasis. We hypothesized that resistance training can prevent the cardiac remodeling and dysfunction caused by paradoxical sleep deprivation.
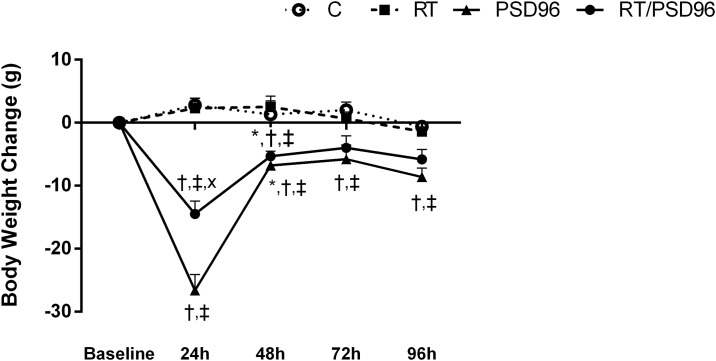
Methods: Male Wistar rats were distributed into four groups: control (C), resistance training (RT), paradoxical sleep deprivation for 96 hours (PSD96) and both resistance training and sleep deprivation (RT/PSD96). Doppler echocardiograms, hemodynamics measurements, cardiac histomorphometry, hormonal profile and molecular analysis were evaluated.
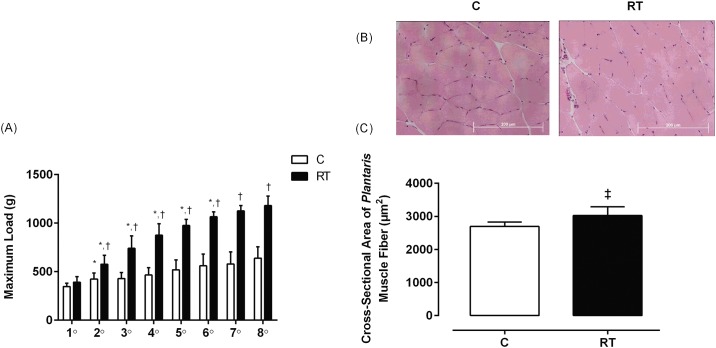
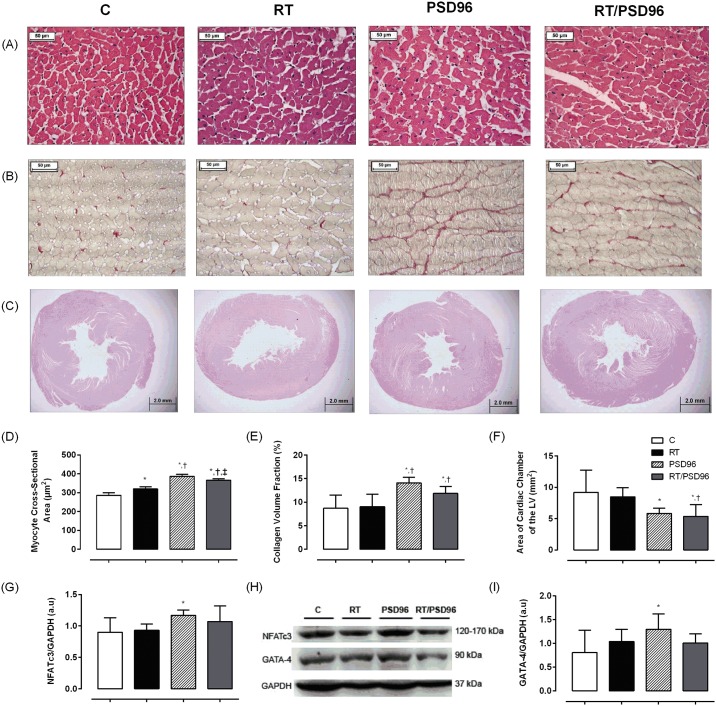
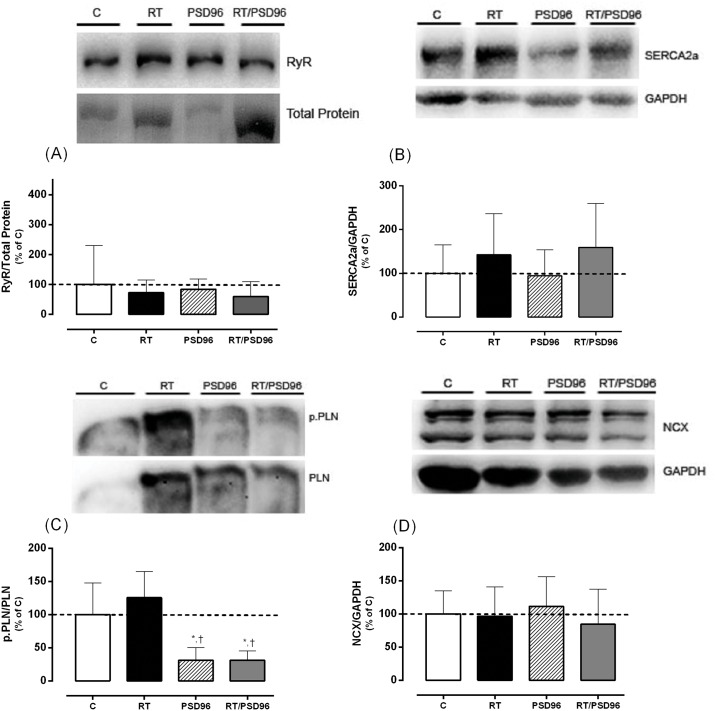
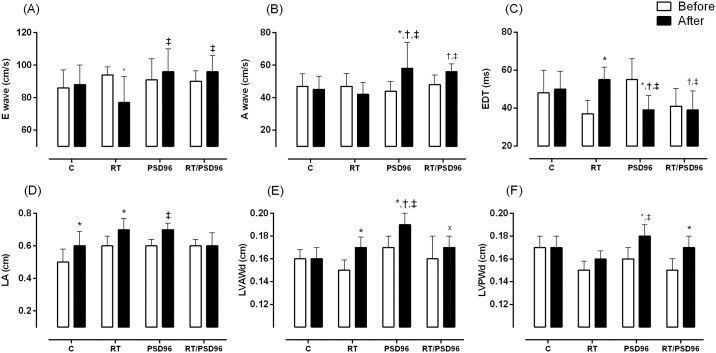
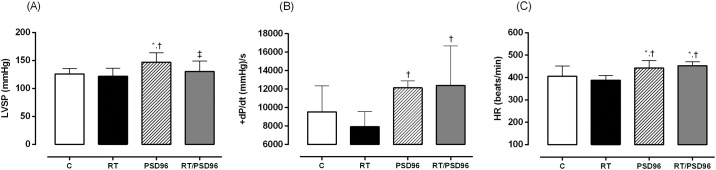
Results: Compared to the C group, PSD96 group had a higher left ventricular systolic pressure, heart rate and left atrium index. In contrast, the left ventricle systolic area and the left ventricle cavity diameter were reduced in the PSD96 group. Hypertrophy and fibrosis were also observed. Along with these alterations, reduced levels of serum testosterone and insulin-like growth factor-1 (IGF-1), as well as increased corticosterone and angiotensin II, were observed in the PSD96 group. Prophylactic resistance training attenuated most of these changes, except angiotensin II, fibrosis, heart rate and concentric remodeling of left ventricle, confirmed by the increased of NFATc3 and GATA-4, proteins involved in the pathologic cardiac hypertrophy pathway.
Conclusions: Resistance training effectively attenuates cardiac dysfunction and hormonal imbalance induced by paradoxical sleep deprivation.
Conflict of interest statement
The authors have declared that no competing interests exist.
Figures
Similar articles
-
Sympathetic and angiotensinergic responses mediated by paradoxical sleep loss in rats.J Renin Angiotensin Aldosterone Syst. 2011 Sep;12(3):146-52. doi: 10.1177/1470320310391504. Epub 2011 Mar 11. J Renin Angiotensin Aldosterone Syst. 2011. PMID: 21398399
-
Resistance training minimizes catabolic effects induced by sleep deprivation in rats.Appl Physiol Nutr Metab. 2015 Nov;40(11):1143-50. doi: 10.1139/apnm-2015-0061. Epub 2015 Jul 21. Appl Physiol Nutr Metab. 2015. PMID: 26513007
-
Resistance training attenuates salt overload-induced cardiac remodeling and diastolic dysfunction in normotensive rats.Braz J Med Biol Res. 2017 Aug 7;50(9):e6146. doi: 10.1590/1414-431X20176146. Braz J Med Biol Res. 2017. PMID: 28793051 Free PMC article.
-
Patterns of left ventricular hypertrophy in essential hypertension: should echocardiography guide the pharmacological treatment?Int J Cardiol. 2008 Feb 29;124(2):134-8. doi: 10.1016/j.ijcard.2007.01.089. Epub 2007 Apr 27. Int J Cardiol. 2008. PMID: 17467083 Review.
-
Growth hormone, acromegaly, and heart failure: an intricate triangulation.Clin Endocrinol (Oxf). 2003 Dec;59(6):660-71. doi: 10.1046/j.1365-2265.2003.01780.x. Clin Endocrinol (Oxf). 2003. PMID: 14974906 Review.
Cited by
-
Chronic Partial Sleep Deprivation Increased the Incidence of Atrial Fibrillation by Promoting Pulmonary Vein and Atrial Arrhythmogenesis in a Rodent Model.Int J Mol Sci. 2024 Jul 11;25(14):7619. doi: 10.3390/ijms25147619. Int J Mol Sci. 2024. PMID: 39062858 Free PMC article.
-
Could a Habitual Sleep Restriction of One-two Hours Be Detrimental to the Benefits of Resistance Training?Sleep Sci. 2024 Jun 5;17(3):e244-e254. doi: 10.1055/s-0044-1787297. eCollection 2024 Sep. Sleep Sci. 2024. PMID: 39268337 Free PMC article.
-
Role of exercise in reducing the risk of cardiovascular diseases associated with sleep disorders.Zhong Nan Da Xue Xue Bao Yi Xue Ban. 2024 Apr 28;49(4):526-533. doi: 10.11817/j.issn.1672-7347.2024.230426. Zhong Nan Da Xue Xue Bao Yi Xue Ban. 2024. PMID: 39019781 Free PMC article. Review. Chinese, English.
-
Lithium Treatment Improves Cardiac Dysfunction in Rats Deprived of Rapid Eye Movement Sleep.Int J Mol Sci. 2022 Sep 23;23(19):11226. doi: 10.3390/ijms231911226. Int J Mol Sci. 2022. PMID: 36232526 Free PMC article.
-
Acute sleep deprivation increases inflammation and aggravates heart failure after myocardial infarction.J Sleep Res. 2022 Dec;31(6):e13679. doi: 10.1111/jsr.13679. Epub 2022 Jul 3. J Sleep Res. 2022. PMID: 35785454 Free PMC article.
References
-
- Iber C, Ancoli-Israel, S., Chesson Jr., A. L., & Quan, S. F. The AASM Manual for the Scoring of Sleep and Associated Events; Westchester IAAoSM, editor2007. 59 p.
MeSH terms
Substances
LinkOut - more resources
Full Text Sources
Other Literature Sources
Miscellaneous
