Chronic Low-Calorie Sweetener Use and Risk of Abdominal Obesity among Older Adults: A Cohort Study
- PMID: 27880832
- PMCID: PMC5120853
- DOI: 10.1371/journal.pone.0167241
Chronic Low-Calorie Sweetener Use and Risk of Abdominal Obesity among Older Adults: A Cohort Study
Abstract
Introduction: Low-calorie sweetener use for weight control has come under increasing scrutiny as obesity, especially abdominal obesity, remain entrenched despite substantial low-calorie sweetener use. We evaluated whether chronic low-calorie sweetener use is a risk factor for abdominal obesity.
Participants and methods: We used 8268 anthropometric measurements and 3096 food diary records with detailed information on low-calorie sweetener consumption in all food products, from 1454 participants (741 men, 713 women) in the Baltimore Longitudinal Study of Aging collected from 1984 to 2012 with median follow-up of 10 years (range: 0-28 years). At baseline, 785 were low-calorie sweetener non-users (51.7% men) and 669 participants were low-calorie sweetener users (50.1% men). Time-varying low-calorie sweetener use was operationalized as the proportion of visits since baseline at which low-calorie sweetener use was reported. We used marginal structural models to determine the association between baseline and time-varying low-calorie sweetener use with longitudinal outcomes-body mass index, waist circumference, obesity and abdominal obesity-with outcome status assessed at the visit following low-calorie sweetener ascertainment to minimize the potential for reverse causality. All models were adjusted for year of visit, age, sex, age by sex interaction, race, current smoking status, dietary intake (caffeine, fructose, protein, carbohydrate, and fat), physical activity, diabetes status, and Dietary Approaches to Stop Hypertension score as confounders.
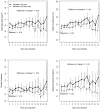
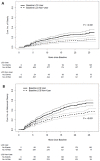
Results: With median follow-up of 10 years, low-calorie sweetener users had 0.80 kg/m2 higher body mass index (95% confidence interval [CI], 0.17-1.44), 2.6 cm larger waist circumference (95% CI, 0.71-4.39), 36.7% higher prevalence (prevalence ratio = 1.37; 95% CI, 1.10-1.69) and 53% higher incidence (hazard ratio = 1.53; 95% CI 1.10-2.12) of abdominal obesity than low-calorie sweetener non-users.
Conclusions: Low-calorie sweetener use is independently associated with heavier relative weight, a larger waist, and a higher prevalence and incidence of abdominal obesity suggesting that low-calorie sweetener use may not be an effective means of weight control.
Conflict of interest statement
The authors have declared that no competing interests exist.
Figures


References
-
- World Obesity Federation. World Obesity Day Statistics. 2015. http://www.worldobesity.org/what-we-do/action-initiative/aiprogrammes/wo.... Accessed 2016 May 12.
-
- Grundy SM, Brewer HB, Cleeman JI, Smith SC, Lenfant C. Definition of Metabolic Syndrome: Report of the National Heart, Lung, and Blood Institute/American Heart Association Conference on Scientific Issues Related to Definition. Circulation. 2004;109(3):433–8. 10.1161/01.cir.0000111245.75752.c6 - DOI - PubMed
Publication types
MeSH terms
Substances
LinkOut - more resources
Full Text Sources
Other Literature Sources

