Genome-Scale Assessment of Age-Related DNA Methylation Changes in Mouse Spermatozoa
- PMID: 27880848
- PMCID: PMC5120852
- DOI: 10.1371/journal.pone.0167127
Genome-Scale Assessment of Age-Related DNA Methylation Changes in Mouse Spermatozoa
Abstract
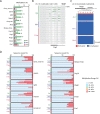
DNA methylation plays important roles in the production and functioning of spermatozoa. Recent studies have suggested that DNA methylation patterns in spermatozoa can change with age, but the regions susceptible to age-related methylation changes remain to be fully elucidated. In this study, we conducted genome-scale DNA methylation profiling of spermatozoa obtained from C57BL/6N mice at 8 weeks (8w), 18 weeks (18w) and 17 months of age (17m). There was no substantial difference in the global DNA methylation patterns between 18w and 17m samples except for a slight increase of methylation levels in long interspersed nuclear elements in the 17m samples. We found that maternally methylated imprinting control regions (mICRs) and spermatogenesis-related gene promoters had 5-10% higher methylation levels in 8w samples than in 18w or 17m samples. Analysis of individual sequence reads suggested that these regions were fully methylated (80-100%) in a subset of 8w spermatozoa. These regions are also known to be highly methylated in a subset of postnatal spermatogonia, which might be the source of the increased DNA methylation in 8w spermatozoa. Another possible source was contamination by somatic cells. Although we carefully purified the spermatozoa, it was difficult to completely exclude the possibility of somatic cell contamination. Further studies are needed to clarify the source of the small increase in DNA methylation in the 8w samples. Overall, our findings suggest that DNA methylation patterns in mouse spermatozoa are relatively stable throughout reproductive life.
Conflict of interest statement
The authors have declared that no competing interests exist.
Figures


Similar articles
-
Origin and roles of genomic methylation patterns in male germ cells.Semin Cell Dev Biol. 1998 Aug;9(4):467-74. doi: 10.1006/scdb.1998.0225. Semin Cell Dev Biol. 1998. PMID: 9813194 Review.
-
Acquisition of the H19 methylation imprint occurs differentially on the parental alleles during spermatogenesis.Genomics. 1999 May 15;58(1):18-28. doi: 10.1006/geno.1999.5813. Genomics. 1999. PMID: 10331941
-
Aberrant DNA methylation patterns of spermatozoa in men with unexplained infertility.Hum Reprod. 2015 May;30(5):1014-28. doi: 10.1093/humrep/dev053. Epub 2015 Mar 9. Hum Reprod. 2015. PMID: 25753583
-
DNA methyltransferase 1 (Dnmt1) mutation affects Snrpn imprinting in the mouse male germ line.Genome. 2012 Sep;55(9):673-82. doi: 10.1139/g2012-056. Epub 2012 Sep 11. Genome. 2012. PMID: 22967183
-
Germline-derived DNA methylation and early embryo epigenetic reprogramming: The selected survival of imprints.Int J Biochem Cell Biol. 2015 Oct;67:128-38. doi: 10.1016/j.biocel.2015.04.014. Epub 2015 May 9. Int J Biochem Cell Biol. 2015. PMID: 25966912 Review.
Cited by
-
Age-related changes in DNA methylation levels at CpG sites in bull spermatozoa and in vitro fertilization-derived blastocyst-stage embryos revealed by combined bisulfite restriction analysis.J Reprod Dev. 2019 Aug 9;65(4):305-312. doi: 10.1262/jrd.2018-146. Epub 2019 May 2. J Reprod Dev. 2019. PMID: 31061296 Free PMC article.
-
Age-associated epigenetic changes in mammalian sperm: implications for offspring health and development.Hum Reprod Update. 2023 Jan 5;29(1):24-44. doi: 10.1093/humupd/dmac033. Hum Reprod Update. 2023. PMID: 36066418 Free PMC article. Review.
-
Association of four imprinting disorders and ART.Clin Epigenetics. 2019 Feb 7;11(1):21. doi: 10.1186/s13148-019-0623-3. Clin Epigenetics. 2019. PMID: 30732658 Free PMC article.
-
Tet1 Deficiency Leads to Premature Reproductive Aging by Reducing Spermatogonia Stem Cells and Germ Cell Differentiation.iScience. 2020 Mar 27;23(3):100908. doi: 10.1016/j.isci.2020.100908. Epub 2020 Feb 13. iScience. 2020. PMID: 32114381 Free PMC article.
-
Advanced paternal age directly impacts mouse embryonic placental imprinting.PLoS One. 2020 Mar 6;15(3):e0229904. doi: 10.1371/journal.pone.0229904. eCollection 2020. PLoS One. 2020. PMID: 32142542 Free PMC article.
References
-
- Hacker-Klom UB. Age dependence of murine spermatogenesis. Z Naturforsch C. 1995;50(3–4):303–310. - PubMed
MeSH terms
LinkOut - more resources
Full Text Sources
Other Literature Sources
Medical

