. 2016 Nov 22;17(9):2195-2209.
doi: 10.1016/j.celrep.2016.10.085.

Direct Probing of Germinal Center Responses Reveals Immunological Features and Bottlenecks for Neutralizing Antibody Responses to HIV Env Trimer

Affiliations

Direct Probing of Germinal Center Responses Reveals Immunological Features and Bottlenecks for Neutralizing Antibody Responses to HIV Env Trimer

Colin Havenar-Daughton et al. Cell Rep. .

Abstract

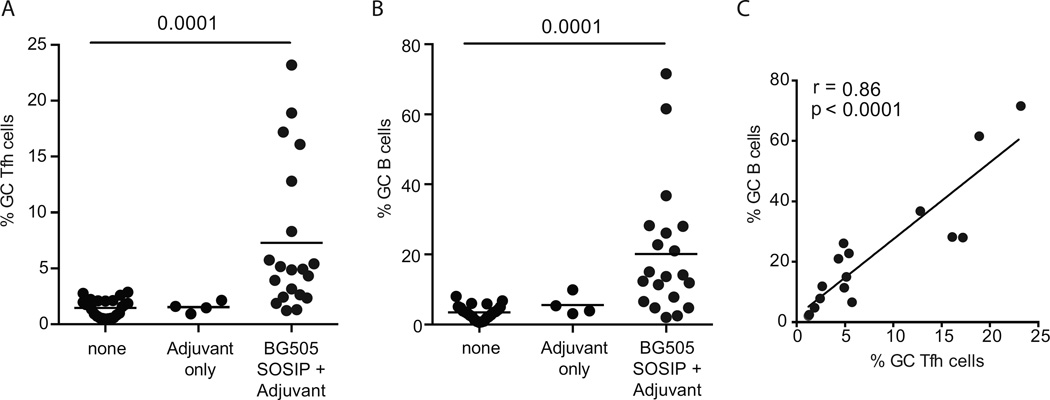
Generating tier 2 HIV-neutralizing antibody (nAb) responses by immunization remains a challenging problem, and the immunological barriers to induction of such responses with Env immunogens remain unclear. Here, some rhesus monkeys developed autologous tier 2 nAbs upon HIV Env trimer immunization (SOSIP.v5.2) whereas others did not. This was not because HIV Env trimers were immunologically silent because all monkeys made similar ELISA-binding antibody responses; the key difference was nAb versus non-nAb responses. We explored the immunological barriers to HIV nAb responses by combining a suite of techniques, including longitudinal lymph node fine needle aspirates. Unexpectedly, nAb development best correlated with booster immunization GC B cell magnitude and Tfh characteristics of the Env-specific CD4 T cells. Notably, these factors distinguished between successful and unsuccessful antibody responses because GC B cell frequencies and stoichiometry to GC Tfh cells correlated with nAb development, but did not correlate with total Env Ab binding titers.

Keywords: vaccines.


Figures

Figure 1
Figure 1. Generation of autologous neutralizing antibodies by immunization with BG505 SOSIP.v5.2
A. Schematic timeline of the BG505 SOSIP.v5.2 immunization study. Nx = necropsy. B. BG505 (N332) nAb titers, wk 20. Average from two independent assays. Different adjuvants are indicated by blue and red. C. BG505 Env ELISA titers. Vertical lines = immunization dates. D. BG505 neutralization titers (wk 20) compared to BG505 trimer binding IgG titers (week 20). E. BG505 neutralization titers compared to Tier 1 neutralization titers of SF162 (left) or MN.3 (right). F. Ratio of BG505 trimer binding titers to V3 peptide titers 2 wks post 3rd or 4th immunization. See also Figure S1 and Table S1.
Figure 2
Figure 2. FNAs monitor GC activity in draining lymph nodes
A. Cell recovery from LN FNAs (n = 24). B. Flow cytometry from LN FNA samples gated on GC B cells among CD20+ B cells (left) or GC Tfh cells among CD4+ T cells (right). C. Experimental group design. Bx = whole LN biopsy. D. GC B cell frequency in whole LN biopsies, 3 wk post 4th immunization (n = 12 per group). LN were either previously sampled by FNA (group 1) or not (group 2). E. GC Tfh cell frequency in whole LN biopsies, 3 wks post 4th immunization (n = 12 per group). LN were either previously sampled by FNA (group 1) or not (group 2). F. BG505 SOSIP.v5.2 ELISA titers at wk 0 and wk 14 for animals that had undergone previous LN FNAs (group 1) or not (group 2). G. Percentage of cells sampled per LN by FNA (n = 24). H. GC B cell frequency determined from FNA or whole LN biopsy (n = 24). Each point represents an individual LN sampled by FNA and then by whole LN biopsy. I. GC Tfh cell frequency, as in panel H. See also Figure S2.
Figure 3
Figure 3. Priming protein immunization generates massive GC responses
Analysis of GC LN cells from three groups of RMs: 1) unimmunized (‘none’); 2) injected with only PLGA(MPL+R848) (‘adjuvant only’); 3) immunized with either BG505 SOSIP.v5.2 + PLGA(MPL+R848) or BG505 SOSIP.v5.2 + Iscomatrix (‘adjuvant + BG505 SOSIP’). A. GC Tfh cells, as % of CD4+ T cells. B. GC B cells, as % of CD20+ B cells. C. Correlation of GC B cell and GC Tfh frequencies in draining LNs after the 1st immunization. See also Figure S3.
Figure 4
Figure 4. Longitudinal monitoring of GC responses
A. Frequency of GC B cells in draining LNs 3 wks post 2nd immunization (wk 9) compared to matched LNs from unimmunized RMs (‘none’). B. Frequency of GC Tfh cells, as per A. C. Frequency of GC B cells, as per A, with Wilcoxon matched pairs rank test. D. Frequency of GC Tfh cells, as per B, with Wilcoxon matched pairs rank test. E. GC B cell frequency (draining LNs at wk 3, average of Left and Right inguinal LN) compared to BG505 binding titers. F. GC Tfh cell frequency, as per E. G. BG505 Env-specific IgG+ plasmablasts in blood in RMs that did (2nd Imm) or did not receive the 2nd immunization. H. Longitudinal peak GC B cell frequencies in left (L) and right (R) draining inguinal LN from individual RMs, 3 wks after each of 4 immunizations. Blue indicates animals receiving PGLA adjuvant; red indicates animals receiving Iscomatrix adjuvant. I. Frequency of GC B cells (Left) and GC Tfh cells (Right) in draining LNs 3 wks post 3rd immunization (week 15) compared to matched LN from unimmunized RMs. J. As per I, 3 wks post 4th immunization (week 21). K. GC B cells in LNs plotted by time since most recent immunization. See also Figure S3.
Figure 5
Figure 5. Env-specific Tfh responses in LN
A. Env-specific GC Tfh cells (CXCR5hi PD-1hi) in draining LNs by AIM assay. CD25+OX40+ cells are gated of GC Tfh cells after stimulation (BG505 Env or SEB) or left unstimulated (—). Representative flow cytometry plots are shown. B. Env-specific GC Tfh in draining LN 3 wks post 2nd, 3rd, and 4th immunizations. Dotted line indicates positive signal threshold. C. Total Env-specific CD4 T cells in draining LNs by the AIM assay. CD25+OX40+ cells are gated from total CD4+ T cells after stimulation (BG505 Env or SEB) or left unstimulated (—). Representative flow cytometry plots are shown. D. Total Env-specific CD4 T cells in the draining LN 3 wks after the 2nd, 3rd, and 4th immunizations. Dotted line indicates positive signal threshold.
Figure 6
Figure 6. GC B cell relationships to autologous nAbs and longitudinal sequencing analysis of clonal lineages and affinity maturation identified in LN FNAs of BG505 SOSIP.v5.2 immunized RMs
A. GC B cells post 3rd and 4th immunizations compared against BG505 neutralization titer. Each point represents the average of four GC B cell measurements (2 draining LNs at 2 time points) for an individual animal. Longitudinal GC B cell data was only acquired from the eight RM undergoing FNA analysis. Neutralizing titers are log transformed values. B. GC B cell frequencies in draining LNs after each immunization for Top neutralizers (red) and non/low neutralizers (black). Points represent individual LNs. Dotted line indicates the mean frequency of GC B cells in unimmunized RM LNs. C. The top 50 largest clonal lineages from two representative BG505 SOSIP.v5.2 immunized RMs. LN BCR sequences from Top neutralizer RJk15 (left) and non-neutralizer RUj15 (right). Each BCR lineage is a separate horizontal bar. Frequency of the lineage sequences found in each LN at each time point are demarcated. Colors correspond to specific LNs at specific time points. Blue = left inguinal LN. Burgundy = right inguinal LN. Colors progress from light to dark over time (3 wks to 21wks). The color key is shared with panel D. Boxes to the right of each chart tabulate recurrent lineages in multiple LNs (gray), lineages present in both left and right LNs (dark gray), and lineages with ‘winner’ (increasing frequencies over subsequent immunizations; orange), ‘extreme winner’ (greater than 90% of all sequence was found after the final immunization; yellow) and ‘loser’ (decreasing frequencies over subsequent immunizations; purple) distributions. For shared representation between R-ILN and L-ILN a cutoff of 1% was used. D. A BG505 HIV Env trimer-specific LN B cell BCR sequence lineage tree from top neutralizer animal, ROp15. The tree is rooted to the most related germline sequence, positioned in the upper left. 884 sequences (centroids, each shown as a branch) are shown. The closest branches to the sequences of the BG505 SOSIP.v5.2 binding B cell found in the blood/spleen are indicated by asterisks. See also Figure S4 and S5.
Figure 7
Figure 7. GC Tfh cell quality is associated with autologous nAb
A. GC B cell:GC Tfh cell ratio in top neutralizers (red) versus non/low neutralizers (black) [after the 4th immunization]. Each point represents an individual LN. The best-fit linear correlations were constrained to pass through the origin. The slopes (m) for each line were found to be significantly different (F test, p = 0.0076). B. Quantitation of GC B cell to GC Tfh cell ratio after the fourth immunization from RM neutralizer groups. Points represent individual LNs, bars indicates medians. C. Representative flow cytometry plots of AIM+ (CD25+ Ox-40+) Env-specific CD4 T cells in PBMCs, one week after the 4th immunization. D. Quantitation of Env-specific CD4 T cell responses in PBMCs of immunized RMs. Cells from unimmunized RMs were used as controls. E. RNA-seq analysis of Env-specific CD4 T cells, comparing gene expression of top neutralizer and non-neutralizer RMs. Four Tfh-associated genes are highlighted (CD40LG, IL21, ICOS, and IL12Rb1). F. RNA-seq counts of genes of interest from Env-specific CD4 T cells. Top, and Non/Low neutralizing groups are shown. Four Tfh-associated genes (CD40LG, IL21, ICOS, and IL-12Rb1) and a control gene (YWHAZ) are shown. Bars indicate median values. Average counts are plotted for samples where the RNAseq was repeated. One-way Mann-Whitney p values are shown. See also Figure S6 and Table S2.

Comment in

References

    1. Burton DR, Hangartner L. Broadly Neutralizing Antibodies to HIV and Their Role in Vaccine Design. Annu. Rev. Immunol. 2016;34:635–659. - PMC - PubMed
    1. Burton DR, Mascola JR. Antibody responses to envelope glycoproteins in HIV-1 infection. Nat Immunol. 2015;16:571–576. - PMC - PubMed
    1. Cohen K, Altfeld M, Alter G, Stamatatos L. Early preservation of CXCR5+ PD-1+ helper T cells and B cell activation predict the breadth of neutralizing antibody responses in chronic HIV-1 infection. J. Virol. 2014;88:13310–13321. - PMC - PubMed
    1. Corti D, Lanzavecchia A. Broadly neutralizing antiviral antibodies. Annu. Rev. Immunol. 2013;31:705–742. - PubMed
    1. Crotty S. Follicular helper CD4 T cells (TFH) Annu. Rev. Immunol. 2011;29:621–663. - PubMed

Publication types

Substances

LinkOut - more resources