. 2016 Nov 22;17(9):2286-2298.
doi: 10.1016/j.celrep.2016.10.080.

LYVE1 Marks the Divergence of Yolk Sac Definitive Hemogenic Endothelium from the Primitive Erythroid Lineage

Affiliations

LYVE1 Marks the Divergence of Yolk Sac Definitive Hemogenic Endothelium from the Primitive Erythroid Lineage

Lydia K Lee et al. Cell Rep. .

Abstract

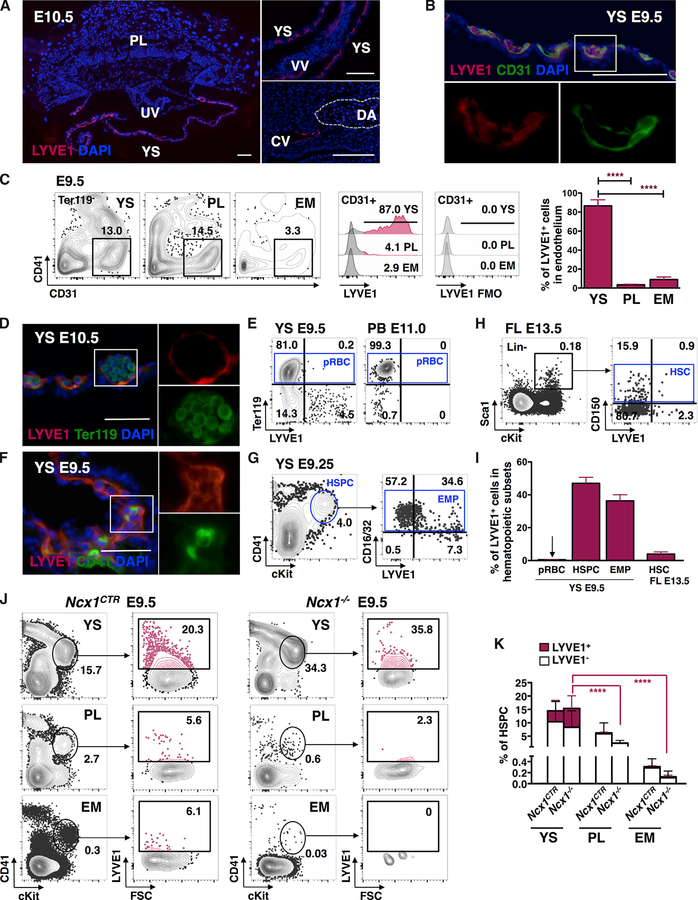
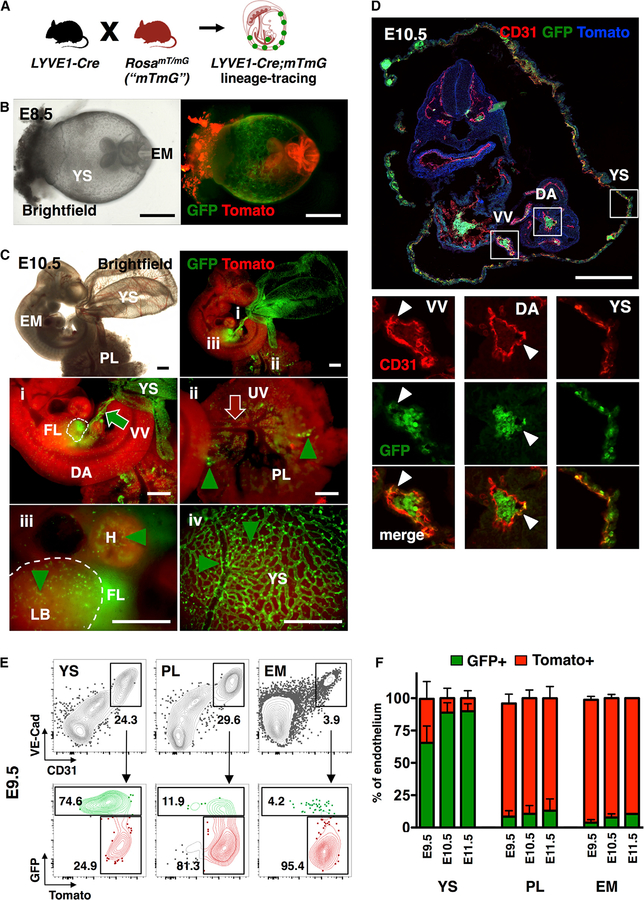
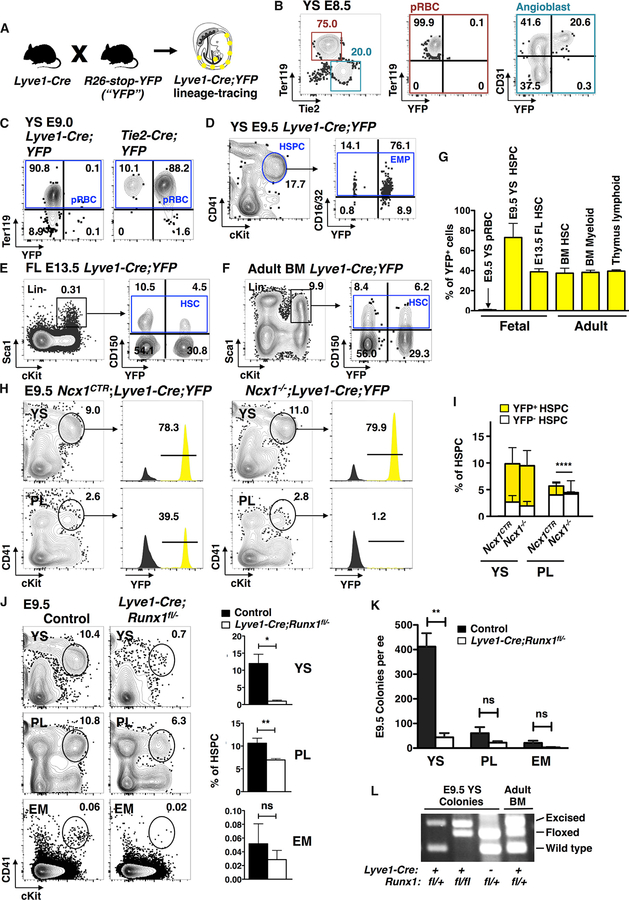
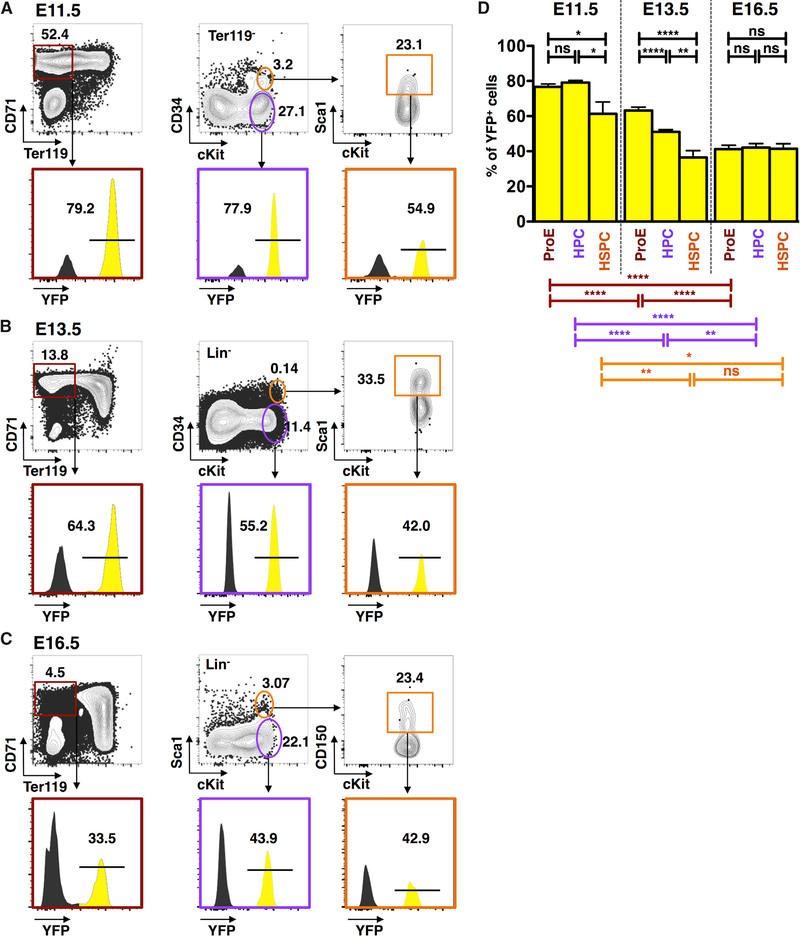
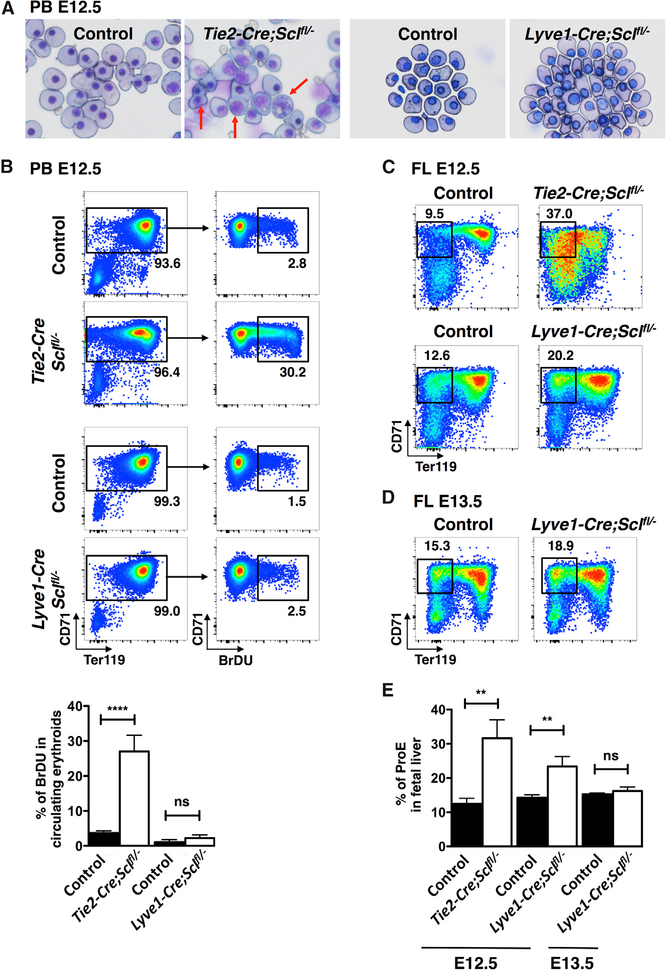
The contribution of the different waves and sites of developmental hematopoiesis to fetal and adult blood production remains unclear. Here, we identify lymphatic vessel endothelial hyaluronan receptor-1 (LYVE1) as a marker of yolk sac (YS) endothelium and definitive hematopoietic stem and progenitor cells (HSPCs). Endothelium in mid-gestation YS and vitelline vessels, but not the dorsal aorta and placenta, were labeled by Lyve1-Cre. Most YS HSPCs and erythro-myeloid progenitors were Lyve1-Cre lineage traced, but primitive erythroid cells were not, suggesting that they represent distinct lineages. Fetal liver (FL) and adult HSPCs showed 35%-40% Lyve1-Cre marking. Analysis of circulation-deficient Ncx1-/- concepti identified the YS as a major source of Lyve1-Cre labeled HSPCs. FL proerythroblast marking was extensive at embryonic day (E) 11.5-13.5, but decreased to hematopoietic stem cell (HSC) levels by E16.5, suggesting that HSCs from multiple sources became responsible for erythropoiesis. Lyve1-Cre thus marks the divergence between YS primitive and definitive hematopoiesis and provides a tool for targeting YS definitive hematopoiesis and FL colonization.

Keywords: LYVE1; definitive hematopoiesis; fetal liver; hemogenic endothelium; lineage tracing; primitive hematopoiesis; yolk sac.


Figures

Figure 1.
Figure 1.. LYVE1 Protein Is Expressed in Yolk Sac Endothelium and Hematopoietic Stem and Progenitor Cells
(A) LYVE1 protein is detected by IF in E10.5 YS, vitelline vessels (VVs), and the cardinal vein (CV), but is absent from the PL, umbilical vessels (UVs), and DA. Representative images from three independent experiments. Scale bar, 100 μm. (B) IF staining shows co-localization of LYVE1 in E9.5 YS CD31+ endothelium. Representative image from three independent experiments. Scale bar, 100 μm. (C) FACS analysis of CD31+CD41Ter119 endothelium in YS, PL, and caudal half of the EM of one representative E9.5 conceptus. Corresponding histograms of LYVE1+ endothelial cells show robust LYVE1 expression in YS endothelium only. Data from n = 11 from three independent experiments are represented as mean ± SD; ***P ≤ 0.001. (D) LYVE1 protein is not discernible by IF in Ter119+ primitive erythroid cells in E10.5 YS. Representative image from two independent experiments is shown. Scale bar, 50 μm. (E) Representative FACS plots indicate that Ter119+ primitive erythroid cells (pRBCs) do not express LYVE1 in E9.5 YS or E11.0 peripheral blood (PB). (F) IF staining of E9.5 YS shows co-expression of LYVE1 protein with HSPC marker CD41. Representative image from three independent experiments is shown. Scale bar, 50 μm. (G) Representative FACS plots show LYVE1 expression in CD41midcKit+Ter119 HSPCs and its subset, CD16/32+ EMPs in E9.25 YS. (H) Representative FACS plots of E13.5 FL document minimal LYVE1 expression in LinSca1+cKit+ CD150+ HSC compartment. (I) LYVE1 expression is prominent in mid-gestation YS HSPCs and EMPs. Data from n = 8, three independent experiments for YS pRBC; n = 28,10 independent experiments for YS HSPC; n = 8, three independent experiments for YS EMP; and n = 6, two independent experiments for FL HSC subset are shown as mean ± SD. (J) Representative FACS plots of hemogenic tissues in Ncx1−/− E9.5 concepti demonstrate the enrichment of LYVE1-expressing CD41midcKit+Ter119 HSPCs in the YS. (K) Significantly higher HSPC fraction in the YS than in the PL or EM expresses LYVE1 protein in Ncx1−/− concepti. Quantification of n = 23 for control and n = 11 for Ncx1−/− from five independent experiments is represented as mean ± SD. p values refer to the difference between LYVE1+ fractions; ****P ≤ 0.0001. See also Figure S1 and Table S1.
Figure 2.
Figure 2.. Lyve1-Cre Labels Yolk Sac Endothelium and Vitelline Vessels
(A) Schematic of mouse model for tracing Lyve1-Cre lineage cells using the RosamT/mG reporter line. (B) Brightfield and whole mount fluorescence microscopy images of Lyve1-Cre;mTmG E8.5 concepti show the replacement of Tomato (red) by GFP (green) expression in the YS. Representative image from n = 8 concepti from two independent experiments. Scale bar, 500 μm. (C) Brightfield and whole mount fluorescence microscopy images of YS, EM, and PL at E10.5. (i) shows GFP expression in the fetal liver (FL; dashed outline) and the vitelline vessels (VV; green arrow). (ii) shows intact Tomato activity in PL and umbilical vessels (UV; red arrow) and in the dorsal aorta (DA). GFP+ hematopoietic cells (green arrowheads) are found in PL vasculature (ii), heart (H) and limb bud (LB; dashed outline) (iii), and YS (iv). GFP expression is prominent throughout YS vasculature (iv). Representative image of n = 18 embryos from three independent experiments. Scale bar, 500 μm. (D) At E10.5, GFP labeling is widespread in YS and VV CD31+ endothelium, but minimal in the DA. Representative image from two independent experiments. Scale bar, 250 μm. (E) Representative FACS plots of GFP labeling of VE-Cad+CD31+ endothelial cells in E9.5 YS, PL, and caudal half of the EM. (F) Bar graphs of endothelial cells show robust Lyve1-Cre lineage tracing in YS at E9.5–E11.5. EM refers to the caudal half of the embryo at E9.5 and the aorta-gonad-mesonephros region at E10.5 and E11.5. Data are from pools of embryos from three (E9.5), seven (E10.5), and three (E11.5) independent experiments and are represented as mean ± SD. See also Table S1.
Figure 3.
Figure 3.. Lyve1-Cre Targets Yolk-Sac-Definitive Hematopoiesis
(A) Schematic of mouse model for tracing Lyve1-Cre-marked cells using the R26-stop-YFP reporter. (B) Representative FACS plots of E8.5 conceptus show Lyve1-Cre;YFP labeling in Tie2+CD31+ angioblasts, but not in Ter119+ primitive erythroid cells (pRBCs). (C) Representative FACS plots of E9.0 YS demonstrate labeling of Ter119+ pRBC by Tie2-Cre, but not by Lyve1-Cre. (D) Representative FACS plots of E9.5 YS demonstrate labeling of YS CD41midcKit+Ter119 HSPCs and CD16/32+ EMPs by Lyve1-Cre. (E and F) Representative FACS plots display similar YFP marking in the LinSca1+cKit+CD150+ HSC of E13.5 FL (E) and 8-month-old adult BM (F). (G) Quantification shows a contrast of YFP marking between pRBCs (n = 4, two independent experiments) and YS HSPCs (n = 15, 7 independent experiments). Lyve1-Cre marking in E13.5 FL LinSca1+cKit+CD150+ HSCs (n = 15, 4 independent experiments) is similar to 8-month-old adult BM HSCs, BM Mac1+Gr1+ myeloid cells (n = 8, two independent experiments), and thymus CD4+CD8+ T lymphocytes (n = 7, two experiments). No comparison of marking between populations yielded statistical difference. Data are represented as mean ± SD. (H) Representative FACS plots of E9.5 Lyve1-Cre;YFP Ncx1−/− concepti show preservation of YFP+ HSPCs in the YS but near depletion in the PL when blood circulation is absent. (I) Quantification of YFP+ fraction in HSPCs of E9.5 Ncx1−/− concepti with impaired circulation. Data from n = 16 for Ncx1CTR and n = 5 for Ncx1−/− from three independent experiments are represented as mean ± SD; **p value of the difference in YFP+ fractions at ≤ 0.01. (J) Representative FACS plots and quantification of HSPCs in hemogenic organs of E9.5 LYve1-Cre;Runx1fl/− tissues show depletion of HSPCs from the YS upon conditional deletion of Runx1 in LYVE1 lineage cells. The loss in HSPCs is partial in the PL and insignificant in the EM. Data from n = 4 for mutants and n = 9 for controls from three independent experiments are represented as mean ± SD. p values are shown as ns if > 0.05; *P ≤ 0.05; **P ≤ 0.01. (K) Quantification of myelo-erythroid colonies per embryo equivalent (ee) from each organ. Data from n = 4 for mutants and n = 3 for controls from two independent experiments are represented as mean ± SD. (L) Genotyping of Runx1 alleles in representative colonies. See also Figure S2 and Table S1.
Figure 4.
Figure 4.. Progenitors of Lyve1-Cre Lineage Initiate Fetal Liver Hematopoiesis
(A) Representative FACS plots of Lyve1-Cre marking in hematopoietic subpopulations in one representative E11.5 FL: Ter119 CD71+ proerythroblasts (ProEs), Ter119cKit+ HPCs, and Ter119CD34+cKit+Sca1+ HSPCs. (B) Representative FACS plots of FL subsets at E13.5. (C) Representative FACS plots of FL subsets at E16.5. (D) Comparative analysis of E11.5, E13.5, and E16.5 FL illustrates a shift in hematopoietic populations derived from the Lyve1-Cre lineage. Data from n = 9, three independent experiments for E11.5, n = 18, three independent experiments for E13.5, and n = 13, two independent experiments for E16.5, are represented as mean ± SD. p values are shown as ns if > 0.05; *P ≤ 0.05; **P ≤ 0.01; ***P ≤ 0.001; ****P ≤ 0.0001. See also Table S1.
Figure 5.
Figure 5.. Lyve1-Cre Targets Early Fetal Liver Definitive Hematopoiesis
(A) May-Grunwald Giemsa stain of E12.5 peripheral blood (PB) shows primitive erythroid defects in Tie2-Cre;Sclfl/− blood cells (arrows), but not in Lyve1-Cre;Sclfl/− blood. Representative images from three independent experiments are shown. (B) Representative FACS plots of BrDU staining of E12.5 PB illustrate excessive proliferative activity in Tie2-Cre;Sclfl/− primitive erythroid cells, but not in Lyve1-Cre;Sclfl/− cells. Bar graphs from n = 22 controls and n = 4 knockouts from three independent Tie2-Cre;Sclfl/− experiments and n = 6 controls and n = 3 knockouts from two independent Lyve1-Cre;Sclfl/− experiments are shown as mean ± SD. (C) E12.5 FLs from both Tie2-Cre;Sclfl/− (upper panel) and Lyve1-Cre;Sclfl/− (lower panel) embryos exhibit accumulation of proerythroblasts (ProEs). (D) At E13.5, the defect in ProE fraction in Lyve1-Cre;Sclfl/− FL has corrected. (E) Quantification of ProE fractions in E12.5 and E13.5 FL. Data from n = 2 (E12.5 Tie2-Cre;Sclfl/−) and n = 6 (control), n = 3 (E12.5 Lyve1-Cre;Sclfl/−) and n = 7 (control), and n = 4 (E13.5 Lyve1-Cre; Sclfl/−) and n = 14 (control) from two independent experiments for each genotype and age are shown as mean ± SD. See also Table S1.

Similar articles

Cited by

References

    1. Banerji S, Ni J, Wang SX, Clasper S, Su J, Tammi R, Jones M, and Jackson DG (1999). LYVE-1, a new homologue of the CD44 glycoprotein, is a lymph-specific receptor for hyaluronan. J. Cell Biol. 144, 789–801. - PMC - PubMed
    1. Beerman I, Bhattacharya D, Zandi S, Sigvardsson M, Weissman IL, Bryder D, and Rossi DJ (2010). Functionally distinct hematopoietic stem cells modulate hematopoietic lineage potential during aging by a mechanism of clonal expansion. Proc. Natl. Acad. Sci. USA 107, 5465–5470. - PMC - PubMed
    1. Benz C, Copley MR, Kent DG, Wohrer S, Cortes A, Aghaeepour N, Ma E, Mader H, Rowe K, Day C, et al. (2012). Hematopoietic stem cell subtypes expand differentially during development and display distinct lymphopoietic programs. Cell Stem Cell 10, 273–283. - PubMed
    1. Bertrand JY, Chi NC, Santoso B, Teng S, Stainier DY, and Traver D (2010). Haematopoietic stem cells derive directly from aortic endothelium during development. Nature 464, 108–111. - PMC - PubMed
    1. Boisset JC, van Cappellen W, Andrieu-Soler C, Galjart N, Dzierzak E, and Robin C (2010). In vivo imaging of haematopoietic cells emerging from the mouse aortic endothelium. Nature 464, 116–120. - PubMed

Publication types