. 2016 Nov 3;167(4):1028-1040.e15.
doi: 10.1016/j.cell.2016.10.005. Epub 2016 Oct 27.

Structure of the MIS12 Complex and Molecular Basis of Its Interaction with CENP-C at Human Kinetochores

Affiliations

Structure of the MIS12 Complex and Molecular Basis of Its Interaction with CENP-C at Human Kinetochores

Arsen Petrovic et al. Cell. .

Abstract

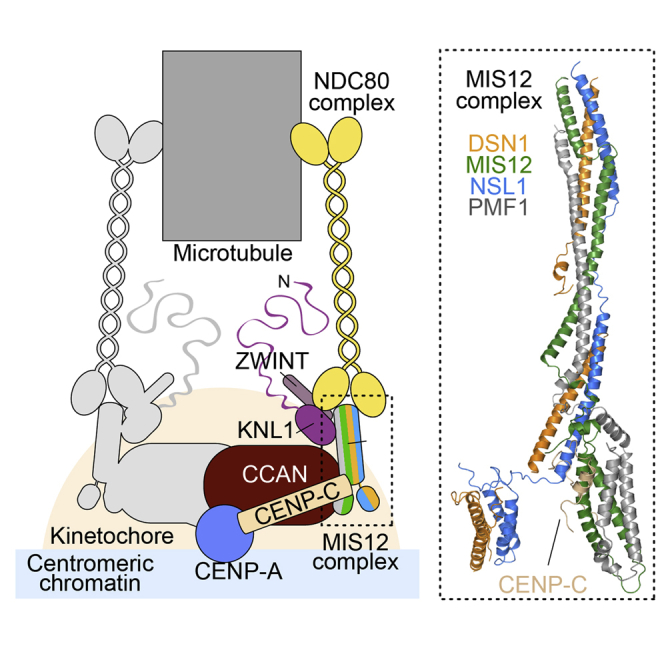
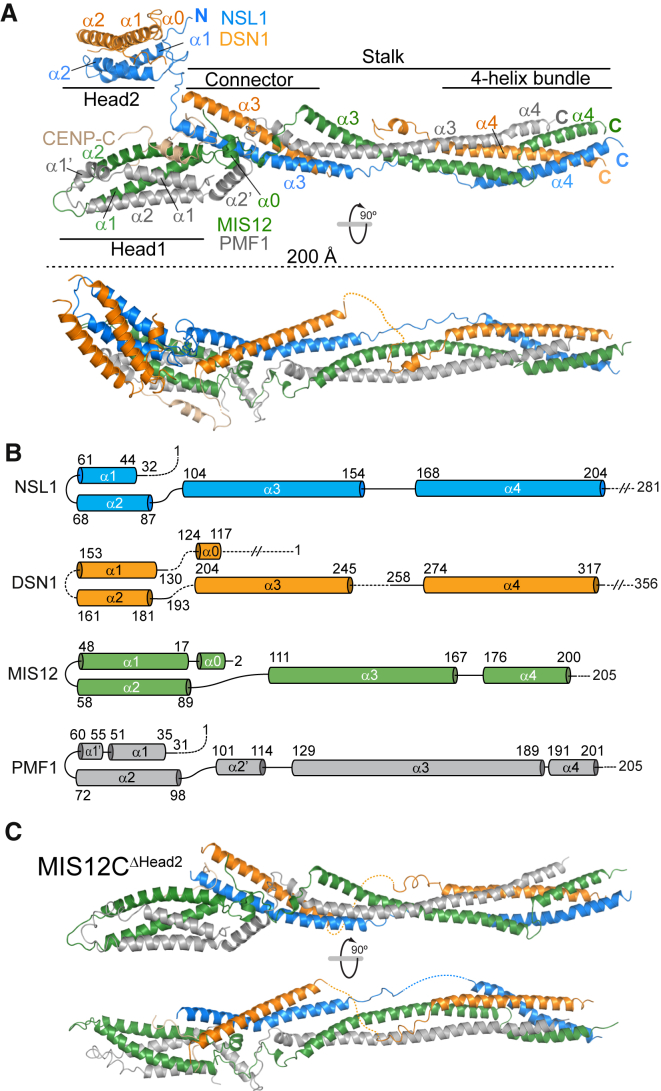
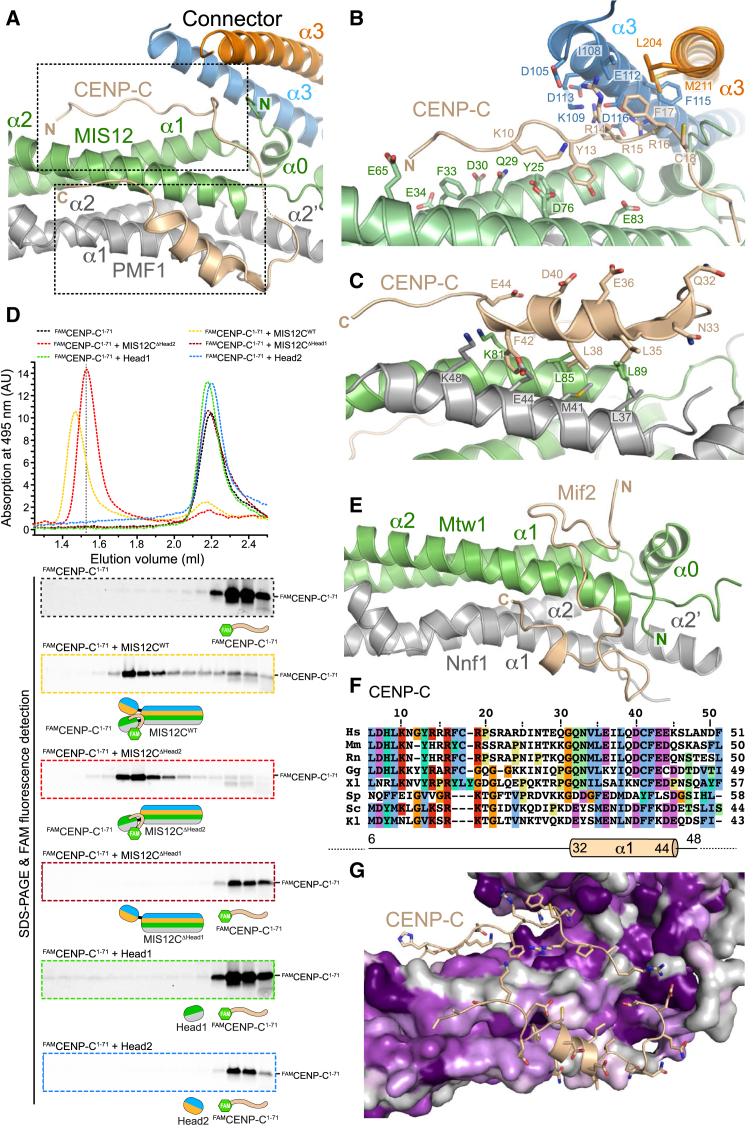
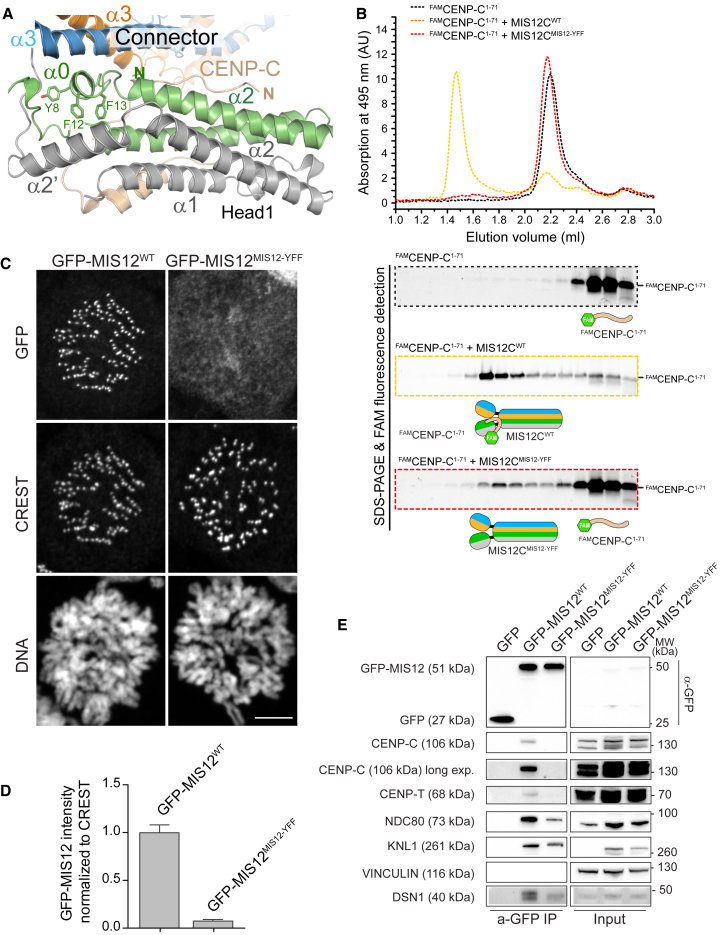
Kinetochores, multisubunit protein assemblies, connect chromosomes to spindle microtubules to promote chromosome segregation. The 10-subunit KMN assembly (comprising KNL1, MIS12, and NDC80 complexes, designated KNL1C, MIS12C, and NDC80C) binds microtubules and regulates mitotic checkpoint function through NDC80C and KNL1C, respectively. MIS12C, on the other hand, connects the KMN to the chromosome-proximal domain of the kinetochore through a direct interaction with CENP-C. The structural basis for this crucial bridging function of MIS12C is unknown. Here, we report crystal structures of human MIS12C associated with a fragment of CENP-C and unveil the role of Aurora B kinase in the regulation of this interaction. The structure of MIS12:CENP-C complements previously determined high-resolution structures of functional regions of NDC80C and KNL1C and allows us to build a near-complete structural model of the KMN assembly. Our work illuminates the structural organization of essential chromosome segregation machinery that is conserved in most eukaryotes.

Keywords: CCAN; CENP-C; DSN1; KMN network; MIND; Mis12; NSL1; PMF1; centromere; kinetochore.


Figures

None
Graphical abstract
Figure 1
Figure 1
Structure of MIS12C:CENP-C (A) Cartoon diagrams of the MIS12CNano:CENP-C1–71 complex (Table S1B) in two orientations. The main structural domains discussed in the text are indicated. The molecular models in this and subsequent figures were generated with PyMOL. The final model contains residues 2–200 of MIS12, 31–203 of PMF1, 32–204 of NSL1, 116–155, 159–193, 203–245, and 258–317 of DSN1. (B) Topology diagrams of the MIS12C subunits. (C) Cartoon diagrams of the MIS12CΔHead2:CENP-C1–71 complex. The coloring scheme of subunits is as for the MIS12Nano complex shown in (A). See also Figures S1 and S2.
Figure 2
Figure 2
Dissection of MIS12:CENP-C (A) Cartoon model of the interaction of CENP-C1–71 with Head1 and the Connector. Two boxed areas are enlarged in (B) and (C). (B) Focus on the N-terminal segment of CENP-C (residues 6–22), with a subset of side chains of residues at the interface. (C) Focus on the amphipathic helix of the CENP-C chain (residues 32–44). (D) SEC analysis of the indicated MIS12C constructs and FAMCENP-C1–71. Protein absorption at 280 nm (Figure S3) and FAM absorption at 495 nm (shown) were measured. SEC fractions were analyzed by SDS-PAGE and visualized by Coomassie staining (Figure S3) or FAM fluorescence (shown). A shift to the left in the elution profiles of FAMCENP-C1–71 indicates binding to MIS12C. A dotted vertical line indicates elution volume of the MIS12CΔHead1 mutant. (E) Cartoon model of Kluyveromyces lactis MIND Head1 bound to Mif2 (Dimitrova et al., 2016). Mtw1 and Nnf1 are MIS12 and PMF1 orthologs, respectively. See Figure S4 for additional structural details. (F) Sequence alignment of the N-terminal region of CENP-C orthologs. Hs, Homo sapiens; Mm, Mus musculus; Rn, Rattus norvegicus; Gg, Gallus gallus; Xl, Xenopus laevis; Sp, Schizosaccharomyces pombe; Sc, Saccharomyces cerevisiae; Kl, Kluyveromyces lactis. The alignment was obtained with MAFFT (Katoh and Standley, 2013). (G) Sequence conservation in the CENP-C binding region mapped onto the MIS12C structure. Conservation scores were calculated based on sequences from Homo sapiens, Bos taurus, Ovis aries, Ornithorhynchus anatinus, Gallus gallus, Pseudopodoces humilis, Python bivittatus, Gekko japonicus, Xenopus laevis, Danio rerio, Drosophila busckii, Drosophila melanogaster, Saccharomyces cerevisiae, Kluyveromyces lactis, and Schizosaccharomyces pombe. Sequence conservation is color coded from purple (indicates conserved amino acid positions) to gray (indicates variable amino acid positions).
Figure 3
Figure 3
Role of the MIS12 α0 Helix in CENP-C Binding (A) Role of three conserved aromatic residues in the α0 helix of MIS12. (B) The interaction of MIS12CYFF with FAMCENP-C1–71 was analyzed by SEC. Control profiles for MIS12CWT:FAMCENP-C1–71 is the same already shown in Figure 2D. The elution profile of MIS12CWT is shown in Figure S4A. Data for absorption at 280 nm and Coomassie staining of SDS-PAGE are shown in Figure S3. (C) Representative images of stable Flp-In T-REx cells expressing the indicated GFP-MIS12 constructs, showing that the YFF mutant does not localize to kinetochores (CREST is an inner kinetochore marker). Scale bar, 10 μm. (D) Quantification of GFP-MIS12 kinetochore levels. The graph shows mean intensity from two independent experiments. Error bars represent SEM. Values for Mis12WT are set to 1. (E) Western blot of immunoprecipitates (IP) from mitotic Flp-In T-REx cell lines expressing the indicated GFP-Mis12 constructs. Vinculin was used as loading control. See also Figure S5.
Figure 4
Figure 4
Head1 and the Connector Promote CENP-C Binding (A) Fluorescence polarization experiments with a synthetic FAMCENP-C1–21 peptide (at 20 nM concentration). Increasing concentrations of the indicated MIS12C species were added and fluorescence polarization monitored at equilibrium. Data fitting was performed as described in the STAR Methods. Due to the very low binding affinity, binding data for the MIS12CMIS12-YFF and MIS12CNSL1-EDEAAA mutants were not fitted and appear therefore as disconnected points. (B) SEC profiles of the indicated mutant MIS12Cs incubated with FAMCENP-C1–71. Dotted vertical bars indicate elution volumes of MIS12CWT and FAMCENP-C1–71. (C) Representative images of stable Flp-In T-REx cells expressing the indicated GFP-MIS12 constructs and showing that the GFP-MIS12MIS12-4D/EA mutant is severely impaired in its localization to kinetochores. Scale bar, 10 μm. (D) Quantification of GFP-MIS12 kinetochore levels. The graph shows mean intensity from two independent experiments. Error bars represent SEM. Values for Mis12WT are set to 1. See also Figure S5.
Figure 5
Figure 5
Intramolecular Regulation of CENP-C Binding (A) Sequence motifs in DSN1 that are phosphorylated by Aurora B aligned with a segment in the N-terminal region of CENP-C. (B) Fluorescence polarization experiments were carried out as already shown in Figure 4A with the indicated MIS12C species. (C) Scheme detailing how Aurora B may regulate binding of CENP-C to MIS12C. (D) Fluorescence polarization experiments were carried out as already shown in (B) with the indicated MIS12C mutant complexes. See also Figure S6.
Figure 6
Figure 6
KMN Assembly and Wider Kinetochore Organization (A) Chimera (Pettersen et al., 2004) was used to fit model of MIS12C in a 3D negative stain EM map (EMD-2549) of a nine-subunit complex containing MIS12C, NDC80CBonsai, and the C-terminal RWD domains of KNL1 (Petrovic et al., 2014). (B) Sequence alignment of the SPC24:SPC24-binding region in the N-terminal region of CENP-T and of the C-terminal region of DSN1. (C) The C-terminal region of DSN1 downstream of the terminal part of the stalk domain was modeled on the structure of the SPC24:SPC25:CENP-T complex (PDB: 3VZA). The PVIHL motif is necessary for SPC24:SPC25 binding and is predicted to start a helical segment of NSL1. The chain then inverts direction to reach KNL1. The structure of the KNL1 RWD domains bound to the NSL1 C-terminal peptide (PDB: 4NF9) identifies the peptide at the junction between RWD domains (Petrovic et al., 2014). (D) The diagram illustrates the intermolecular cross-links connecting subunits in different KMN complexes (listed in part A of Table S2). (E) Schematic view of kinetochores drawn with “complexes” with realistic relative scales. The gray moiety may be generated by pseudo 2-fold symmetry of the CENP-A nucleosome (Weir et al., 2016). A ruler (in nanometers) was positioned along the inter-kinetochore axis. On the right, we indicate the coordinate along the inter-kinetochore axis of the centroid of a fluorescence signal associated with the indicated proteins (e.g., by fusion to GFP or through antibodies). The zero coordinate was arbitrarily assigned to CENP-IN (the N terminus of CENP-I) (Suzuki et al., 2014, Wan et al., 2009). See also Figure S6.
Figure S1
Figure S1
Organization of the KMN Network, Related to Figure 1 (A) Drawing of the KMN network and its interaction with CCAN. CH, Calponin-homology domain; RWD, RING finger, WD repeat, DEAD-like helicases. (B) Schematic representation of the organization of subunits of the KMN network and main functional domains; CC, coiled-coil; N, N-terminal tail (involved in microtubule binding); PEST, proline-glutamic-serine-threonine. The CENP-C motif and the central region of CENP-C contain conserved nucleosome binding motifs.
Figure S2
Figure S2
Electron Density Maps, Related to Figure 1 (A) Results of limited proteolysis experiment with Chymotrypsin at protease:substrate ratios similar to that used in crystallization experiment. The red numbers indicate the boundaries of the MIS12Nano construct (see Table S1). Black numbers indicate boundaries of protease-trimmed segments, shown in white. Some of the trimmed segments, however, were clearly visible in the crystal’s electron density, suggesting that proteolysis is less efficient in the crystallization buffer. See STAR Methods section ‘Crystal structure determination’ for additional details. (B and C) Snapshots of electron density for the MIS12C full length model. The shown map is an omit map, obtained with Phenix (Adams et al., 2010), contoured at 1 sigma (panel A) or at 1.5 sigma (panel B). In B, three Phe residues in the Phe-Phe-Gly-Phe motif of MIS12 are shown. The color scheme is the same already used in Figure 1. (D) Cartoon model of the MIS12C colored according to confidence of model building, from highest confidence (green) to medium (orange) to lowest (red). (E) Intra MIS12C cross-links, extracted from Tables S2 and S3, were mapped onto the final model of the MIS12C, and distances between Cα atoms of cross-linked lysines were tabulated. Cross-links were shown in black if the calculated distance between Cα atoms was compatible with formation of a cross-link, i.e., if it was less or equal to the combined length of the cross-linker (11.4 Å) and of two extended lysine side chains (∼6.3 Å, and therefore ∼24 Å in total). Two cross-links indicated in blue may reflect large-scale relative movements of Head2 and Head1 (possibly reflecting the Aurora B-regulated intra-molecular interaction). Only two cross-links (shown in brown) were inconsistent with the model, but they could reflect temporary fluctuations in the structure of the MIS12C. (F) Cartoon model of the Head2 structure in two orientations (Nsl1, blue; Dsn1, orange).
Figure S3
Figure S3
Further Comparison of MIS12C:CENP-C and MIND:Mif2, Related to Figure 2 (A and B) Cartoon diagrams of MIS12C:CENP-C and MIND:Mif2 (left and right, respectively) around Head1 and the CENP-C/Mif2 binding sites. Mif2 is shown here in yellow rather than wheat to facilitate interpretation of subsequent panels. The main chain of CENP-C resembles a “horseshoe.” Its first visible segment (residues 6-22) is extended and binds in a shallow groove between the α1 and α2 helices of MIS12 in Head1. Lys10CENP-C, Tyr13CENP-C, Arg14CENP-C, Arg16CENP-C, and Phe17CENP-C interact with residues in Head1 and with the N-terminal region of the α3 helices of DSN1:NSL1 (in the helical connector, see Figure 2B). Asp105Nsl1, Glu112Nsl1, and Asp113Nsl1 in the NSL1 α3 helix are very well conserved in evolution and interact with the side chains of Arg14CENP-C, Arg15CENP-C, and Arg16CENP-C. Lys10CENP-C and Tyr13CENP-C are necessary for tight binding of CENP-C to MIS12C (Screpanti et al., 2011). The CENP-C main chain takes a turn around residues Phe17CENP-C and Cys18CENP-C, moving away from the stalk in an extended and poorly conserved segment. Electron density for this segment of CENP-C is weak. The CENP-C chain bends again to complete its “U-turn” around residues 28-30, emerging in helical conformation (residues 32-44, Figure 2C). The CENP-C helix packs snugly against the groove between α1 of PMF1 and α2 of MIS12, and is amphipathic, with the side chains of Val 34CENP-C, Leu35CENP-C, Ile37CENP-C, Leu38CENP-C, Cys41CENP-C, and Phe42CENP-C pointing inward toward Head1, and those of Glu36CENP-C, Asp40CENP-C, and Glu44CENP-C, pointing outward. (C) Overall superposition of Head1 domains in the two structures demonstrates superposition of the CENP-C and Mif2 helical region, but not of the N-terminal regions. (D) Zoom-in view of the helical region highlighting the similarity of binding mode of CENP-C and Mif2 to Head1 domain. (E) Zoom-in view of the N-terminal regions of CENP-C and Mif2 demonstrates clustering of positively charged residues despite an overall different path of the polypeptide chains on the Head1 surface.
Figure S4
Figure S4
Size-Exclusion Chromatography Assays with SDS-PAGE, Related to Figure 2 (A–F) SEC elution profiles of the indicated species were monitored at 495 nm (to follow FAM absorption) and 280 nm (to follow general protein absorption). SDS-PAGE were analyzed for fluorescence (from FAMCENP-C1-71) and also stained with Coomassie Brilliant Blue to visualize all proteins.
Figure S5
Figure S5
Size-Exclusion Chromatography Assays with SDS-PAGE Loading Controls, Related to Figures 3 and 4 (A and C) SEC analysis of the indicated species with absorbance at 495 nm (to follow FAM absorption) and 280 nm (to follow general protein absorption). SDS-PAGE were analyzed for fluorescence (from FAMCENP-C1-71) and also stained with Coomassie Brilliant Blue to visualize all proteins. (B) Western blot of stable Flp-In T-REx cells expressing the indicated MIS12 constructs showing that expression levels of MIS12WT and MIS12CYFF are similar to one another. Vinculin was used as loading control.
Figure S6
Figure S6
Additional Binding Assays, Related to Figures 5 and 6 (A and C) SEC analysis of the indicated species with absorbance at 280 nm. SDS-PAGE were stained with Coomassie Brilliant Blue to visualize all proteins. (B) Fluorescence polarization experiments were carried out with a synthetic FAMCENP-C1-21 peptide and saturating concentrations of the indicated MIS12C species and polarization monitored at equilibrium (like in Figure 4A). Unlabeled CENP-C1-71 was added as positive control for competition at the indicated competitor concentration. Head2 had no effects as competitor even at high concentrations, suggesting that its intra-molecular interaction with Head1 is of very modest affinity.

Comment in

Similar articles

Cited by

References

    1. Adams P.D., Afonine P.V., Bunkóczi G., Chen V.B., Davis I.W., Echols N., Headd J.J., Hung L.W., Kapral G.J., Grosse-Kunstleve R.W. PHENIX: a comprehensive Python-based system for macromolecular structure solution. Acta Crystallogr. D Biol. Crystallogr. 2010;66:213–221. - PMC - PubMed
    1. Akiyoshi B., Nelson C.R., Biggins S. The aurora B kinase promotes inner and outer kinetochore interactions in budding yeast. Genetics. 2013;194:785–789. - PMC - PubMed
    1. Alushin G.M., Ramey V.H., Pasqualato S., Ball D.A., Grigorieff N., Musacchio A., Nogales E. The Ndc80 kinetochore complex forms oligomeric arrays along microtubules. Nature. 2010;467:805–810. - PMC - PubMed
    1. Barth T.K., Schade G.O., Schmidt A., Vetter I., Wirth M., Heun P., Thomae A.W., Imhof A. Identification of novel Drosophila centromere-associated proteins. Proteomics. 2014;14:2167–2178. - PubMed
    1. Bharadwaj R., Qi W., Yu H. Identification of two novel components of the human NDC80 kinetochore complex. J. Biol. Chem. 2004;279:13076–13085. - PubMed

Publication types

MeSH terms