. 2017 Jan 1;312(1):H150-H161.
doi: 10.1152/ajpheart.00737.2016. Epub 2016 Nov 23.

Hyperglycemia induces defective Ca2+ homeostasis in cardiomyocytes

Affiliations

Hyperglycemia induces defective Ca2+ homeostasis in cardiomyocytes

Andrea Sorrentino et al. Am J Physiol Heart Circ Physiol. .

Abstract

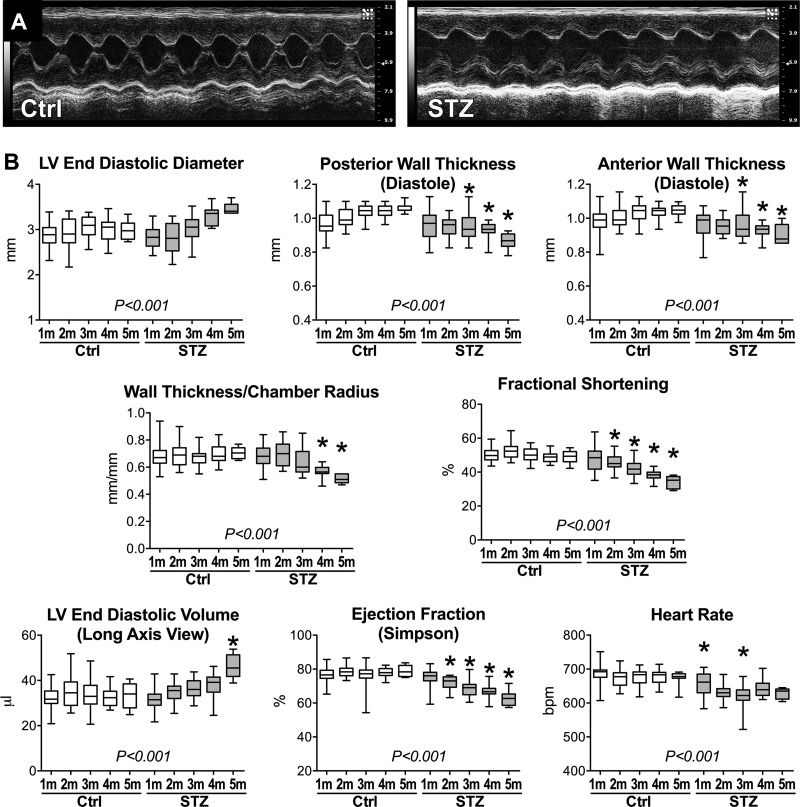
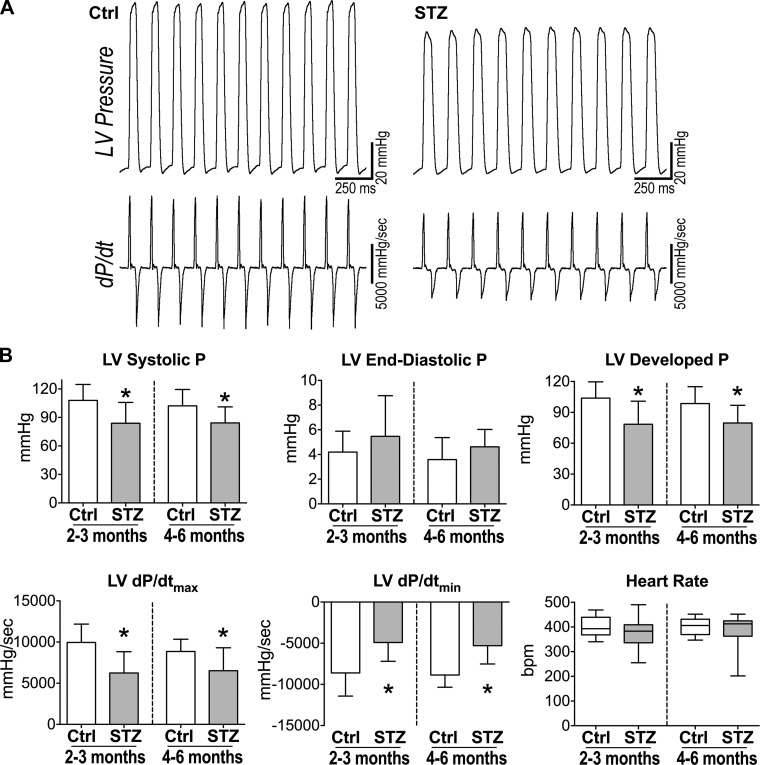
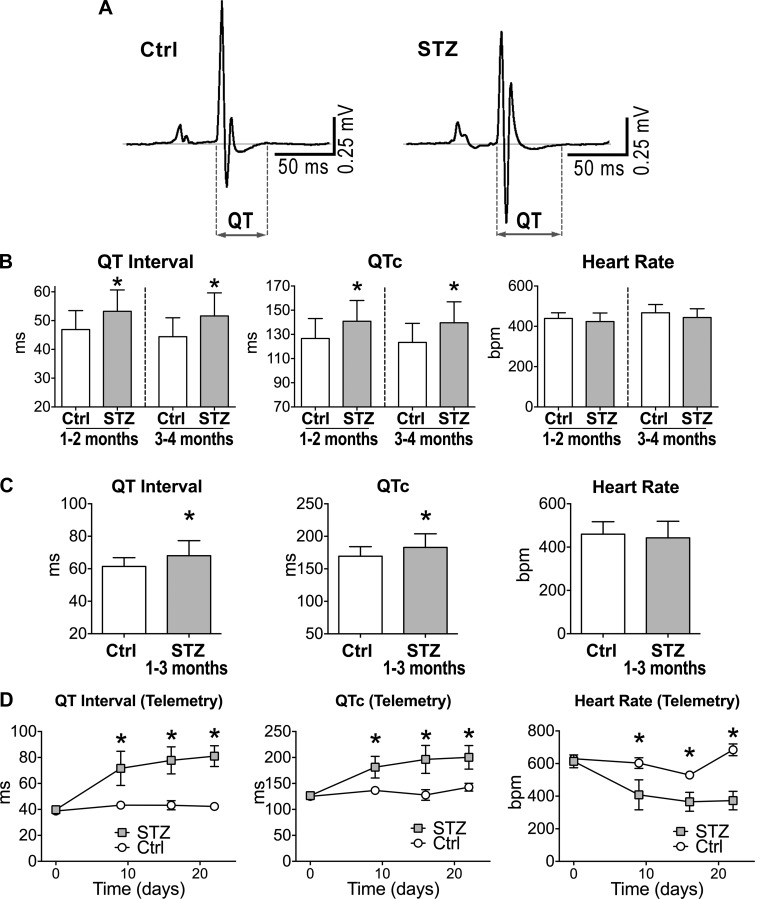
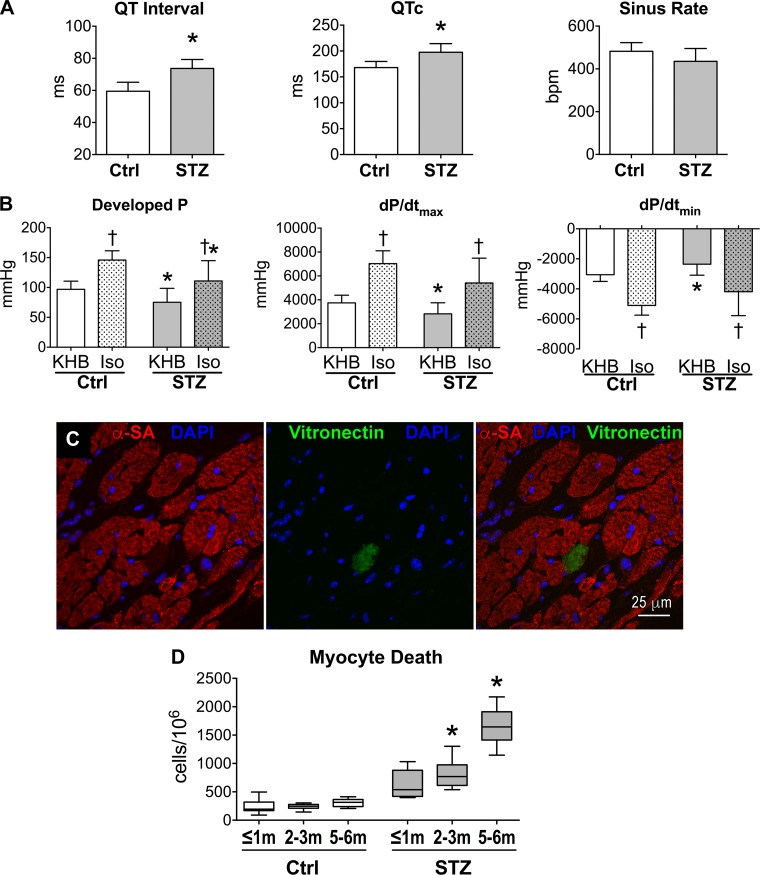
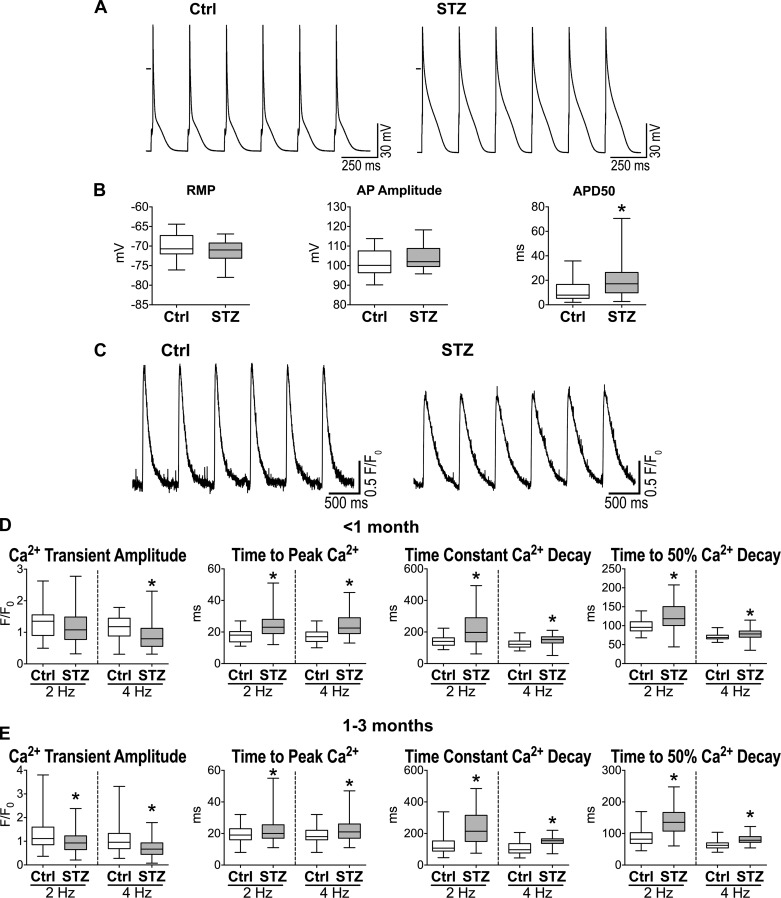
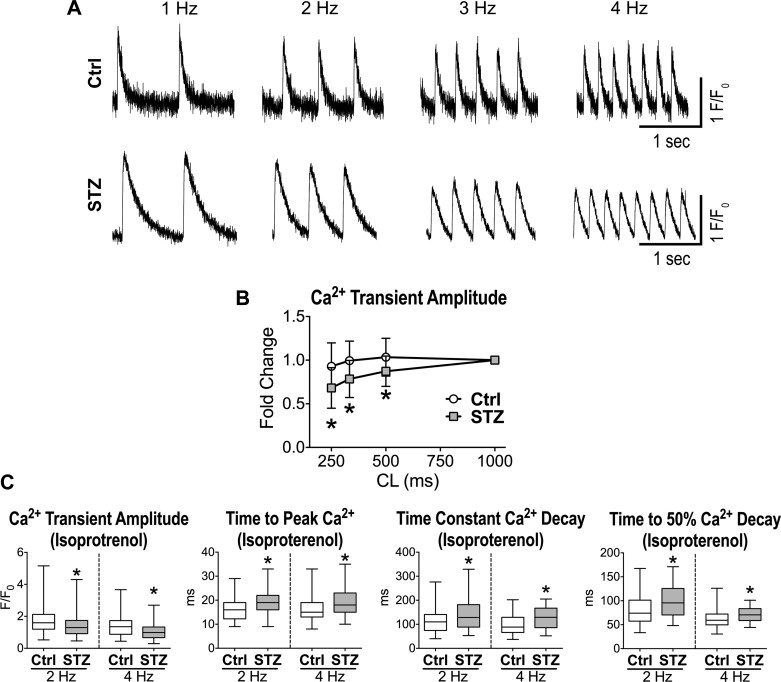
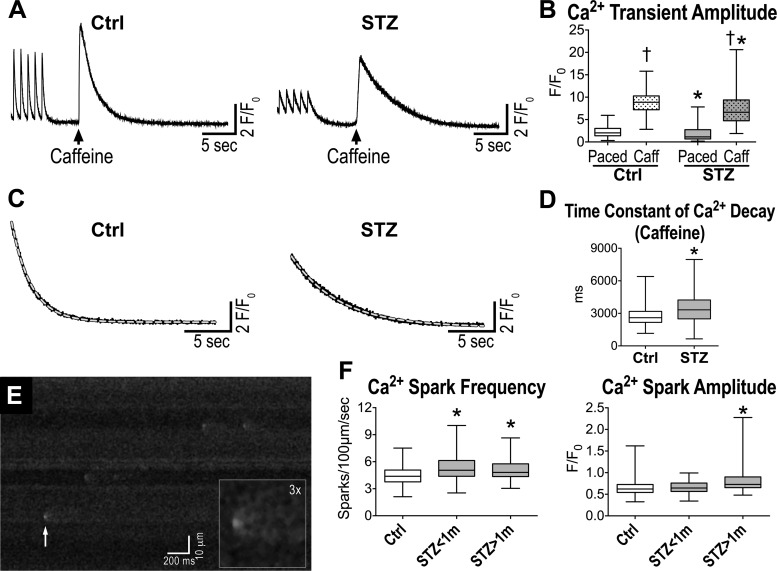
Diabetes and other metabolic conditions characterized by elevated blood glucose constitute important risk factors for cardiovascular disease. Hyperglycemia targets myocardial cells rendering ineffective mechanical properties of the heart, but cellular alterations dictating the progressive deterioration of cardiac function with metabolic disorders remain to be clarified. In the current study, we examined the effects of hyperglycemia on cardiac function and myocyte physiology by employing mice with high blood glucose induced by administration of streptozotocin, a compound toxic to insulin-producing β-cells. We found that hyperglycemia initially delayed the electrical recovery of the heart, whereas cardiac function became defective only after ~2 mo with this condition and gradually worsened with time. Prolonged hyperglycemia was associated with increased chamber dilation, thinning of the left ventricle (LV), and myocyte loss. Cardiomyocytes from hyperglycemic mice exhibited defective Ca2+ transients before the appearance of LV systolic defects. Alterations in Ca2+ transients involved enhanced spontaneous Ca2+ releases from the sarcoplasmic reticulum (SR), reduced cytoplasmic Ca2+ clearance, and declined SR Ca2+ load. These defects have important consequences on myocyte contraction, relaxation, and mechanisms of rate adaptation. Collectively, our data indicate that hyperglycemia alters intracellular Ca2+ homeostasis in cardiomyocytes, hindering contractile activity and contributing to the manifestation of the diabetic cardiomyopathy.

New & noteworthy: We have investigated the effects of hyperglycemia on cardiomyocyte physiology and ventricular function. Our results indicate that defective Ca2+ handling is a critical component of the progressive deterioration of cardiac performance of the diabetic heart.

Keywords: Ca2+ handling; diabetes; myocytes; ventricular function.


Figures

Fig. 1.
Fig. 1.
Cardiac function is progressively depressed with hyperglycemia. A: M-mode echocardiographic images for one naïve male FVB mouse control (Ctrl; left) and one streptozotocin (STZ)-treated male FVB mouse ~5 mo after induction of diabetes (right). LV, left ventricular. B: echocardiographic parameters obtained on a monthly basis in naïve male FVB mice (Ctrl, n = 46, 26, 28, 17, and 12 at 1, 2, 3, 4, and 5 mo, respectively) and STZ-treated male FVB mice (STZ, n = 50, 27, 25, 12, and 6 at 1, 2, 3, 4, and 5 mo after induction of diabetes, respectively) are shown as median and interquartile ranges. Analysis was performed in restrained, conscious mice. *P < 0.05 vs. Ctrl for the same time point using pairwise comparison. P < 0.001 refers to results of analysis of variance for multiple groups.
Fig. 2.
Fig. 2.
Chronic hyperglycemia results in depressed LV hemodynamics. A: LV pressure (P) and first derivative of LV pressure (dP/dt) measurements for one naïve male FVB mouse (Ctrl; left) and one STZ-treated male FVB mouse ~3 mo after induction of diabetes (right). B: hemodynamic parameters under isoflurane anesthesia for naïve male FVB mice (Ctrl, n = 13–15) and STZ-treated male FVB mice at 2 to 3 and 4–6 mo after diabetes (STZ, n = 15) are shown as means ± SE *P < 0.05 vs. Ctrl for the same time point.
Fig. 3.
Fig. 3.
Hyperglycemia prolongs cardiac electrical recovery. A: electrocardiograms (ECGs) obtained in one naïve male FVB mouse (Ctrl; left) and one STZ-treated male FVB mouse 49 days after induction of diabetes (right). B: electrocardiographic parameters under anesthesia for naïve male FVB mice (Ctrl, n = 26–28) and STZ-treated male FVB mice at 1 to 2 and 3 to 4 mo after induction of diabetes (STZ, n = 20–26) are shown as means ± SE *P < 0.01 vs. Ctrl for the same time point. C: quantitative data for anesthetized naïve female C57Bl/6 mice (Ctrl, n = 20) and STZ-treated female C57Bl/6 mice at 38–99 days after diabetes (STZ, n = 26) are shown as means ± SE *P < 0.05 vs. Ctrl. D: quantitative data for serially acquired ECGs in nonrestrained naïve (Ctrl, n = 2) and STZ-treated (STZ, n = 6) female C57Bl/6 mice by telemetry are shown as mean ± SE *P < 0.05 vs. Ctrl for the same time point.
Fig. 4.
Fig. 4.
Intrinsic defects of the diabetic heart. A: electrocardiographic parameters for perfused hearts from naïve female C57Bl/6 mice (Ctrl, n = 9) and STZ-treated female C57Bl/6 mice at 49–99 days after induction of diabetes (n = 9) are shown as means ± SE *P < 0.001 vs. Ctrl. B: LV pressure and maximal rate of contraction (+dP/dtmax) and relaxation (+dP/dtmin) in perfused hearts from naïve female C57Bl/6 mice (Ctrl, n = 9) and STZ-treated female C57Bl/6 mice at 49–99 days after induction of diabetes (n = 9) are shown as means ± SE. Data were obtained at baseline (Krebs-Henseleit buffer, KHB) and following perfusion with 10 nM isoproterenol (Iso). *P < 0.05 vs. Ctrl; †P < 0.01 vs. KHB. C: cell death identified by the expression of vitronectin in the myocardium of a STZ-treated FVB male mouse by confocal microscopy. D: quantitative data for myocyte death assessed in tissue sections from naïve FVB male mice (Ctrl, n = 8, 7, and 9 at ≤1, 2 to 3, and 4 to 5 mo, respectively) and STZ-treated male FVB mice (n = 5, 8, and 6 at ≤1, 2 to 3, and 4 to 5 mo after induction of diabetes, respectively) are shown as median and interquartile ranges. Analysis of variance for the 6 groups: P < 0.001. *P < 0.05 vs. Ctrl for the same time point using pairwise comparison.
Fig. 5.
Fig. 5.
Diabetes induces defective myocyte function. A: action potentials (APs) of myocytes obtained from one naïve female C57Bl/6 mouse (Ctrl; left) and one STZ-treated female C57Bl/6 mouse 83 days after induction of diabetes (right). B: AP properties for isolated cardiomyocytes from naïve female C57Bl/6 mice (Ctrl, n = 27 cells from 13 animals) and STZ-treated female C57Bl/6 mice at 70–178 days after induction of diabetes (n = 28 cells from 8 animals) are shown as median and interquartile ranges. *P < 0.05 vs. Ctrl. RMP, resting membrane potential; APD50, AP duration at 50% repolarization. C: Ca2+ transients in myocytes obtained from one naïve female C57Bl/6 mouse (Ctrl; left) and one STZ-treated female C57Bl/6 mouse 60 days after induction of diabetes (right). D: Ca2+ transient properties obtained at 2- and 4-Hz pacing rates for isolated cardiomyocytes from naïve female C57Bl/6 mice (Ctrl, n = 35–38 cells from 2 animals) and STZ-treated female C57Bl/6 mice at 15–23 days after induction of diabetes (n = 64–71 cells from 4 animals) are shown as median and interquartile ranges. *P < 0.01 vs. Ctrl. E: Ca2+ transient properties obtained at 2- and 4-Hz pacing rate for isolated cardiomyocytes from naïve female C57Bl/6 mice (Ctrl, n = 153 cells from 9 animals) and STZ-treated female C57Bl/6 mice at 38–82 days after induction of diabetes (n = 188–189 cells from 9 animals) are shown as median and interquartile ranges. *P < 0.001 vs. Ctrl.
Fig. 6.
Fig. 6.
Diabetes affects rate adaptation and inotropic mechanisms of cardiomyocytes. A: Ca2+ transients at progressively faster pacing rate for one myocyte obtained from a naïve C57Bl/6 female mouse (Ctrl; top) and one myocyte from a STZ-treated female C57Bl/6 mouse 38 days after induction of diabetes (bottom). B: quantitative data for rate adaptation of amplitude and decay of Ca2+ transients for cardiomyocytes from naïve female C57Bl/6 mice (Ctrl, n = 24 cells from 5 animals) and STZ-treated female C57Bl/6 mice at 38–88 days after induction of diabetes (STZ, n = 16 cells from 4 animals) are shown as means ± SE. *P < 0.05 vs. Ctrl at the same cycle length (CL). C: Ca2+ transient properties obtained at 2- and 4-Hz pacing rates in the presence of 100 nM isoproterenol for myocytes from naïve female C57Bl/6 mice (Ctrl, n = 88 cells from 5 animals) and STZ-treated female C57Bl/6 mice at 40–82 days after induction of diabetes (n = 85–86 cells from 5 animals) are shown as median and interquartile ranges. F/F0, normalized fluorescence. *P < 0.01 vs. Ctrl.
Fig. 7.
Fig. 7.
Diabetes alters intracellular Ca2+ handling. A: caffeine-induced Ca2+ transients for one myocyte obtained from a naïve C57Bl/6 female mouse (Ctrl; left) and one myocyte from a STZ-treated female C57Bl/6 mouse 77 days after induction of diabetes (right). B: quantitative data for Ca2+ transient amplitude induced by electrical stimulation (Paced) or caffeine spritz (Caff) for cardiomyocytes from naïve female C57Bl/6 mice (Ctrl, n = 257 cells from 6 animals) and STZ-treated female C57Bl/6 mice at 63–97 days after induction of diabetes (n = 216 cells from 5 animals) are shown as median and interquartile ranges. †P < 0.001 vs. Paced; *P < 0.001 vs. Ctrl in the same experimental condition. C: fitting with monoexponential functions (gray dashed lines) of the decay phase of caffeine-induced Ca2+ transients shown in A. The following parameters characterize the 2 functions: Ctrl, time constant = 2075 ms, R2 = 0.997; STZ, time constant = 4994 ms, R2 = 0.995. D: quantitative data for the decay of the caffeine-induce Ca2+ transient, which is reflective of Na+/Ca2+ exchanger activity for cardiomyocytes from naïve female C57Bl/6 mice (Ctrl, n = 181 cells from 6 animals) and STZ-treated female C57Bl/6 mice at 63–97 days after induction of diabetes (n = 133 cells from 5 animals) are shown as median and interquartile ranges. *P < 0.001 vs. Ctrl. E: line-scan image of a myocyte from a STZ-treated female C57Bl/6 mouse 15 days after induction of diabetes. White arrow points to a spontaneous Ca2+ release event, which is magnified in inset. F: quantitative data for the occurrence and amplitude of Ca2+ sparks in cardiomyocytes from naïve female C57Bl/6 mice (Ctrl, n = 101 cells from 4 animals) and STZ-treated female C57Bl/6 mice at 15–19 and 45–83 days after induction of diabetes (STZ < 1 m; n = 53 cells from 3 animals; STZ > 1 m; n = 80 cells from 5 animals) are shown as median and interquartile ranges. *P < 0.05 vs. Ctrl.

Similar articles

Cited by

References

    1. Bers DM. Calcium cycling and signaling in cardiac myocytes. Annu Rev Physiol 70: 23–49, 2008. doi:10.1146/annurev.physiol.70.113006.100455. - DOI - PubMed
    1. Bers DM. Cardiac excitation-contraction coupling. Nature 415: 198–205, 2002. doi:10.1038/415198a. - DOI - PubMed
    1. Bouchard RA, Clark RB, Giles WR. Effects of action potential duration on excitation-contraction coupling in rat ventricular myocytes. Action potential voltage-clamp measurements. Circ Res 76: 790–801, 1995. doi:10.1161/01.RES.76.5.790. - DOI - PubMed
    1. Boudina S, Abel ED. Diabetic cardiomyopathy, causes and effects. Rev Endocr Metab Disord 11: 31–39, 2010. doi:10.1007/s11154-010-9131-7. - DOI - PMC - PubMed
    1. Cardoso CR, Salles GF, Deccache W. Prognostic value of QT interval parameters in type 2 diabetes mellitus: results of a long-term follow-up prospective study. J Diabetes Complications 17: 169–178, 2003. doi:10.1016/S1056-8727(02)00206-4. - DOI - PubMed

MeSH terms