Review
. 2017 Jan;105(1):57-69.
doi: 10.3945/ajcn.116.142521. Epub 2016 Nov 23.

Total red meat intake of ≥0.5 servings/d does not negatively influence cardiovascular disease risk factors: a systemically searched meta-analysis of randomized controlled trials

Affiliations
Review

Total red meat intake of ≥0.5 servings/d does not negatively influence cardiovascular disease risk factors: a systemically searched meta-analysis of randomized controlled trials

Lauren E O'Connor et al. Am J Clin Nutr. 2017 Jan.

Abstract

Background: Observational associations between red meat intake and cardiovascular disease (CVD) are inconsistent. There are limited comprehensive analyses of randomized controlled trials (RCTs) that investigate the effects of red meat consumption on CVD risk factors.

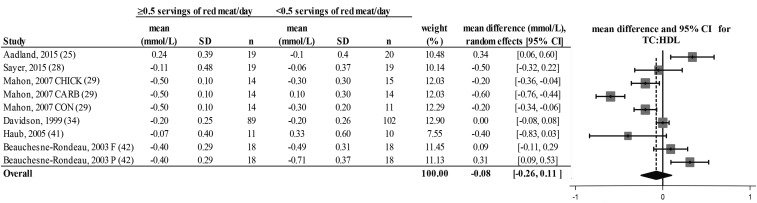
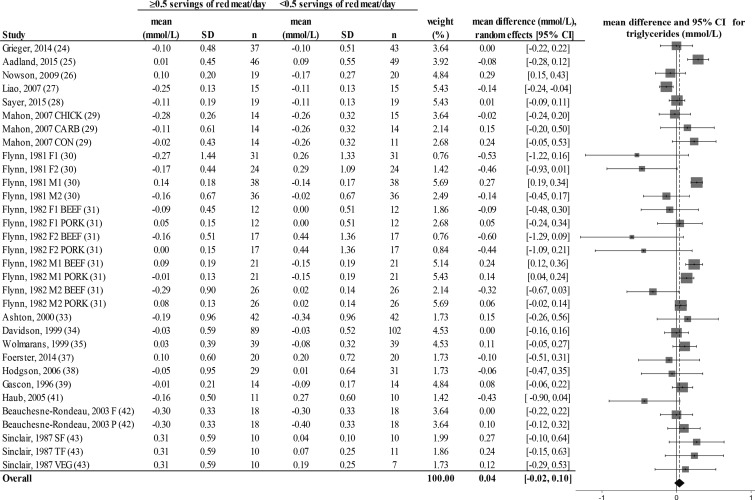
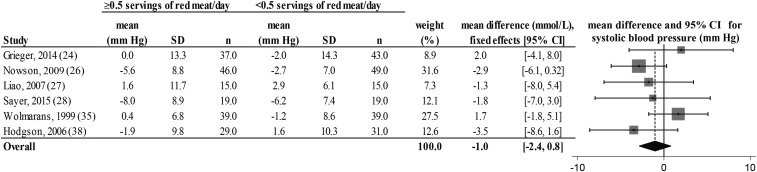
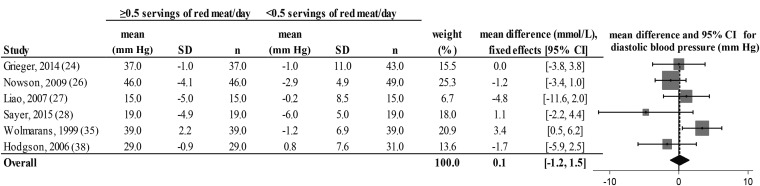
Objective: The purpose of this systematically searched meta-analysis was to assess the effects of consuming ≥0.5 or <0.5 servings of total red meat/d on CVD risk factors [blood total cholesterol (TC), LDL cholesterol, HDL cholesterol, triglycerides, ratio of TC to HDL cholesterol (TC:HDL), and systolic and diastolic blood pressures (SBP and DBP, respectively)]. We hypothesized that the consumption of ≥0.5 servings of total red meat/d would have a negative effect on these CVD risk factors.

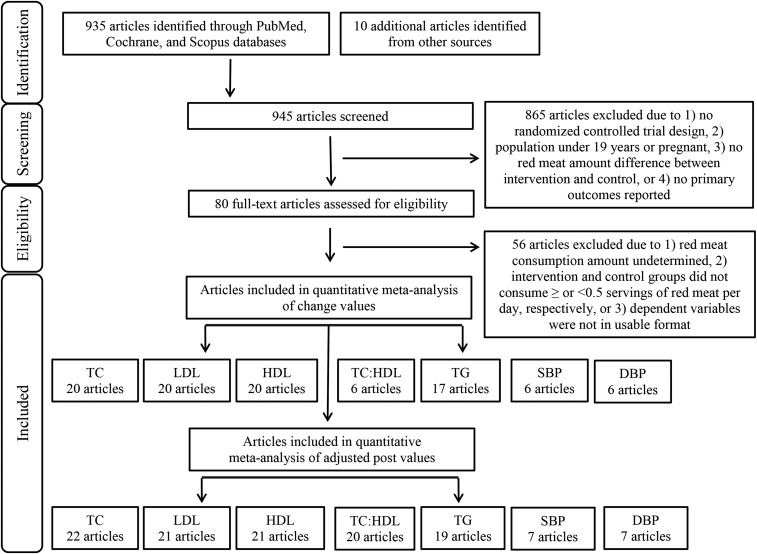
Design: Two researchers independently screened 945 studies from PubMed, Cochrane Library, and Scopus databases and extracted data from 24 qualified RCTs. Inclusion criteria were 1) RCT, 2) subjects aged ≥19 y, 3) consumption of ≥0.5 or <0.5 total red meat servings/d [35 g (1.25 ounces)], and 4) reporting ≥1 CVD risk factor. We performed an adjusted 2-factor nested ANOVA mixed-effects model procedure on the postintervention values of TC, LDL cholesterol, HDL cholesterol, TC:HDL cholesterol, triglycerides, SBP, and DBP; calculated overall effect sizes of change values; and used a repeated-measures ANOVA to assess pre- to postintervention changes.

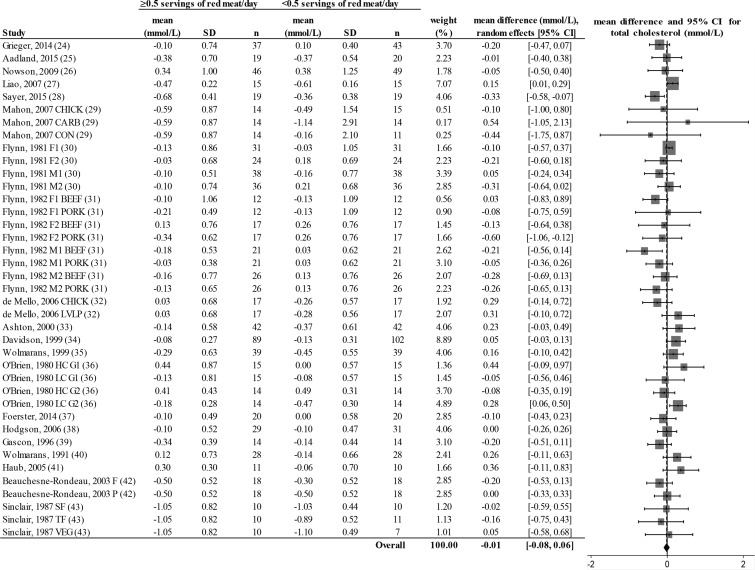
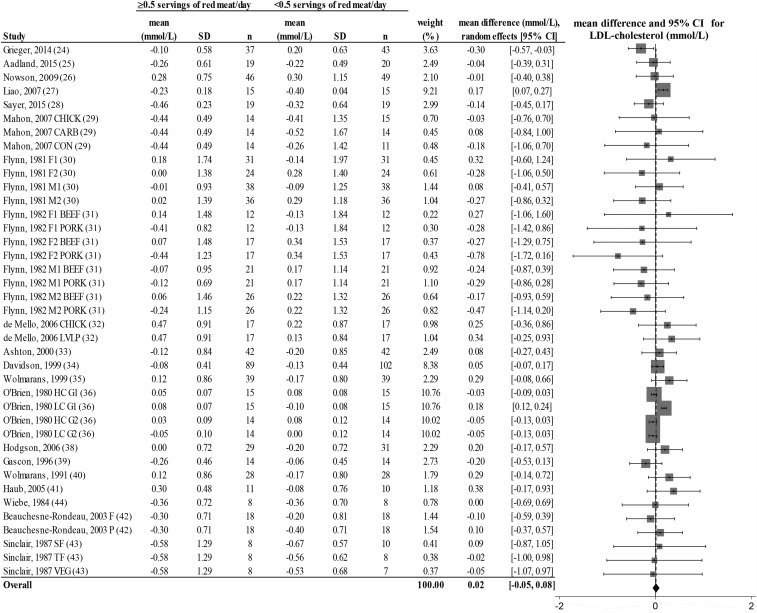
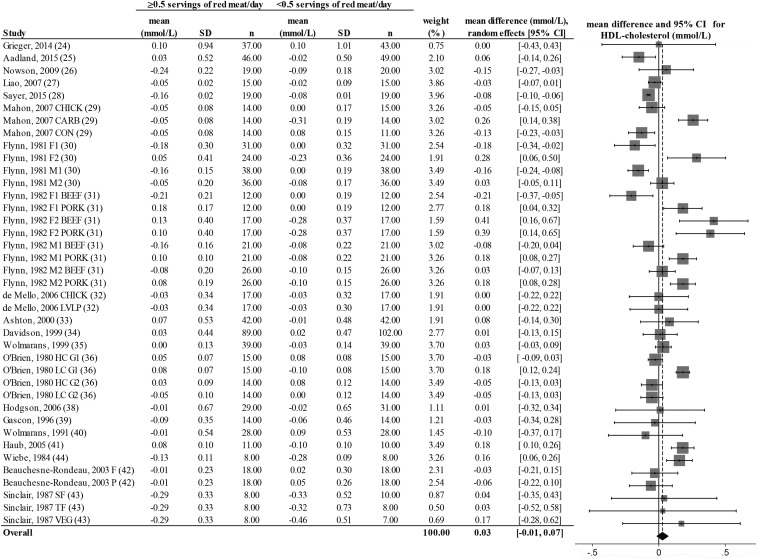
Results: Red meat intake did not affect lipid-lipoprotein profiles or blood pressure values postintervention (P > 0.05) or changes over time [weighted mean difference (95% CI): -0.01 mmol/L (-0.08, 0.06 mmol/L), 0.02 mmol/L (-0.05, 0.08 mmol/L), 0.03 mmol/L (-0.01, 0.07 mmol/L), and 0.04 mmol/L (-0.02, 0.10 mmol/L); -0.08 mm Hg (-0.26, 0.11 mm Hg); and -1.0 mm Hg (-2.4, 0.78 mm Hg) and 0.1 mm Hg (-1.2, 1.5 mm Hg) for TC, LDL cholesterol, HDL cholesterol, triglycerides, TC:HDL cholesterol, SBP, and DBP, respectively]. Among all subjects, TC, LDL cholesterol, HDL cholesterol, TC:HDL cholesterol, triglycerides, and DBP, but not SBP, decreased over time (P < 0.05).

Conclusions: The results from this systematically searched meta-analysis of RCTs support the idea that the consumption of ≥0.5 servings of total red meat/d does not influence blood lipids and lipoproteins or blood pressures.

Keywords: animal flesh; blood lipids; blood lipoproteins; blood pressure; diet; dietary guidance; meat; meat products.


Figures

FIGURE 1
FIGURE 1
PRISMA flowchart. DBP, diastolic blood pressure; PRISMA, Preferred Reporting Items for Systematic Review and Meta-Analyses; SBP, systolic blood pressure; TC, total cholesterol; TG, triglycerides.
FIGURE 2
FIGURE 2
Random-effects model meta-analysis for changes in total blood cholesterol concentrations from randomized controlled trials comparing ≥0.5 or <0.5 servings of total red meat/d. Heterogeneity: τ2 = 0.011, χ2 = 1.48, df = 38 (P = 0.028), I2 = 32%. Data are shown in descending order from smallest to largest amounts of red meat consumed by the intervention group or phase. CARB, carbohydrate control diet; CHICK, chicken control diet; CON, habitual control diet; F, lean fish control diet; F1, first female group; F1 BEEF, first female group consuming beef diet; F1 PORK, first female group consuming pork diet; F2, second female group; F2 BEEF, second female group consuming beef diet; F2 PORK, second female group consuming pork diet; HC G1, first group consuming high-cholesterol diet; HC G2, second group consuming high-cholesterol diet; LC G1, first group consuming low-cholesterol diet; LC G2, second group consuming low-cholesterol diet; LVLP, lactovegetarian low-protein control diet; M1, first male group; M1 BEEF, first male group consuming beef diet; M1 PORK, first male group consuming pork diet; M2, second male group; M2 BEEF, second male group consuming beef diet; M2 PORK, second male group consuming pork diet; P, poultry control diet; SF, southern fish control diet; TF, tropical fish control diet; VEG, vegetarian control diet.
FIGURE 3
FIGURE 3
Random-effects model meta-analysis for changes in blood LDL-cholesterol concentrations from randomized controlled trials comparing ≥0.5 or <0.5 servings of total red meat/d. Heterogeneity: τ2 = 0.011, χ2 = 6.62, df = 38 (P = 0.001), I2 = 85%. Data are shown in descending order from smallest to largest amounts of red meat consumed by the intervention group or phase. CARB, carbohydrate control diet; CHICK, chicken control diet; CON, habitual control diet; F, lean fish control diet; F1, first female group; F1 BEEF, first female group consuming beef diet; F1 PORK, first female group consuming pork diet; F2, second female group; F2 BEEF, second female group consuming beef diet; F2 PORK, second female group consuming pork diet; HC G1, first group consuming high-cholesterol diet; HC G2, second group consuming high-cholesterol diet; LC G1, first group consuming low-cholesterol diet; LC G2, second group consuming low-cholesterol diet; LVLP, lactovegetarian low-protein control diet; M1, first male group; M1 BEEF, first male group consuming beef diet; M1 PORK, first male group consuming pork diet; M2, second male group; M2 BEEF, second male group consuming beef diet; M2 PORK, second male group consuming pork diet; P, poultry control diet; SF, southern fish control diet; TF, tropical fish control diet; VEG, vegetarian control diet.
FIGURE 4
FIGURE 4
Random-effects model meta-analysis for changes in blood HDL-cholesterol concentrations from randomized controlled trials comparing ≥0.5 or <0.5 servings of total red meat/d. Heterogeneity: τ2 = 0.011, χ2 = 6.62, df = 38 (P = 0.001), I2 = 85%. Data are shown in descending order from smallest to largest amounts of red meat consumed by the intervention group or phase. CARB, carbohydrate control diet; CHICK, chicken control diet; CON, habitual control diet; F, lean fish control diet; F1, first female group; F1 BEEF, first female group consuming beef diet; F1 PORK, first female group consuming pork diet; F2, second female group; F2 BEEF, second female group consuming beef diet; F2 PORK, second female group consuming pork diet; HC G1, first group consuming high-cholesterol diet; HC G2, second group consuming high-cholesterol diet; LC G1, first group consuming low-cholesterol diet; LC G2, second group consuming low-cholesterol diet; LVLP, lactovegetarian low-protein control diet; M1, first male group; M1 BEEF, first male group consuming beef diet; M1 PORK, first male group consuming pork diet; M2, second male group; M2 BEEF, second male group consuming beef diet; M2 PORK, second male group consuming pork diet; P, poultry control diet; SF, southern fish control diet; TF, tropical fish control diet; VEG, vegetarian control diet.
FIGURE 5
FIGURE 5
Random-effects model meta-analysis for changes in blood TC:HDL from randomized controlled trials comparing ≥0.5 or <0.5 servings of total red meat/d. Heterogeneity: τ2 = 0.064, χ2 = 9.93, df = 8 (P = 0.001), I2 = 90%. Data are shown in descending order from smallest to largest amounts of red meat consumed by the intervention group or phase. CARB, carbohydrate control diet; CHICK, chicken control diet; CON, habitual control diet; F, lean fish control diet; P, poultry control diet; TC:HDL, ratio of total cholesterol to HDL cholesterol.
FIGURE 6
FIGURE 6
Random-effects model meta-analysis for changes in blood triglyceride concentrations from randomized controlled trials comparing ≥0.5 or <0.5 servings of total red meat/d. Heterogeneity: τ2 = 0.017, χ2 = 3.16, df = 31 (P = 0.001), I2 = 68%. Data are shown in descending order from smallest to largest amounts of red meat consumed by the intervention group or phase. CARB, carbohydrate control diet; CHICK, chicken control diet; CON, habitual control diet; F, lean fish control diet; F1, first female group; F1 BEEF, first female group consuming beef diet; F1 PORK, first female group consuming pork diet; F2, second female group; F2 BEEF, second female group consuming beef diet; F2 PORK, second female group consuming pork diet; M1, first male group; M1 BEEF, first male group consuming beef diet; M1 PORK, first male group consuming pork diet; M2, second male group; M2 BEEF, second male group consuming beef diet; M2 PORK, second male group consuming pork diet; P, poultry control diet; SF, southern fish control diet; TF, tropical fish control diet; VEG, vegetarian control diet.
FIGURE 7
FIGURE 7
Fixed-effects model meta-analysis for changes in systolic blood pressure from randomized controlled trials comparing ≥0.5 or <0.5 servings of total red meat/d. Heterogeneity: τ2 = 0.662, χ2 = 4.42, df = 5 (P = 0.346), I2 = 11%. Data are shown in descending order from smallest to largest amounts of red meat consumed by the intervention group or phase.
FIGURE 8
FIGURE 8
Fixed-effects model meta-analysis for changes in diastolic blood pressure from randomized controlled trials comparing ≥0.5 or <0.5 servings of total red meat/d. Heterogeneity: τ2 = 0.662, χ2 = 4.42, df = 5 (P = 0.097), I2 = 46%. Data are shown in descending order from smallest to largest amounts of red meat consumed by the intervention group or phase.

Comment in

References

    1. CDC. Heart disease facts. Version current 10 August 2015 [cited 2016 May 9]. Available from: http://www.cdc.gov/heartdisease/facts.htm.
    1. Kaluza J, Wolk A, Larsson SC. Red meat consumption and risk of stroke: a meta-analysis of prospective studies. Stroke 2012;43:2556–60. - PubMed
    1. Chen GC, Lv DB, Pang Z, Liu QF. Red and processed meat consumption and risk of stroke: a meta-analysis of prospective cohort studies. Eur J Clin Nutr 2013;67:91–5. - PubMed
    1. Abete I, Romaguera D, Vieira AR, Lopez de Munain A, Norat T. Association between total, processed, red and white meat consumption and all-cause, CVD and IHD mortality: a meta-analysis of cohort studies. Br J Nutr 2014;112:762–75. - PubMed
    1. Pan A, Sun Q, Bernstein AM, Schulze MB, Manson JE, Stampfer MJ, Willett WC, Hu FB. Red meat consumption and mortality: results from 2 prospective cohort studies. Arch Intern Med 2012;172:555–63. - PMC - PubMed