. 2017 Jan 15;6(1):17-28.
doi: 10.1242/bio.022418.

Casein kinase II is required for proper cell division and acts as a negative regulator of centrosome duplication in Caenorhabditis elegans embryos

Affiliations

Casein kinase II is required for proper cell division and acts as a negative regulator of centrosome duplication in Caenorhabditis elegans embryos

Jeffrey C Medley et al. Biol Open. .

Abstract

Centrosomes are the primary microtubule-organizing centers that orchestrate microtubule dynamics during the cell cycle. The correct number of centrosomes is pivotal for establishing bipolar mitotic spindles that ensure accurate segregation of chromosomes. Thus, centrioles must duplicate once per cell cycle, one daughter per mother centriole, the process of which requires highly coordinated actions among core factors and modulators. Protein phosphorylation is shown to regulate the stability, localization and activity of centrosome proteins. Here, we report the function of Casein kinase II (CK2) in early Caenorhabditis elegans embryos. The catalytic subunit (KIN-3/CK2α) of CK2 localizes to nuclei, centrosomes and midbodies. Inactivating CK2 leads to cell division defects, including chromosome missegregation, cytokinesis failure and aberrant centrosome behavior. Furthermore, depletion or inhibiting kinase activity of CK2 results in elevated ZYG-1 levels at centrosomes, restoring centrosome duplication and embryonic viability to zyg-1 mutants. Our data suggest that CK2 functions in cell division and negatively regulates centrosome duplication in a kinase-dependent manner.

Keywords: CK2; Caenorhabditis elegans; Casein kinase II; Centrosome; KIN-3; ZYG-1.


Conflict of interest statement

The authors declare no competing or financial interests.

Figures

Fig. 1.
Fig. 1.
Knocking down CK2 partially restores embryonic viability and bipolar spindle formation to zyg-1(it25). Depleting CK2 subunits by either kin-3(RNAi) or kin-10(RNAi) leads to an increase in both (A) embryonic viability and (B) bipolar spindle formation to zyg-1(it25) mutants, which were examined at restrictive (24°C) and semi-restrictive temperatures (22.5°C). (A,B) Mean values are presented. Error bars are standard deviation (s.d). n is given as the number of embryos (A) or the number of blastomeres (B) at second mitosis. ***P<0.001, **P<0.01, *P<0.05 (two-tailed t-test). (C) Immunofluorescence of zyg-1(it25) embryos raised at 22.5°C illustrates mitotic spindles at second mitosis. kin-3(RNAi) or kin-10(RNAi) restores bipolar spindles to zyg-1(it25) embryos, but control embryos display monopoles. SAS-4 was used as a centriole marker. Scale bar: 10 µm.
Fig. 2.
Fig. 2.
KIN-3 depletion leads to increased levels of centrosomal ZYG-1. (A) Wild-type embryos stained for centrosome factors (ZYG-1, SAS-5, SAS-4, TBG-1: green), microtubules and DNA illustrate centrosomal localization of each factor. For SPD-2, shown are still-images from time-lapse movies of embryos expressing GFP::SPD-2 and GFP::Histone. (B) Quantification of centrosomal levels of each factor in kin-3(RNAi) (green dots) relative to controls (black dots). Each dot represents a centrosome. Box ranges from the first through third quartile of the data. Thick bar indicates the median. Solid horizontal line extends 1.5 times the inter-quartile range or to the minimum and maximum data point. ***P<0.001 (two-tailed t-test). (C) Quantitative immunoblot analyses of embryonic lysates reveal that KIN-3 knockdown leads to no significant changes in overall levels of SPD-2 (0.92±0.41-fold, n=4), SZY-20 (1.03±0.3, n=7), TBG-1 (1.06±0.35, n=10), both isoforms of SAS-5L (404aa: 1.01±0.21, n=16) and SAS-5S (288aa: 1.04±0.42, n=15) relative to controls. n indicates the number of biological replicates. Tubulin was used as a loading control. (D) Still images from time-lapse movies of embryos expressing GFP::ZYG-1-C-term. Depleting KIN-3 results in elevated levels of centrosomal GFP::ZYG-1 throughout the first cell cycle. Time (min) is given relative to first metaphase (t=0). (E) Quantification of GFP::ZYG-1-C-term levels in kin-3(RNAi) (green lines) and control embryos (black lines). Mean fluorescence intensity is plotted (n=10 centrosomes in 5 embryos). CE, Centriole; PCM, Centrosome; Cyto, Cytoplasm. Error bars are s.d. ***P<0.001, **P<0.01, *P<0.05 (two-tailed t-test). (A,D) Insets highlight centrosomes magnified 4-fold. Scale bar: 10 µm.
Fig. 3.
Fig. 3.
Depleting CK2 restores centrosomal ZYG-1 levels in zyg-1(it25) embryos. (A) Quantification of centrosomal ZYG-1 levels at first anaphase in zyg-1(it25) embryos exposed to kin-3(RNAi), kin-10(RNAi) or L4440. Values are relative to wild-type centrosomes treated with control RNAi (L4440). Shown is the same wild-type control data presented in Fig. 2B (for ZYG-1). At the semi-restrictive temperature 22.5°C, zyg-1(it25) embryos exhibit reduced ZYG-1 levels at centrosomes (0.59±0.32) compared to the wild-type. kin-3(RNAi) or kin-10(RNAi) in zyg-1(it25) mutants restores centrosomal ZYG-1 levels to near wild-type levels (0.83±0.50 and 0.84±0.42, respectively). Each dot represents a centrosome. Box ranges from the first through third quartile of the data, and thick bar represents the median. Solid horizontal line extends 1.5 times the inter-quartile range or to the minimum and maximum data point. ***P<0.001 (two-tailed t-test). Note that data for control RNAi-treated wild-type embryos are also presented in Fig. 2B, but included for quantitative analysis. (B) zyg-1(it25) embryos stained for ZYG-1 illustrate centrosome-associated ZYG-1 localization. Inset illustrates centrosomal regions magnified 4-fold. Scale bar: 10 µm.
Fig. 4.
Fig. 4.
CK2 is required for early cell divisions in C. elegans embryos. (A) Knockdown of KIN-3 or KIN-10 by RNAi results in embryonic lethality (Mean±s.d.: 47±10% and 45±21%, respectively). (B) Knockdown of KIN-3 or KIN-10 by RNAi leads to a significant reduction in the number of progeny produced for 24 h (90±43 and 79±24, respectively) compared to controls (133±43). For A and B, each dot represents an animal. (C) Wild-type embryos expressing GFP::β-tubulin, mCherry::γ-tubulin and mCherry:histone: kin-3(RNAi) results in defective cell divisions such as (a) lagging DNA (box, Movie 2), (b) detached centrosomes (arrow), (c) abnormal PCM morphology (box) and extra DNA (arrow), and (d) cytokinesis failure (Movie 3). (D) Embryos expressing mCherry::histone and mCherry::plasma membrane. Boxed regions highlight cytokinetic furrow shown in bottom panels. Time-lapse recordings of cleavage furrow formation and ingression in L4440 and kin-3(RNAi) embryos. (E) CK2 depletion leads to a delay in cell cycle progression. Top: measurement of cell cycle lengths (average±s.d.) from first metaphase to second metaphase in AB or P1 cell. Each dot represents an embryo. Bottom: wild-type embryo representing cell cycle stages used for quantification. Note that second metaphase of the anterior blastomere (b, arrow) initiates before second metaphase of the posterior blastomere (c, arrow). (A,B,E) Box ranges from the first through third quartile of the data, and thick bar represents the median. Dashed line extends 1.5 times the inter-quartile range or to the minimum and maximum data point. ***P<0.001 (two-tailed t-test). Scale bar: 10 µm.
Fig. 5.
Fig. 5.
Subcellular localization of KIN-3::GFP. Still images of embryos expressing KIN-3::GFP, mCherry::histone and mCherry::plasma membrane, illustrating that KIN-3 is enriched in nuclei at prophase (a), localizes to the mitotic spindle and centrosomes at mitosis including metaphase (b), anaphase (c) and telophase (d) (see Fig. S6). At completion of the first cytokinesis, KIN-3 becomes highly enriched at the midbody-associated structure (e-i, arrows). KIN-3 localization at the nuclei, mitotic spindles and midbody can be observed during second mitosis and later cell cycle stages (f-i). All subcellular localizations of KIN-3::GFP are abolished by depletion of KIN-3 by RNAi (a’-g’). The midbody localization of KIN-3::GFP is highlighted (j) by co-localization of plasma membrane (PM). Insets are magnified 4-fold. Scale bar: 10 µm.
Fig. 6.
Fig. 6.
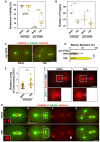
TBB, the chemical inhibitor of CK2, phenocopies CK2 depletion. (A) TBB treatment restores embryonic viability to zyg-1(it25) animals at 22.5°C (DMSO control: 3±3%; TBB: 37±22%), but TBB had a mild effect on wild-type worms (DMSO: 95±6%; TBB: 92±8%). (B) TBB treatment leads to a significant reduction in the number of progeny produced by L4 animals allowed to self-fertilize for 24 h [wild-type (DMSO: 117±28; TBB: 49±11), zyg-1(it25) (DMSO: 67±23; TBB: 39±13)]. For A and B, each dot represents an animal. (C) TBB-treated zyg-1(it25) embryo exhibits bipolar spindles, but DMSO control embryo with monopolar spindles. (D) TBB treatment enhances bipolar spindle formation in zyg-1(it25) embryos (DMSO: 32±16%; TBB: 73±9.5%, n=blastomeres). Error bars are s.d. (E) Quantification of centrosomal ZYG-1 levels in TBB-treated wild-type embryos. Each dot represents a centrosome. (A,B,E) Box ranges from the first through third quartile of the data. Thick bar represents the median. Dashed line extends 1.5 times the inter-quartile range or to the minimum and maximum data point. (F) TBB-treated wild-type embryo shows more intense ZYG-1 focus at centrosomes. Insets illustrate centrosomal regions magnified 4-fold. (G) Wild-type embryos treated with TBB exhibit defective cell divisions that are similar to RNAi-mediated depletion of CK2: (a) lagging DNA (inset boxes are 2-fold magnifications), (b) expanded PCM (boxes), (c) detached centrosomes (arrow), (d) cell cycle delay. Note cell cycle stages in AB (left) relative to P1 (right) cell. The AB cell (left) is at second anaphase in DMSO controls, but at later mitosis (second telophase) in TBB-treated embryos, whereas the P1 cell (right) is at second metaphase in both TBB and DMSO treated embryos, suggesting that cell cycle in P1 is delayed in TBB-treated embryos. Shown are still images from live confocal imaging. ***P<0.001, **P<0.01 (two-tailed t-test). Scale bar: 10 µm.

Similar articles

Cited by

References

    1. Alessi A. F., Khivansara V., Han T., Freeberg M. A., Moresco J. J., Tu P. G., Montoye E., Yates J. R. III, Karp X. and Kim J. K. (2015). Casein kinase II promotes target silencing by miRISC through direct phosphorylation of the DEAD-box RNA helicase CGH-1. Proc. Natl. Acad. Sci. USA 112, E7213-E7222. 10.1073/pnas.1509499112 - DOI - PMC - PubMed
    1. Arquint C. and Nigg E. A. (2014). STIL microcephaly mutations interfere with APC/C-mediated degradation and cause centriole amplification. Curr. Biol. 24, 351-360. 10.1016/j.cub.2013.12.016 - DOI - PubMed
    1. Barrett R. M. A., Colnaghi R. and Wheatley S. P. (2011). Threonine 48 in the BIR domain of survivin is critical to its mitotic and anti-apoptotic activities and can be phosphorylated by CK2 in vitro. Cell Cycle 10, 538-548. 10.4161/cc.10.3.14758 - DOI - PMC - PubMed
    1. Brenner S. (1974). The genetics of Caenorhabditis elegans. Genetics 77, 71-94. - PMC - PubMed
    1. Brownlee C. W., Klebba J. E., Buster D. W. and Rogers G. C. (2011). The Protein Phosphatase 2A regulatory subunit Twins stabilizes Plk4 to induce centriole amplification. J. Cell Biol. 195, 231-243. 10.1083/jcb.201107086 - DOI - PMC - PubMed

LinkOut - more resources