. 2017 Jan 15;28(2):270-284.
doi: 10.1091/mbc.E16-07-0483. Epub 2016 Nov 23.

Lipid disequilibrium disrupts ER proteostasis by impairing ERAD substrate glycan trimming and dislocation

Affiliations

Lipid disequilibrium disrupts ER proteostasis by impairing ERAD substrate glycan trimming and dislocation

Milton To et al. Mol Biol Cell. .

Abstract

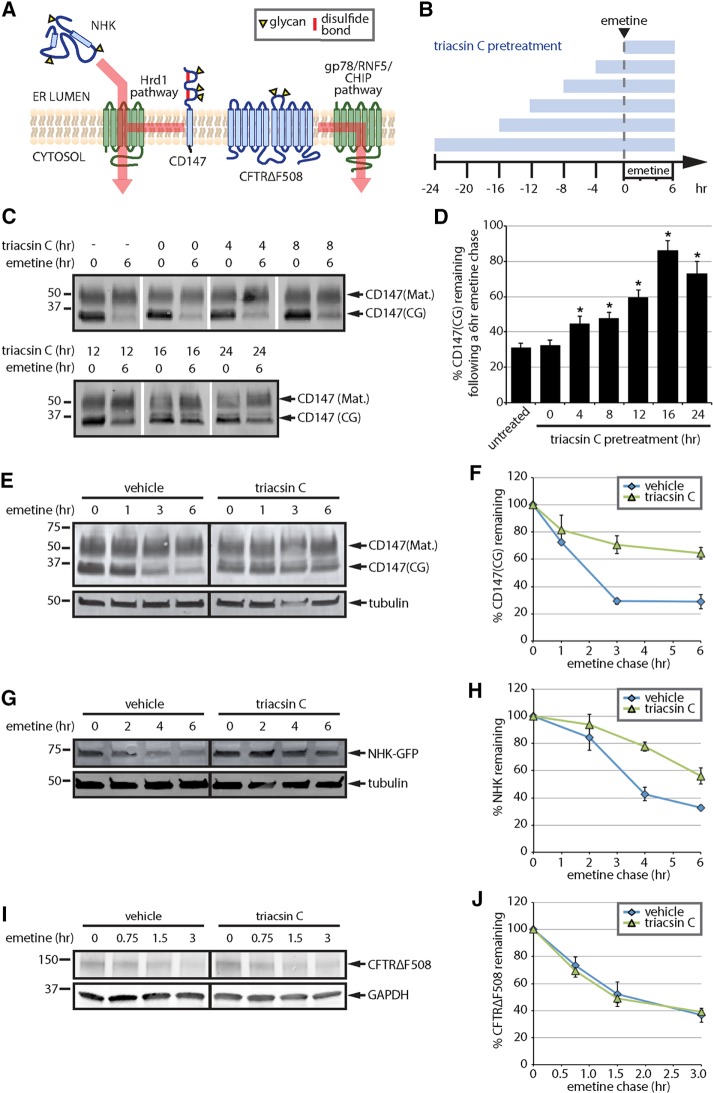
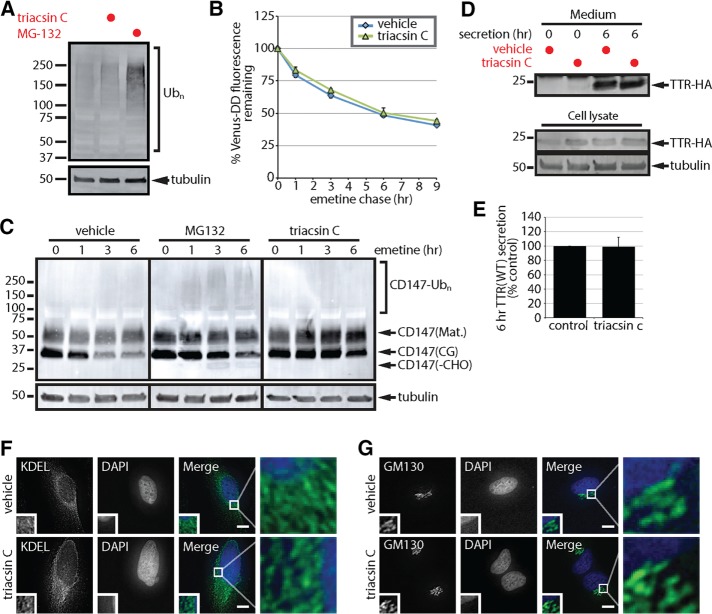
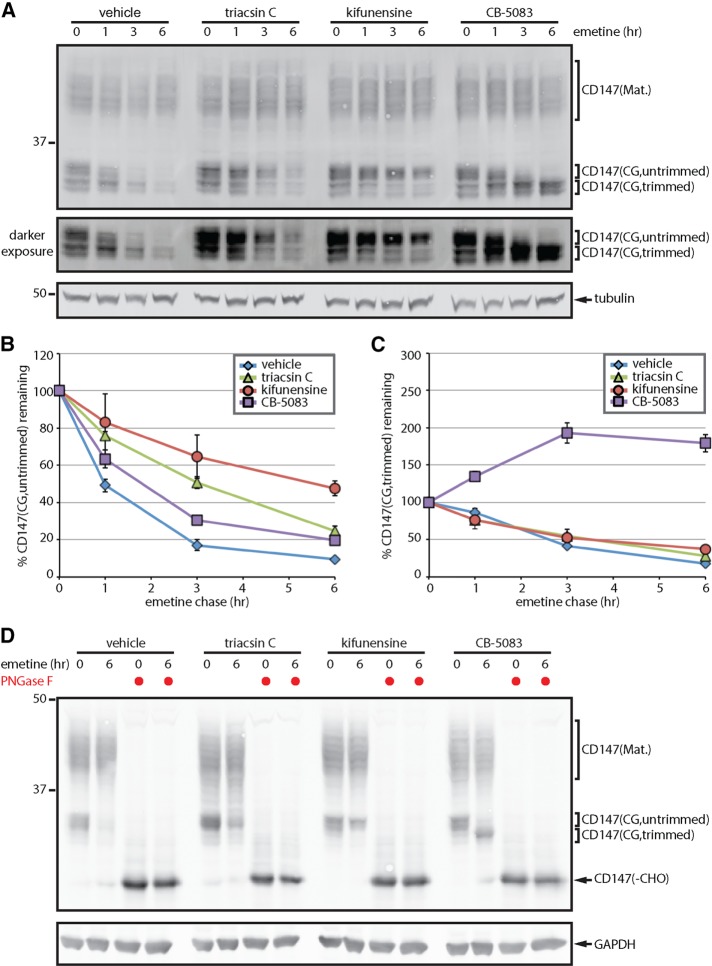
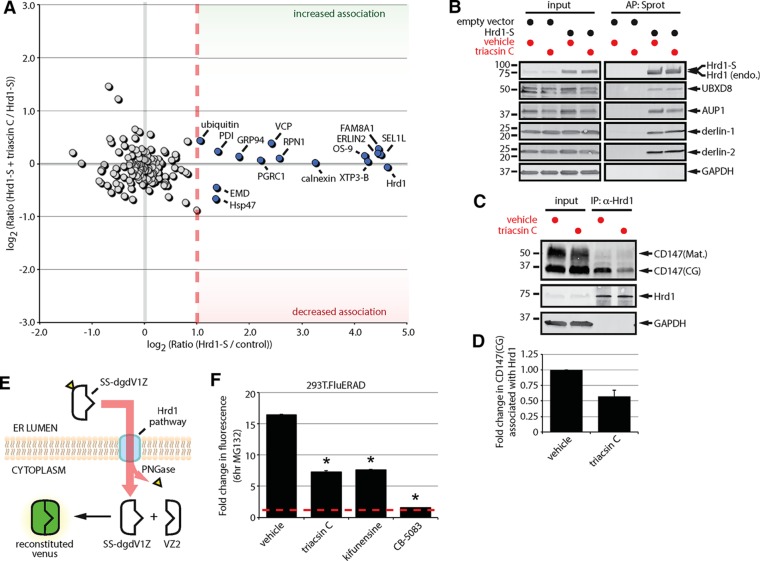
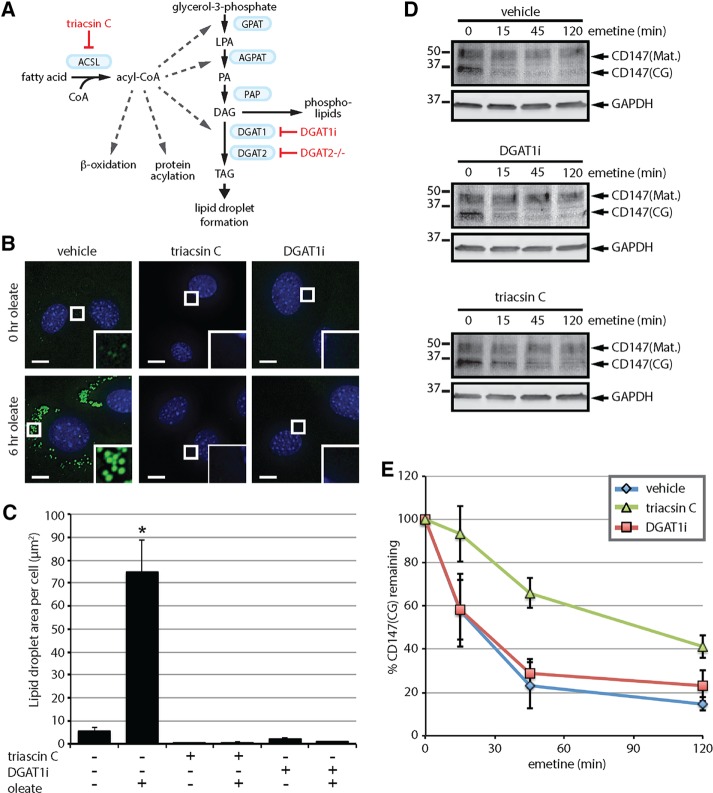
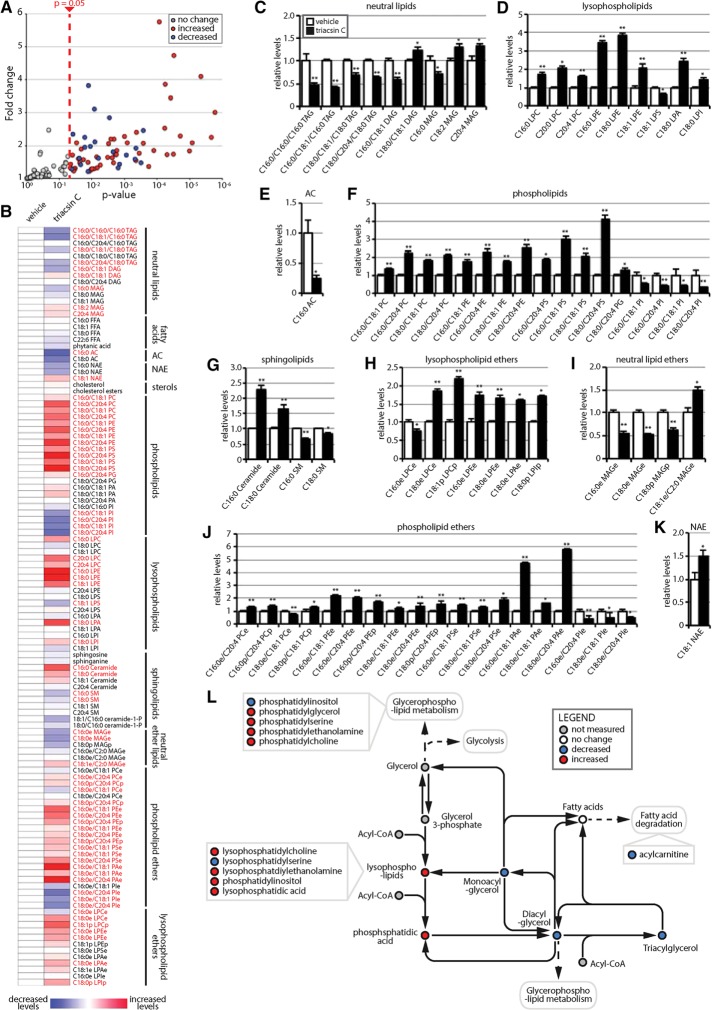
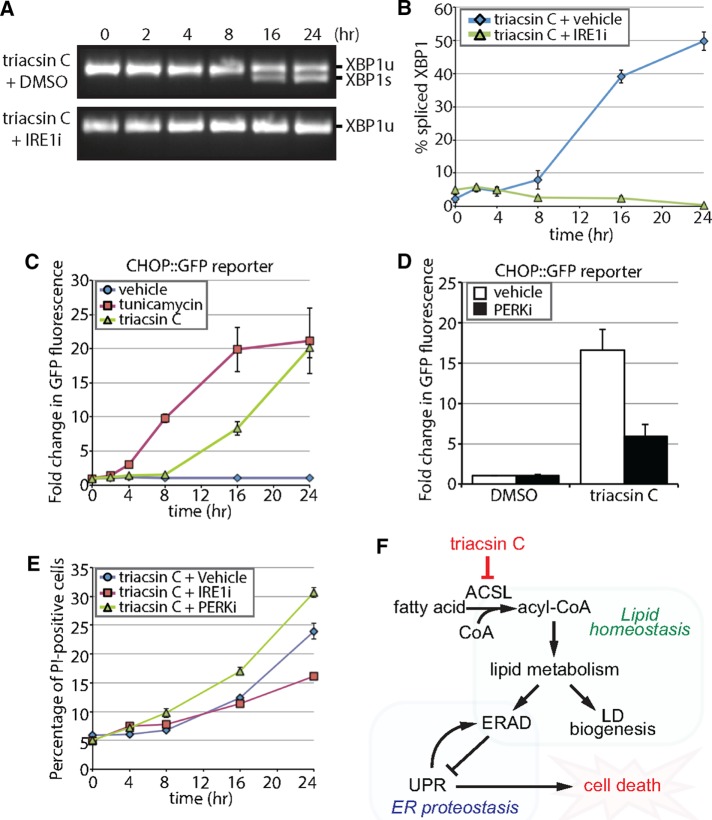
The endoplasmic reticulum (ER) mediates the folding, maturation, and deployment of the secretory proteome. Proteins that fail to achieve their native conformation are retained in the ER and targeted for clearance by ER-associated degradation (ERAD), a sophisticated process that mediates the ubiquitin-dependent delivery of substrates to the 26S proteasome for proteolysis. Recent findings indicate that inhibition of long-chain acyl-CoA synthetases with triacsin C, a fatty acid analogue, impairs lipid droplet (LD) biogenesis and ERAD, suggesting a role for LDs in ERAD. However, whether LDs are involved in the ERAD process remains an outstanding question. Using chemical and genetic approaches to disrupt diacylglycerol acyltransferase (DGAT)-dependent LD biogenesis, we provide evidence that LDs are dispensable for ERAD in mammalian cells. Instead, our results suggest that triacsin C causes global alterations in the cellular lipid landscape that disrupt ER proteostasis by interfering with the glycan trimming and dislocation steps of ERAD. Prolonged triacsin C treatment activates both the IRE1 and PERK branches of the unfolded protein response and ultimately leads to IRE1-dependent cell death. These findings identify an intimate relationship between fatty acid metabolism and ER proteostasis that influences cell viability.


Figures

FIGURE 1:
FIGURE 1:
Triacsin C inhibits a subset of ERAD pathways. (A) ERAD substrate panel, indicating substrate topology and degradation pathway(s). Substrates are indicated in blue and ERAD components in green. Yellow triangles indicate N-linked glycans. (B) Triacsin C treatment time course. Triacsin C was added for the indicated times (blue bars) and maintained in the medium throughout the emetine chase. (C) HEK293 cells were pretreated with 1 µg/ml triacsin C for the indicated times (as depicted in B), followed by addition of 75 µM emetine for 6 h. CD147 levels were assessed by immunoblotting of SDS lysates. (D) The relative CD147(CG) levels in C were quantified and are presented as percentage of the levels at time 0 h (n = 3). Asterisk indicates significant stabilization (p < 0.05). (E) HEK293 cells were pretreated with vehicle or 1 µg/ml triacsin C for 16 h, followed by 75 µM emetine for the indicated times. CD147 levels were assessed by immunoblotting of SDS lysates. (F) The relative levels of CD147(CG) in E were quantified and are presented as percentage of the levels at time 0 h (n = 3). (G) HEK293 cells expressing NHK-GFP were pretreated with vehicle or 1 µg/ml triacsin C for 16 h, followed by 75 µM emetine for the indicated times. NHK-GFP levels were assessed by immunoblotting of SDS lysates. (H) The relative levels of NHK-GFP in G were quantified and are presented as percentage of the levels at time 0 h (n = 3). (I) HEK293 cells expressing CFTR∆F508 were pretreated with vehicle or 1 µg/ml triacsin C for 16 h, followed by 75 µM emetine for the indicated times. CFTR∆F508 levels were assessed by immunoblotting of SDS lysates. (J) The relative levels of CFTR∆F508 in I were quantified and are presented as percentage of the levels at time 0 h (n = 4). Mat., mature; CG, core glycosylated. Error bars indicate SEM.
FIGURE 2:
FIGURE 2:
Triacsin C does not generally inhibit the ubiquitin-proteasome system or protein secretion. (A) SDS lysates from HEK293 cells incubated with 1 µg/ml triacsin C for 16 h or 10 µM MG-132 for 6 h were analyzed by immunoblotting. (B) U2OS cells stably expressing Venus-DD were incubated with vehicle or 1 µg/ml triacsin C for 16 h, followed by emetine treatments for the indicated times. Venus fluorescence levels were monitored by flow cytometry and quantified as the percentage of the levels at time 0 h (n = 3). (C) HEK293 cells were incubated with vehicle or 1 µg/ml triacsin C for 16 h and then treated with 75 µM emetine for the indicated times. Where indicated, 10 µM MG-132 was added at the beginning of the emetine chase. The levels of the different forms of CD147 were assessed by immunoblotting of SDS lysates. (D) HEK293 cells expressing TTR-HA were treated with vehicle or 1 µg/ml triacsin C for 16 h. Cells were washed with PBS, and the medium was replaced with serum-free OPTI-MEM containing vehicle or 1 µg/ml triacsin C for the remaining 6 h. Lysates and TTR-HA immunoprecipitated from the media were analyzed by immunoblotting. (E) The levels of TTR-HA in the media were quantified from D and are presented as percentage of the levels in the control sample (n = 3). (F, G) The morphology of the ER, anti-KDEL (green) and the Golgi complex, anti-GM130 (green), in HeLa cells treated with vehicle or 1 µg/ml triacsin C for 16 h was analyzed by immunofluorescence microscopy. Nuclei were stained with DAPI (blue). Scale bar, 10 µm. Mat., mature; CG, core glycosylated; -CHO, deglycosylated. Error bars indicate SEM.
FIGURE 3:
FIGURE 3:
Triacsin C impairs ERAD substrate glycan trimming. (A) HEK293 cells were pretreated with vehicle or 1 µg/ml triacsin C for 16 h, followed by 75 µM emetine for the indicated times. Where indicated, 5 µg/ml kifunensine and 5 µM CB-5083 were added at the beginning of the emetine chase. SDS lysates were separated on large-format SDS–PAGE gels and analyzed by immunoblotting to visualize the different CD147 glycoforms. A darker exposure of the CD147(CG) bands is provided to facilitate visualization of the different trimmed glycoforms. (B, C) The relative levels of untrimmed CD147(CG) (B) and trimmed CD147(CG) (C) were quantified from A and are presented as percentage of the levels at time 0 h (n = 3). (D) Lysates from cells treated as in A were incubated with PNGase F as indicated and analyzed by immunoblotting. Mat., mature; CG, core glycosylated; -CHO, deglycosylated. Error bars indicate SEM.
FIGURE 4:
FIGURE 4:
Triacsin C impairs substrate delivery to and dislocation from the Hrd1 complex. (A) Two-dimensional plot representing the proteomic analysis of Hrd1-S interactors from a triple SILAC experiment. The ratio of Hrd1-S/control on the x-axis indicates the strength of the interaction under basal conditions. The ratio of Hrd1-S + triacsin C/Hrd1-S on the y-axis indicates the change in the interaction in response to triacsin C treatment. Gray filled circles are nonspecific interactors, and blue filled circles are high-confidence interactors. (B) HEK293 cells expressing an empty vector or S-tagged Hrd1 were pretreated with vehicle or 1 μg/ml triacsin C for 16 h. Affinity-purified complexes were analyzed by immunoblotting with the indicated antibodies. (C) HEK293 cells were pretreated with vehicle or 1 μg/ml triacsin C for 16 h. Endogenous Hrd1 complexes were immunoprecipitated and analyzed by immunoblotting with the indicated antibodies. (D) The fold change in Hrd1-associated CD147(CG) in C was quantified and is presented as a bar graph (n = 3). (E) The split-Venus dislocation assay. See text for description. (F) 293T.FluERAD cells, which stably express the deglycosylation-dependent Venus dislocation system, were pretreated with 1 µg/ml triacsin C for 16 h, followed by a 0- or 6-h treatment with 10 µM MG-132. Where indicated, 5 µg/ml kifunensine or 5 µM CB-5083 was added together with 10 µM MG-132 for 0 or 6 h. Venus fluorescence levels were quantified by flow cytometry and are represented as the fold change relative to the 0 h. Asterisk indicates a significant decrease in the fold change in fluorescence levels (p < 0.05). AP, affinity purification; CG, core glycosylated; endo., endogenous; IP, immunoprecipitation; Mat., mature; Sprot, S-protein agarose. Error bars indicate SEM.
FIGURE 5:
FIGURE 5:
Lipid droplet biogenesis is dispensable for CD147 ERAD. (A) The Kennedy pathway of TAG synthesis indicating the enzymes (blue boxes) and metabolites. Select additional pathways that use acyl-CoA are also depicted. Approaches to disrupt LD biogenesis through the inhibition of ACSLs (triacsin C) or the DGAT enzymes (DGAT1i and DGAT2-/-) are indicated in red. (B) DGAT2-/- MEFs were pretreated with 1 µg/ml triacsin C or 20 µM DGAT1i for 3 h and then incubated with 200 µM oleate for 0 or 6 h as indicated. Fluorescence microscopy was employed to visualize LDs (green) and nuclei (blue). Scale bar, 5 µm. (C) The abundance of LDs was quantified from cells treated as shown in B. Asterisk indicates a significant increase in LD amount relative to untreated cells (p < 0.05). (D) DGAT2-/- MEFs were pretreated with vehicle, 1 µg/ml triacsin C, or 20 µM DGAT1i for 16 h, followed by 75 µM emetine for the indicated times. CD147 levels were assessed by immunoblotting of SDS lysates. (E) The relative levels of CD147(CG) in D were quantified and are presented as percentage of the levels at time 0 h (n = 3). ACSL, long-chain acyl-CoA synthetase; AGPAT, acylglycerolphosphate acyltransferase; DAG, diacylglycerol; DGAT, diacylglycerol acyltransferase; GPAT, glycerol-phosphate acyltransferase; LPA, lysophosphatidic acid; PA, phosphatidic acid; PAP, phosphatidic acid phosphatase; TAG, triacylglycerol. Error bars indicate SEM.
FIGURE 6:
FIGURE 6:
Triacsin C alters the cellular lipid landscape. Targeted metabolomic analysis of the nonpolar metabolome of cells treated with 1 µg/ml triacsin C for 16 h revealed alterations in 71 lipid species, illustrated as a volcano plot (A) and a heat map organized by lipid class (B). Red text in B indicates a significant change (p < 0.05). (C–K) Quantification showing the relative levels of significantly altered lipids (n = 4 or 5). *p < 0.05, **p < 0.01. White bars, vehicle; black bars, triacsin C. (L) Pathway map depicting the general effects of triacsin C on neutral lipids and phospholipids. DAG, diacylglycerol; FFA, free fatty acid; MAG, monoacylglycerol; NAE, N-acylethanolamine; PA, phosphatidic acid; PC, phosphatidylcholine; PE phosphatidy­lethanolamine; PG, phosphatidy­lglycerol; PI, phosphatidylinositol; PS, phosphatidylserine; TAG, triacylglycerol. “L” before a lipid phospholipid designation indicates lyso-; “e” after a lipid designation indicates an ether lipid; “p” after a lipid designation designates plasmalogen. Error bars indicate SEM.
FIGURE 7:
FIGURE 7:
Triacsin C activates opposing arms of the UPR. (A) Reverse transcription PCR assay of XBP1 mRNA from HEK293 cells treated with 1 μg/ml triacsin C for the indicated times in the presence and absence of 100 µM IRE1 inhibitor 4μ8c (IRE1i). XBP1 amplicons were separated on an agarose gel and imaged. XBP1u, unspliced XBP1; XBP1s, spliced XBP1. (B) Quantification of the percentage of spliced XBP1 in A (n = 3). (C) HEK293 cells stably expressing a CHOP::GFP construct were treated with vehicle, 1 µg/ml triacsin C, or 5 µg/ml tunicamycin as indicated and GFP levels measured using flow cytometry. The fold change in GFP fluorescence relative to time 0 h is shown (n = 3). (D) HEK293 cells stably expressing a CHOP::GFP construct were treated with vehicle or 1 µg/ml triacsin C for 0 and 16 h in the presence and absence of 1 µM PERK inhibitor GSK2606414 (PERKi). GFP levels were measured using flow cytometry. The fold change in GFP fluorescence relative to time 0 h is shown (n = 3). (E) HEK293 cells were treated with 1 µg/ml triacsin C and vehicle, 100 µM IRE1i, or 1 µM PERKi for the indicated times and stained with propidium iodide to identify apoptotic cells. The percentage of apoptotic cells relative to time 0 h is shown (n = 3). (F) A model depicting the relationship between fatty acid metabolism and ER proteostasis. Disruptions in fatty acid metabolism result in lipid disequilibrium, causing impairments in ER quality control by inhibiting specific steps in ERAD (independent of LDs). The disruption in ER homeostasis activates the UPR, which protects cells via the PERK pathway and eventually kills cells via the IRE1 pathway. Error bars indicate SEM.

References

    1. Adeyo O, Horn PJ, Lee S, Binns DD, Chandrahas A, Chapman KD, Goodman JM. The yeast lipin orthologue Pah1p is important for biogenesis of lipid droplets. J Cell Biol. 2011;192:1043–1055. - PMC - PubMed
    1. Anand P, Cermelli S, Li Z, Kassan A, Bosch M, Sigua R, Huang L, Ouellette AJ, Pol A, Welte MA, et al. A novel role for lipid droplets in the organismal antibacterial response. Elife. 2012;1:e00003. - PMC - PubMed
    1. Anderson DJ, Le Moigne R, Djakovic S, Kumar B, Rice J, Wong S, Wang J, Yao B, Valle E, Kiss von Soly S, et al. Targeting the AAA ATPase p97 as an approach to treat cancer through disruption of protein homeostasis. Cancer Cell. 2015;28:653–665. - PMC - PubMed
    1. Baldridge RD, Rapoport TA. Autoubiquitination of the Hrd1 ligase triggers protein retrotranslocation in ERAD. Cell. 2016;166:394–407. - PMC - PubMed
    1. Banaszynski LA, Chen LC, Maynard-Smith LA, Ooi AG, Wandless TJ. A rapid, reversible, and tunable method to regulate protein function in living cells using synthetic small molecules. Cell. 2006;126:995–1004. - PMC - PubMed

Publication types