. 2016 Dec 5;215(5):631-647.
doi: 10.1083/jcb.201606081. Epub 2016 Nov 23.

GTSE1 tunes microtubule stability for chromosome alignment and segregation by inhibiting the microtubule depolymerase MCAK

Affiliations

GTSE1 tunes microtubule stability for chromosome alignment and segregation by inhibiting the microtubule depolymerase MCAK

Shweta Bendre et al. J Cell Biol. .

Abstract

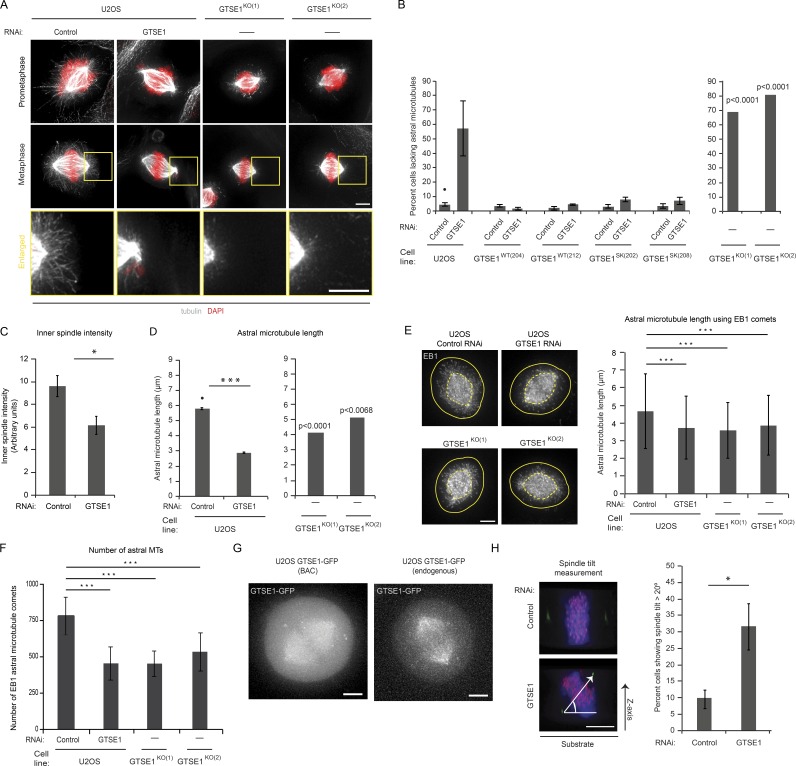
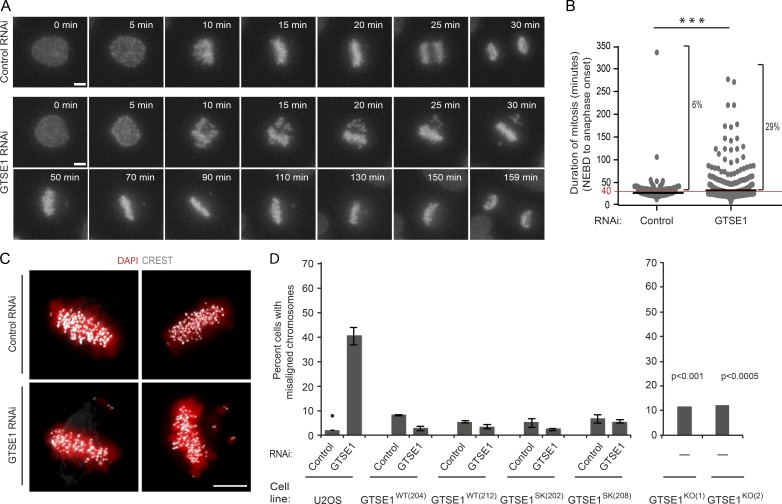
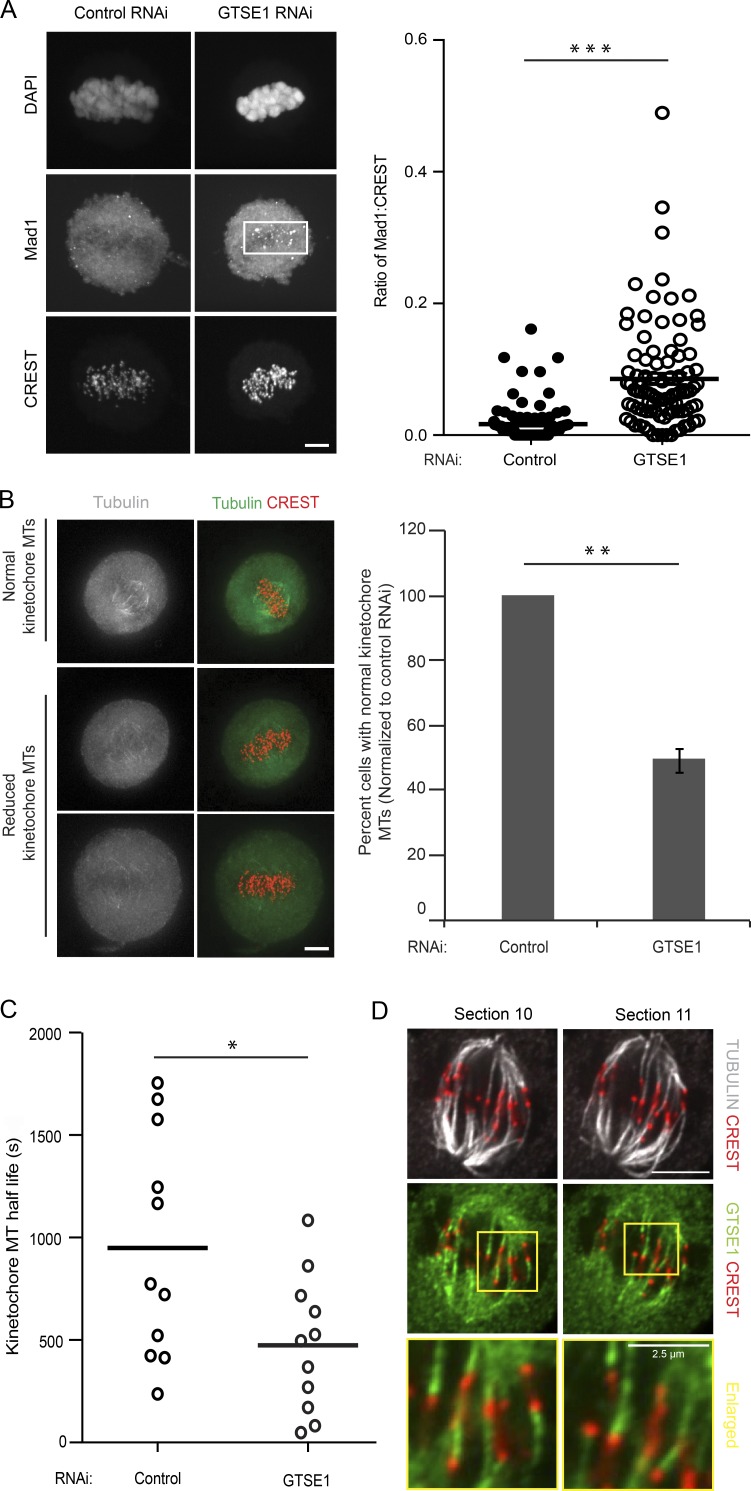
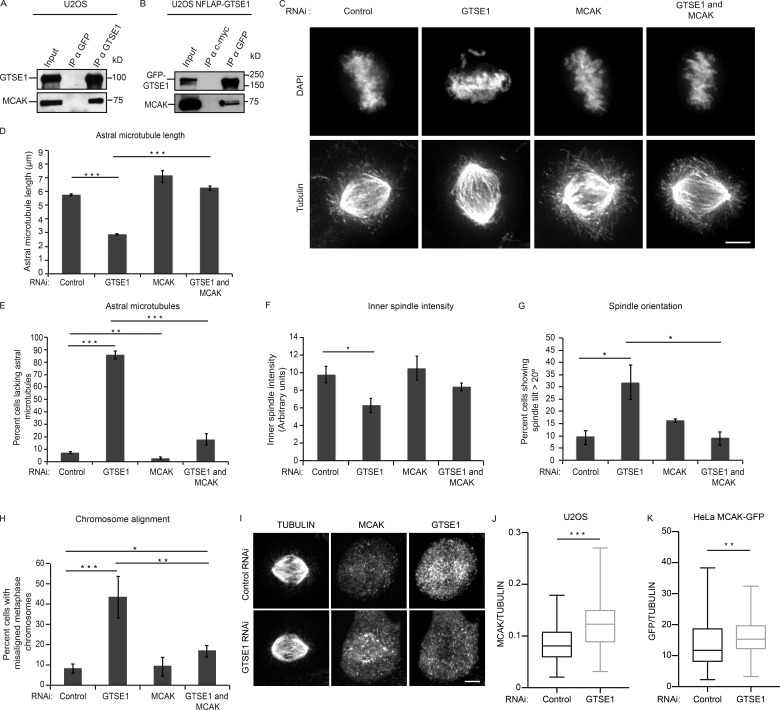
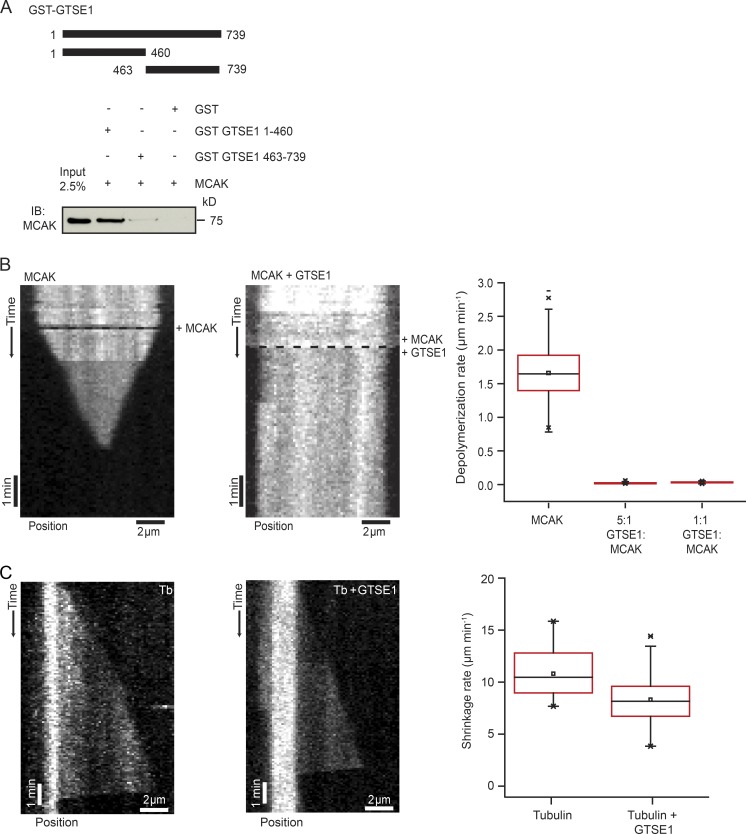
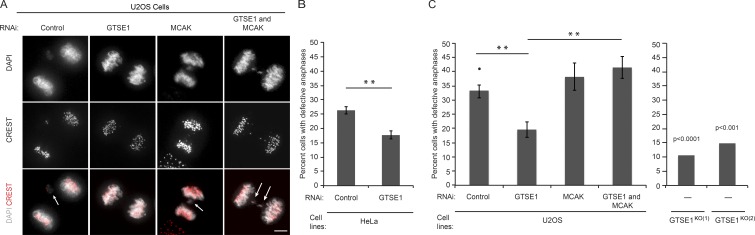
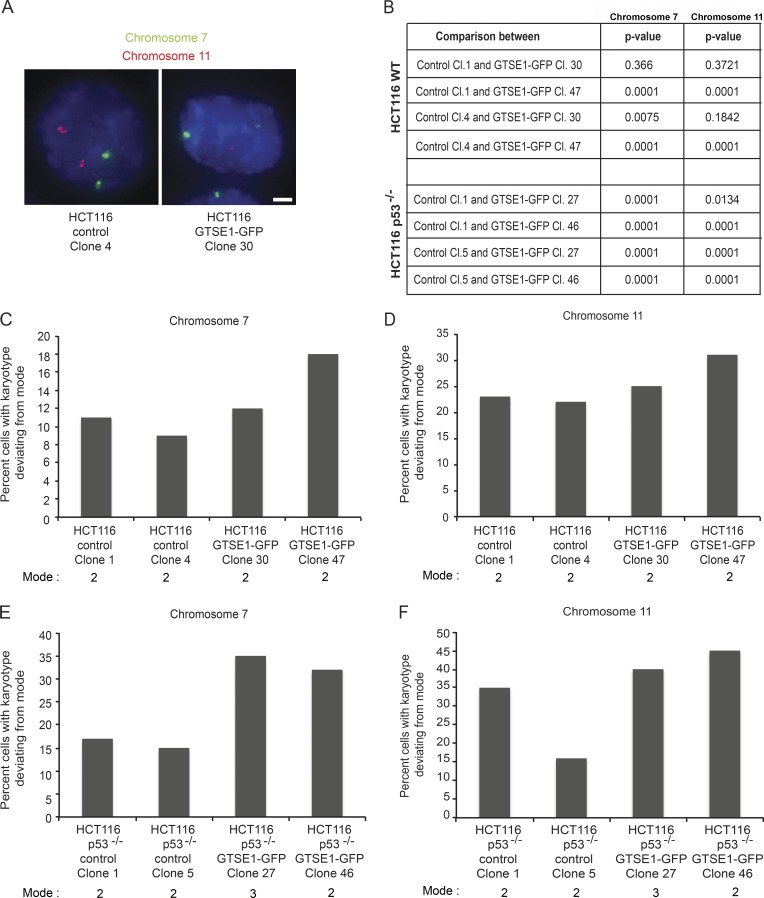
The dynamic regulation of microtubules (MTs) during mitosis is critical for accurate chromosome segregation and genome stability. Cancer cell lines with hyperstabilized kinetochore MTs have increased segregation errors and elevated chromosomal instability (CIN), but the genetic defects responsible remain largely unknown. The MT depolymerase MCAK (mitotic centromere-associated kinesin) can influence CIN through its impact on MT stability, but how its potent activity is controlled in cells remains unclear. In this study, we show that GTSE1, a protein found overexpressed in aneuploid cancer cell lines and tumors, regulates MT stability during mitosis by inhibiting MCAK MT depolymerase activity. Cells lacking GTSE1 have defects in chromosome alignment and spindle positioning as a result of MT instability caused by excess MCAK activity. Reducing GTSE1 levels in CIN cancer cell lines reduces chromosome missegregation defects, whereas artificially inducing GTSE1 levels in chromosomally stable cells elevates chromosome missegregation and CIN. Thus, GTSE1 inhibition of MCAK activity regulates the balance of MT stability that determines the fidelity of chromosome alignment, segregation, and chromosomal stability.


Figures

Figure 1.
Figure 1.
GTSE1 stabilizes MTs in mitosis and promotes correct spindle orientation. (A) Immunofluorescence images of U2OS cells after control RNAi, GTSE1 RNAi, and stable knockout of GTSE1 stained for DNA (DAPI) and MTs (tubulin) showing fewer astral MTs after reduced GTSE1 levels. (B) Quantification of the percentage of cells lacking astral MTs from immunofluorescence analysis as shown in A. The left graph shows control and GTSE1 RNAi in U2OS cells, two stable U2OS cell clones expressing RNAi-resistant GTSE1 (GTSE1WT(204) and GTSE1WT(212)), and two stable U2OS cell clones expressing RNAi-resistant GTSE1 mutated to abolish interaction with EB1 (GTSE1Sk(202) and GTSE1Sk(208)). n > 150 cells; 3 experiments per condition. The right graph shows two independent U2OS GTSE1 knockout clones. P-values were obtained from a χ2 test comparing against the U2OS control condition (marked with •). n > 100 cells. (C) Quantification of inner-spindle tubulin fluorescence intensity from fixed U2OS cells stained for α-tubulin after control or GTSE1 RNAi. n ≥ 19 per experiment per condition; 3 experiments. (D) Quantification of the mean length of astral MTs in three dimensions from immunofluorescence analysis as shown in A. 10 astral MTs were measured per cell. n = 10 cells per experiment per condition; 3 experiments. (E) Immunofluorescence images of U2OS cells after control RNAi, GTSE1 RNAi, and stable knockout of GTSE1 stained for EB1 showing fewer EB1 astral MT comets after GTSE1 RNAi. Graph shows quantification of astral MT length using the position of EB1 comets with respect to the centrosome. n > 5,800 astrals from 15 cells per condition; 1 experiment. P-values were obtained using a Kruskal-Wallis test followed by Conover-Iman test. (F) Quantification of the mean number of astral MTs per cell obtained by quantifying the number of EB1 comets in U2OS cells after control or GTSE1 RNAi and in GTSE1KO(1) and GTSE1KO(2) cells. n ≥ 13 cells per condition; 1 experiment. (E and F) Error bars represent standard deviation. P-values were obtained using an analysis of variance and a Tukey’s test. (G) Live-cell fluorescence images of metaphase U2OS cells expressing either BAC-expressed GTSE1-GFP (GTSE1WT(212)) or endogenously tagged GTSE1-GFP. Both constructs localize to the spindle. (H) Analysis of spindle orientation. Images of mitotic cells viewed from the side and stained for DNA (blue), kinetochores (red), and centrioles (green) depict a cell with normal spindle alignment parallel to the substrate (top) and a cell with defective orientation (bottom). The angle of spindle tilt was calculated by determining the angle between the substrate and a line connecting both centrosomes, as depicted. Quantification of the percentage of metaphase cells with a spindle tilt angle >20° is shown. n > 140 cells; 3 experiments per condition. Bars, 5 µm. All error bars represent SEM unless otherwise specified. *, P ≤ 0.05; ***, P ≤ 0.001.
Figure 2.
Figure 2.
GTSE1 is required for efficient chromosome alignment. (A) Still frames of mitoses from time-lapse videos (Videos 1 and 2) of U2OS cells expressing histone H2AFZ-mCherry after control (top row) or GTSE1 RNAi (bottom two rows). GTSE1-depleted cells require a longer time to align all chromosomes and enter anaphase. (B) Mitotic duration (nuclear envelope breakdown [NEBD] to anaphase onset) of individual cells is plotted from the analysis of videos of control or GTSE1 RNAi-treated U2OS histone H2AFZ-mCherry cells as are shown in A. GTSE1-depleted cells have a longer mean duration of mitosis (control RNAi: 28.4 ± 20.5 min, n = 269; GTSE1 RNAi: 42.5 ± 36.3 min, n = 295; black bars represent the mean) and a higher percentage of cells with mitotic durations longer than 40 min (5.9% of control-depleted cells vs. 29.2% of GTSE1-depleted cells). (C) Immunofluorescence images of chromosomes (red) and kinetochores (white) in fixed U2OS cells after control or GTSE1 RNAi. (D) Quantification of the percentage of cells with misaligned chromosomes from immunofluorescence analysis as shown in C. The left graph shows control or GTSE1 RNAi of U2OS cells, two stable U2OS cell clones expressing RNAi-resistant GTSE1 (GTSE1WT(204) and GTSE1WT(212)), and two stable U2OS cell clones expressing RNAi-resistant GTSE1 mutated to abolish interaction with EB1 (GTSE1Sk(202) and GTSE1Sk(208)). n > 150 cells; 3 experiments per condition. The right graph shows two independent U2OS GTSE1 knockout clones. P-values were obtained from a χ2 test comparing against the U2OS control condition (marked with •). n > 100 cells. Error bars represent SEM. Bars, 5 µm. ***, P ≤ 0.001.
Figure 3.
Figure 3.
GTSE1 localizes to kinetochore MTs and stabilizes kinetochore–MT attachments. (A) Representative immunofluorescence images of metaphase U2OS cells stained with DAPI (DNA), MAD1, and CREST showing MAD1 accumulation on kinetochores after GTSE1 RNAi. Cells were blocked using Cdk1 inhibitor (RO-3306) and released for 1 h in normal media to enrich the number of metaphase mitotic cells. The white box indicates the region with Mad1-positive kinetochores. n > 90 cells; 3 independent experiments. (B) Fewer GTSE1-depleted cells contain cold-stable MTs than control-depleted cells. Images show mitotic cells fixed after cold treatment and stained for tubulin and kinetochores. The graph shows the proportion of cells containing a full complement of cold-stable MTs after cold treatment, after control cells were normalized to 100%. The cells were blocked using Cdk1 inhibitor (RO-3306) and released for 1 h in normal media to enrich the number of metaphase mitotic cells. n > 100 cells per experiment; 3 experiments per condition. (C) Graph showing kinetochore MT half-life in control or GTSE1-depleted U2OS cells expressing PA GFP-tubulin (Fig. S3). Each circle represents the kinetochore MT half-life of a single cell; bars represent the mean. n = 11 cells; 3 experiments per condition. (D) Representative immunofluorescence images (slices 10 and 11 from Videos 3 and 4) showing GTSE1 decorating K-fibers in U2OS cells expressing BAC-based GTSE1-LAP after cold treatment. The cells were stained for GTSE1, kinetochores (CREST), and MTs (tubulin). All error bars represent SEM. Bars, 5 µm (unless stated otherwise). *, P ≤ 0.05; **, P ≤ 0.01; ***, P ≤ 0.001.
Figure 4.
Figure 4.
Mitotic defects after GTSE1 depletion are dependent on the activity of the MT depolymerase MCAK. (A) MCAK coimmunoprecipitates with GTSE1. Western blot after immunoprecipitation (IP) from U2OS cell lysates using either anti-GTSE1 or anti-GFP antibodies and probing with anti-GTSE1 or anti-MCAK antibodies. (B) Western blot after immunoprecipitation from U2OS NFLAP-GTSE1 cell lysates using either anti-GFP or anti–c-myc antibodies and probing with anti-GFP or anti-MCAK antibodies. (C) Immunofluorescence images of mitotic U2OS cells after control, GTSE1, MCAK, or combined GTSE1 and MCAK RNAi, stained for DNA (DAPI) and MTs (tubulin). (D) Quantification of the mean length of astral MTs in three dimensions from immunofluorescence analysis as shown in C. 10 astral MTs were measured per cell. n = 10 cells per experiment; 3 experiments per condition. (E) Quantification of the percentage of cells lacking astral MTs from immunofluorescence analysis as shown in C. n > 100 cells per experiment; 3 experiments per condition. (F) Quantification of inner spindle tubulin fluorescence intensity from immunofluorescence analysis as shown in C. n ≥ 19 per experiment; 3 experiments per condition. (G) Analysis of spindle orientation. Quantification of the percentage of metaphase cells with a spindle tilt angle of >20° is shown for each RNAi condition. n > 140 cells; 4 experiments per condition. (H) Quantification of the percentage of cells with misaligned chromosomes from immunofluorescence analysis as shown in C. n > 100 cells per experiments; 3 experiments per condition. (I) Immunofluorescence images of mitotic U2OS cells showing MCAK localization after control and GTSE1 RNAi. Cells were stained for MCAK, GTSE1, and MTs (tubulin). (J) Quantification of MCAK intensity on the inner spindle normalized to tubulin intensity in U2OS cells using immunofluorescence images after control and GTSE1 RNAi. n ≥ 105 cells; 3 independent experiments. P-values were obtained using a Mann-Whitney U test. (K) Quantification of MCAK intensity using GFP fluorescence on the inner spindle normalized to tubulin intensity in HeLa cells expressing BAC-based MCAK-GFP using immunofluorescence images after control and GTSE1 RNAi. n ≥ 89 cells; 3 independent experiments. P-values were obtained using a Mann-Whitney U test. Bars, 5 µm. All error bars represent SEM. *, P ≤ 0.05; **, P ≤ 0.01; ***, P ≤ 0.001.
Figure 5.
Figure 5.
GTSE1 interacts directly with MCAK and inhibits its MT depolymerase activity in vitro. (A) Immunoblot (IB) showing MCAK pulled down in an in vitro GST pulldown using GST alone, GST-GTSE1 1–460, and GST-GTSE1 463–739 fragments. Input represents 2.5% of total MCAK protein used for the GST pulldown assay. (B) Kymograph depicting 50 nM MCAK depolymerizing a GMPCPP-stabilized MT (Video 5). The black dashed line represents the start of the experiment when MCAK was added. The second kymograph depicts a GMPCPP-stabilized MT maintaining constant length in the presence of 50 nM MCAK plus 250 nM GTSE1 (Video 6). The black dashed line represents the start of the experiment when MCAK and GTSE1 were added. Depolymerization rates of GMPCPP-stabilized MTs in the presence of 50 nM MCAK alone, 50 nM MCAK with a fivefold excess of GTSE1, and 50 nM MCAK with an equimolar amount of GTSE1 are shown in the box plot. n > 100 MTs; 4 experiments. (C) Kymographs of MT growth and catastrophe in the presence of 20 µM tubulin (Tb) alone or 20 µM tubulin and 250 nM GTSE1 from GMPCPP-MT seeds. Box plot shows the shrinkage rate after catastrophe of 20 µM tubulin alone and 20 µM tubulin with 250 nM GTSE1. n = 34 and 90 MTs, respectively.
Figure 6.
Figure 6.
Reduction of GTSE1 levels reduces anaphase chromosome segregation defects in HeLa and U2OS cells. (A) Immunofluorescence images of anaphase U2OS cells after control, GTSE1, MCAK, or GTSE1 and MCAK siRNA stained for DNA (DAPI) and kinetochores (CREST). White arrows indicate anaphase segregation defects. (B) Quantification of the percentage of anaphase HeLa cells with defective anaphase chromosome segregation events. n > 390 per condition; 3 experiments. (C) Quantification of the percentage of anaphase U2OS cells with defective anaphase chromosome segregation events from immunofluorescence analysis as shown in A. The left graph shows U2OS cells after RNAi conditions as in A. n > 65 per experiment; 3 experiments per condition. The right graph shows two independent U2OS GTSE1 knockout clones. P-values were obtained from a χ2 test comparing against the U2OS control condition (marked with •). n > 100 cells. **, P ≤ 0.01.
Figure 7.
Figure 7.
Overexpression of GTSE1 induces segregation defects in HCT116 cells. (A) Representative Western blots of cell lysates from U2OS, HeLa, and HCT116 and HCT116 p53−/− control and GFP-GTSE1–expressing clonal cell lines used for analysis in C and D. Blots were probed with anti-GTSE1, anti-TACC3, and anti–α-tubulin. The graph represents quantification of GTSE1 protein levels normalized to tubulin levels from the blot shown. The relative abundance of total GTSE1 protein was quantified and normalized to tubulin levels. (B) Low and high intensity immunofluorescence images of HCT116 control and GTSE1-GFP–overexpressing clones showing normal spindle morphology stained for DNA (DAPI), GTSE1, and MTs (tubulin). (C) Quantification of the percentage of anaphase cells with lagging chromosomes for control or GTSE1-GFP–expressing HCT116 clones. n ≥ 99. (D) Quantification of the percentage of anaphase cells with lagging chromosomes for control or GTSE1-GFP–expressing HCT116 p53−/− clones. n ≥ 104. P-values were obtained from χ2 tests comparing control clones (designated by •). Bar, 5 µm. **, P ≤ 0.01.
Figure 8.
Figure 8.
Overexpression of GTSE1 induces CIN in HCT116 cells. (A) Fluorescence images from fixed control or GTSE1-GFP–overexpressing clonal HCT116 cells processed for FISH. Probes for α-satellite regions on chromosomes 7 (green) and 11 (red) are shown and were used to count the number of copies of each chromosome in cells. Bar, 5 µm. (B) Statistically significant values from comparing deviances from the modal number of chromosomes in control versus GTSE1-GFP–overexpressing HCT116 cells from data presented in C–F. P-values were determined from χ2 analysis comparing the indicated clonal cell lines. (C) Percentage of HCT116 control or GFP-GTSE1–expressing clonal cell lines containing numbers of chromosome 7 deviating from the mode. n > 980 cells for each condition. (D) Percentage of HCT116 control or GFP-GTSE1–expressing clonal cell lines containing numbers of chromosome 11 deviating from the mode. n > 980 cells for each condition. (E) Percentage of HCT116 p53−/− control or GFP-GTSE1–expressing clonal cell lines containing numbers of chromosome 7 deviating from the mode. n > 1,000 cells for each condition. (F) Percentage of HCT116 p53−/− control or GFP-GTSE1–expressing clonal cell lines containing numbers of chromosome 11 deviating from the mode. n > 1,000 cells for each condition.

References

    1. Andrews P.D., Ovechkina Y., Morrice N., Wagenbach M., Duncan K., Wordeman L., and Swedlow J.R.. 2004. Aurora B regulates MCAK at the mitotic centromere. Dev. Cell. 6:253–268. 10.1016/S1534-5807(04)00025-5 - DOI - PubMed
    1. Asteriti I.A., Rensen W.M., Lindon C., Lavia P., and Guarguaglini G.. 2010. The Aurora-A/TPX2 complex: a novel oncogenic holoenzyme? Biochim. Biophys. Acta. 1806:230–239. - PubMed
    1. Bakhoum S.F., Genovese G., and Compton D.A.. 2009a Deviant kinetochore microtubule dynamics underlie chromosomal instability. Curr. Biol. 19:1937–1942. 10.1016/j.cub.2009.09.055 - DOI - PMC - PubMed
    1. Bakhoum S.F., Thompson S.L., Manning A.L., and Compton D.A.. 2009b Genome stability is ensured by temporal control of kinetochore-microtubule dynamics. Nat. Cell Biol. 11:27–35. 10.1038/ncb1809 - DOI - PMC - PubMed
    1. Bakhoum S.F., Silkworth W.T., Nardi I.K., Nicholson J.M., Compton D.A., and Cimini D.. 2014. The mitotic origin of chromosomal instability. Curr. Biol. 24:R148–R149. 10.1016/j.cub.2014.01.019 - DOI - PMC - PubMed