. 2017 Jan;58(1):42-59.
doi: 10.1194/jlr.M068676. Epub 2016 Nov 23.

Localization of 1-deoxysphingolipids to mitochondria induces mitochondrial dysfunction

Affiliations

Localization of 1-deoxysphingolipids to mitochondria induces mitochondrial dysfunction

Irina Alecu et al. J Lipid Res. 2017 Jan.

Abstract

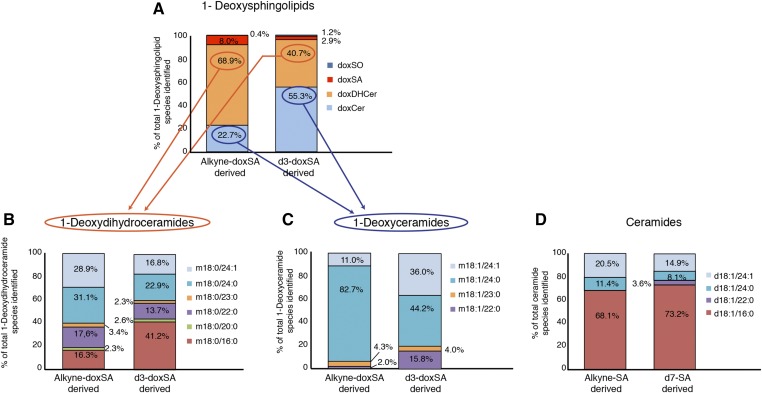
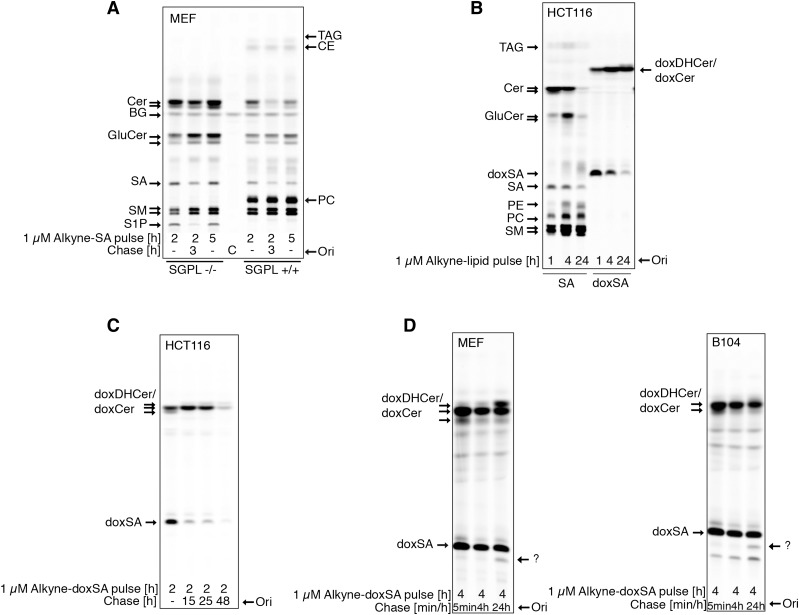
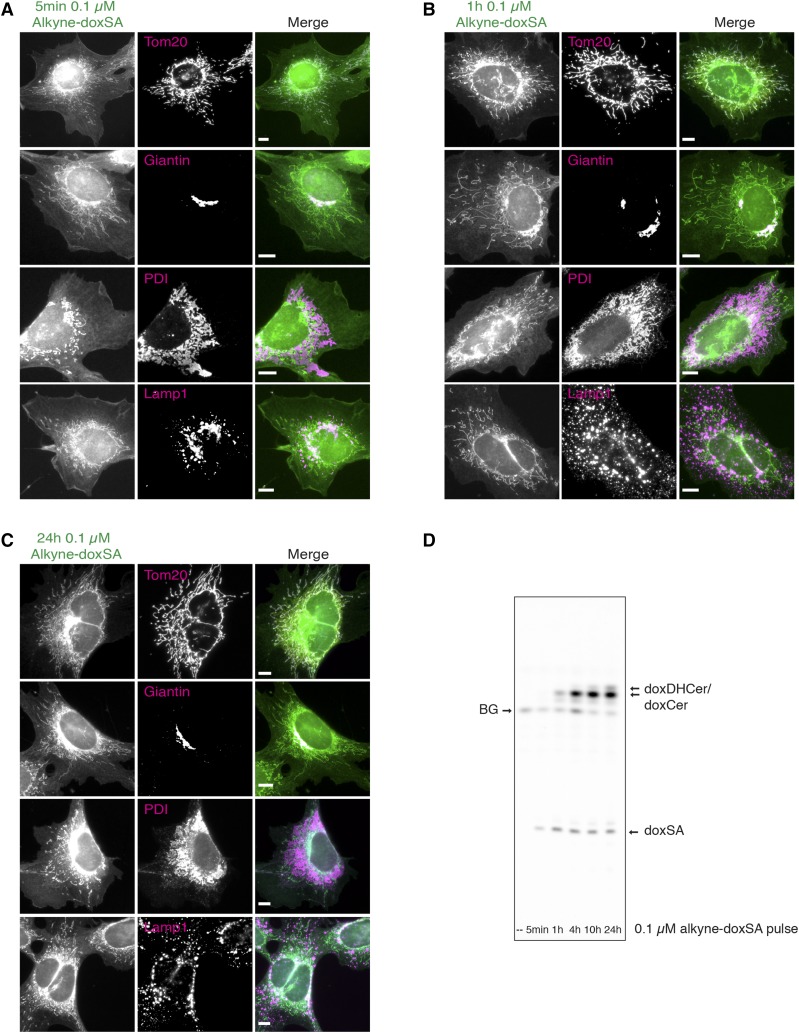
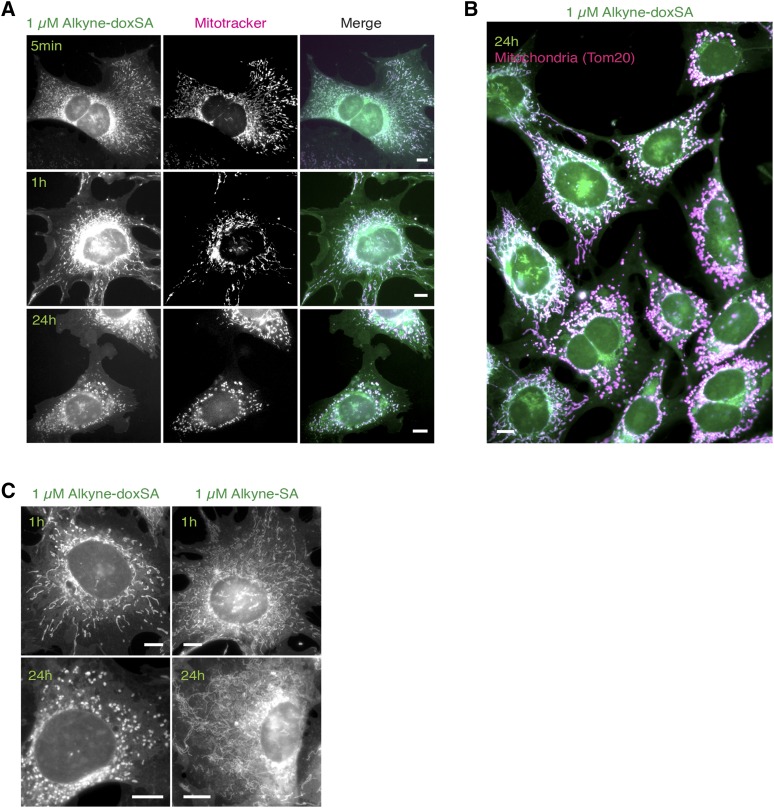
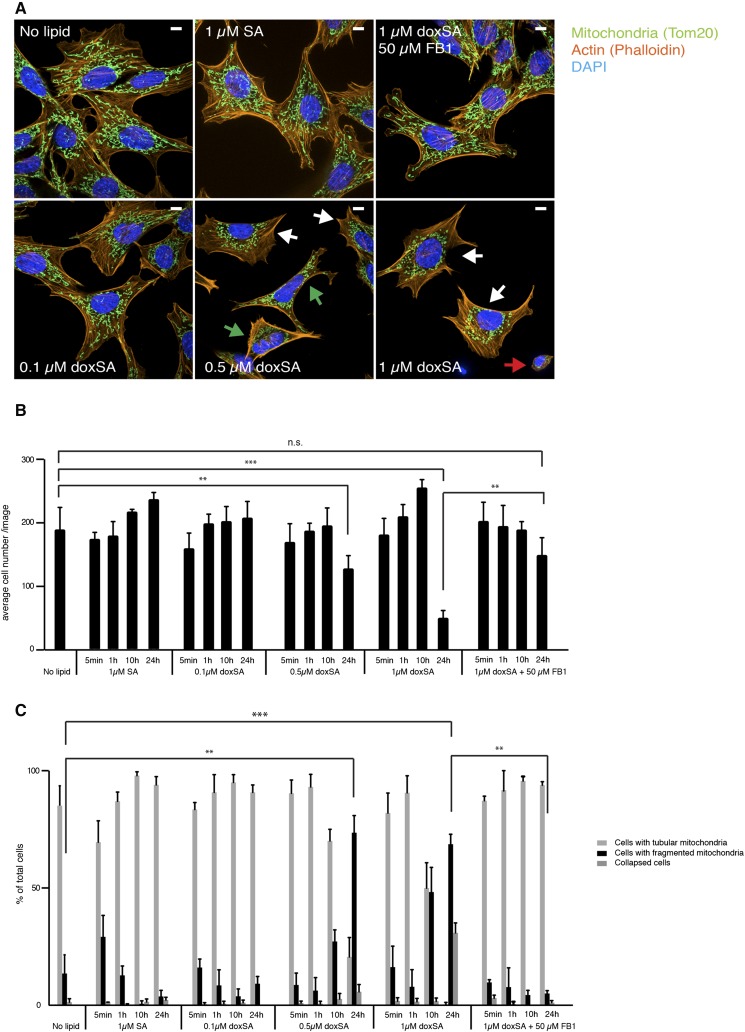
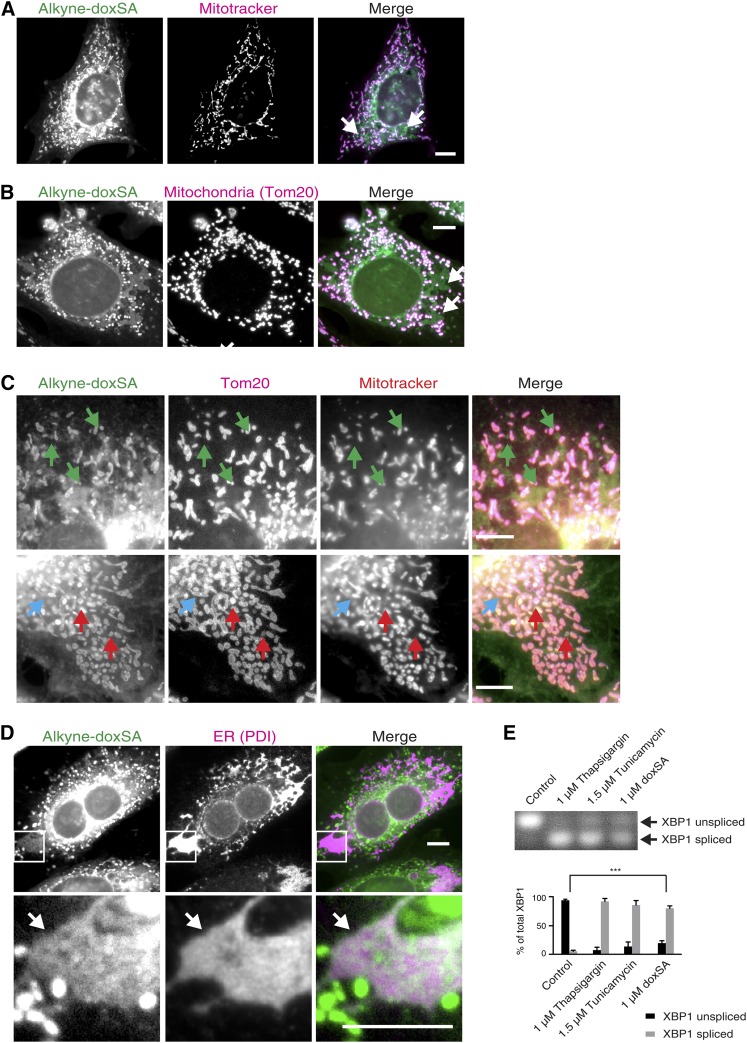
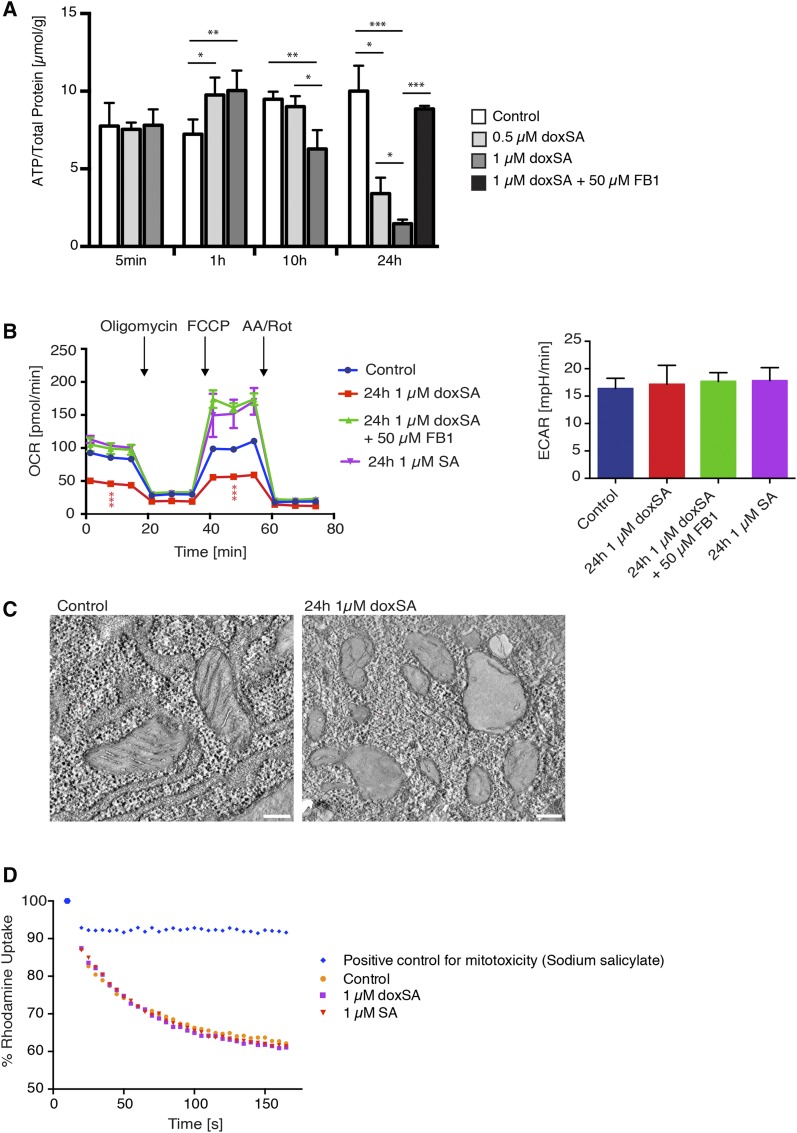
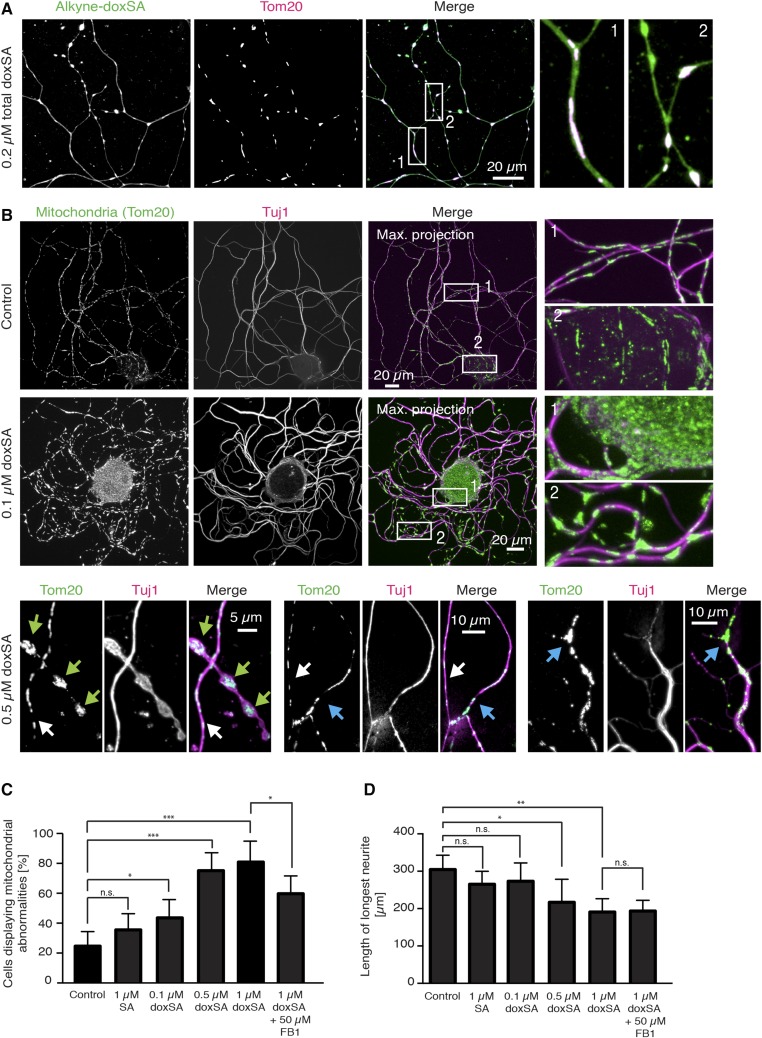
1-Deoxysphingolipids (deoxySLs) are atypical sphingolipids that are elevated in the plasma of patients with type 2 diabetes and hereditary sensory and autonomic neuropathy type 1 (HSAN1). Clinically, diabetic neuropathy and HSAN1 are very similar, suggesting the involvement of deoxySLs in the pathology of both diseases. However, very little is known about the biology of these lipids and the underlying pathomechanism. We synthesized an alkyne analog of 1-deoxysphinganine (doxSA), the metabolic precursor of all deoxySLs, to trace the metabolism and localization of deoxySLs. Our results indicate that the metabolism of these lipids is restricted to only some lipid species and that they are not converted to canonical sphingolipids or fatty acids. Furthermore, exogenously added alkyne-doxSA [(2S,3R)-2-aminooctadec-17-yn-3-ol] localized to mitochondria, causing mitochondrial fragmentation and dysfunction. The induced mitochondrial toxicity was also shown for natural doxSA, but not for sphinganine, and was rescued by inhibition of ceramide synthase activity. Our findings therefore indicate that mitochondrial enrichment of an N-acylated doxSA metabolite may contribute to the neurotoxicity seen in diabetic neuropathy and HSAN1. Hence, we provide a potential explanation for the characteristic vulnerability of peripheral nerves to elevated levels of deoxySLs.

Keywords: ES-285; chemical synthesis; diabetes; inborn errors of metabolism; lipids/chemistry; metabolic syndrome; mitotoxicity; neurons; peripheral neuropathy; sphingolipids.


Figures

Fig. 1.
Fig. 1.
Alkyne-(deoxy)sphingoid bases are converted to the same downstream metabolites as their deuterated counterparts. LC/MS analysis of the downstream metabolism of the sphingoid base probes is shown. MEF cells were treated for 24 h either with alkyne-doxSA and d3-doxSA or with alkyne-SA and d7-SA. The proportion of each labeled downstream lipid is shown as the percentage of the total amount of the labeled lipid species identified. A: Alkyne- and d3-labeled deoxySL-classes detected. Please note that doxCers comprise only part of the deoxySLs made downstream of the doxSA precursors after a 24 h incubation. The rest of the label is present in the saturated forms doxDHCer and the free doxSA and doxSO sphingoid bases. B: N-acylation patterns of alkyne-doxSA and d3-doxSA-derived doxDHCer species. C: N-acylation patterns of alkyne-doxSA and d3-doxSA-derived doxCer species. D: N-acylation patterns of alkyne-SA and d7-SA-derived ceramide species. Please note that no labeled DHCer species were detectable after a 24 h incubation with either alkyne-SA or d7-SA. Ceramide nomenclature: d (dihydroxy-sphingoid base) or m (monohydroxy-sphingoid base); number of C-atoms in sphingoid base; :number of double bonds in sphingoid base; / number of C-atoms in N-acyl fatty acid; : number of double bonds in N-acyl fatty acid.
Fig. 2.
Fig. 2.
DeoxySLs are not recycled to canonical sphingolipids or fatty acids. Metabolic tracing of alkyne-doxSA and alkyne-SA by click fluorescence TLC. A: MEF WT or MEF S1P lyase−/− cells were treated with 1 μM alkyne-SA. Note that the alkyne signal is restricted to sphingolipids in MEF S1P lyase−/− cells, but also appears in glycerolipids in MEF WT cells. B. HCT116 cells were treated with 1 μM alkyne-SA or 1 μM alkyne-doxSA. Note that the alkyne signal of alkyne-doxSA was not detected in any canonical sphingolipids or glycerolipids. C: HCT116 cells were given a short pulse of 1 μM alkyne-doxSA for 2 h, followed by a chase up to 48 h in nonsupplemented growth medium. Note that the total alkyne signal decreased with prolonged chase times. D: MEF and B104 cells were treated with 1 μM alkyne-doxSA for 4 h, followed by a chase up to 24 h in nonsupplemented medium. The arrows indicate an alkyne signal that runs in a band at the height of SA after a 24 h chase, indicating a possible hydroxylated derivate of doxSA. Because of the lack of alkyne signal appearing in canonical sphingolipids or glycerolipids, it can be excluded that the hydroxylation would be at the C1 position. Please note that sphingolipid classes such as ceramides, glucosylceramides, and sphingomyelins run on the TLC according to the N-acyl fatty acid attached. Hence, most often, two bands (long-chain versus very-long-chain N-acyl metabolites) can be separated on the TLC. BG, background; C, control; CE, cholesterolester; Cer, ceramide; GluCer, glucosylceramide; Ori, origin; SM, sphingomyelin.
Fig. 3.
Fig. 3.
Exogenous alkyne-doxSA localizes to mitochondria. Subcellular tracking of alkyne-doxSA by fluorescence microscopy. MEF cells were treated with a nontoxic concentration of 0.1 μM alkyne-doxSA for 5 min (A), 1 h (B), or 24 h (C). After treatment for the indicated times, cells were fixed and immunostained for organelle protein markers (magenta), the alkyne moiety was reacted with ASTM-BODIPY (green), and the cells analyzed by fluorescence microscopy. Scale bars, 10 μm. D: Analysis of the metabolic fate of the alkyne probe by click-fluorescence TLC. BG, background.
Fig. 4.
Fig. 4.
Exogenous alkyne-doxSA, but not alkyne-SA, treatment induces mitochondrial fragmentation. Subcellular tracking of toxic concentrations of alkyne-doxSA by fluorescence microscopy is shown. Scale bars, 10 μm. A: MEF cells were treated with 1 μM alkyne-doxSA for 5 min, 1 h, or 24 h. Mitochondria were stained by using mitotracker CMXRos (magenta); cells were fixed, and the alkyne moiety was reacted with ASTM-BODIPY (green). B: MEF cells were incubated for 24 h with 1 μM alkyne-doxSA. Cells were fixed and costained for the mitochondrial marker Tom20 (magenta) and the alkyne moiety was reacted with ASTM-BODIPY (green). C: MEF cells were treated for 1 or 24 h with either 1 μM alkyne-doxSA or 1 μM alkyne-SA before fixation and detection of the alkyne label with ASTM-BODIPY.
Fig. 5.
Fig. 5.
Mitochondrial fragmentation upon doxSA treatment depends on functional CerSs. MEF cells were treated for the indicated times with different concentrations of unlabeled doxSA or SA before fixation and staining of mitochondria (Tom20; green), actin filaments (Phalloidin; orange), and nucleus (DAPI; blue). Data are presented as average ± SD. * P < 0.05; ** P < 0.01; *** P < 0.001. A: Representative images of cells showing normal mitochondrial morphology, fragmenting (green arrows) and fragmented (white arrows) mitochondria, or a collapsed cellular phenotype with little visible cytoplasm around the nucleus (red arrow). Scale bar, 10 μm. B: Average cell number per image. C: Quantification of cells with normal mitochondria, fragmented mitochondria, or cells with collapsed actin filaments. n.s., not significant.
Fig. 6.
Fig. 6.
Long-term incubation with alkyne-doxSA at toxic concentrations leads to prominent alkyne-positive ER structures and ER stress. MEF cells were treated for 24 h with 1 μM alkyne-doxSA. After fixation, the alkyne moiety was reacted with ASTM-BODIPY (green). Scale bars, 10 μm. Please note that unidentified alkyne-positive structures (white arrows) appear (after the long doxSA incubation at a toxic concentration), which do not colocalize with mitochondrial membrane-dependent Mitotracker staining (magenta) (A) or with the mitochondrial marker protein Tom20 (magenta) (B). C: Triple stainings show some mitochondria (Tom20-positive; magenta) that were alkyne-positive (green), but did not take up the Mitotracker stain (red), indicating total loss of the membrane potential (red arrows). In contrast, a blue arrow marks a mitochondrium (Tom20-positive; magenta), that took up neither the alkyne lipid (green) nor the Mitotracker stain (red), whereas green arrows indicate alkyne-positive structures of unknown origin that are not hyperfragmented mitochondria. D: Further immunofluorescence costainings show colocalization of the unidentified alkyne-positive (green) structures (white arrow) with the ER protein PDI (magenta). Please note that, because of the very prominent alkyne staining in mitochondria, alkyne staining in ER appears less bright, although highly specific. E: To probe for induction of ER stress, MEF cells were treated for 24 h with 1 μM doxSA, and alternative splicing of the ER stress marker XBP1 was analyzed, showing that, apart from mitochondrial hyperfragmentation, doxSA toxicity leads to ER stress. Data are presented as average ± SD. *** P < 0.001.
Fig. 7.
Fig. 7.
Mitochondrial fragmentation upon doxSA treatment is characterized by a reduction of cellular ATP levels, reduced mitochondrial respiratory capacity, and loss of internal mitochondrial cristae structures. A: MEF cells were treated for the indicated times with different doxSA concentrations and FB1 before lysis and measurement of cellular ATP levels. Data are presented as average ± SD. B: MEF cells were treated for 24 h with 1 μM doxSA, 1 μM doxSA + 50 μM FB1, or 1 μM SA, respectively, before analysis of glycolysis rate, mitochondrial respiration, and maximal respiration capacity. OCR, oxygen consumption rate. Data are presented as average ± SD. C: MEF cells were treated for 24 h with 1 μM doxSA, before fixation and analysis of mitochondrial structures by electron microscopy. Scale bars, 200 nm. D: Mitochondria were isolated from MEF cells and incubated in vitro with 1 μM doxSA, 1 μM doxSA + FB1, or 1 μM SA. Uptake of rhodamine 123 was analyzed to measure mitochondrial membrane potential. * P < 0.05; ** P < 0.01; *** P < 0.001.
Fig. 8.
Fig. 8.
Exogenous doxSA-treatment leads to swollen spherical mitochondria in primary DRG neurons. A: DRG neurons were cultured for 2 h and treated for further 22 h with a mixture of alkyne-doxSA and unlabeled doxSA (total 0.2 μM). After fixation, the cells were stained for mitochondria (Tom20; magenta) and the alkyne moiety was reacted with ASTM-BODIPY (green). Alkyne-doxSA was taken up by the neurons and localized to mitochondria. B: DRG neurons were cultured for 2 h and treated for further 22 h with the indicated concentrations of unlabeled doxSA. Cells were fixed and stained for mitochondria (green) and the neuron-specific β III-tubulin variant tuj1 (magenta). Whereas mitochondria in control-treated DRG neurites appeared fine and “streak-like,” treatment with as little as 0.1 μM doxSA induced swelling of the mitochondria. Higher concentrations led to grossly swollen spherical mitochondria (green arrows) and irregularly distributed mitochondria and axonal degeneration in affected neurites (blue arrows) versus not-affected neurites (white arrows). Please note that images in this figure are optical sections performed using the apotome mode or, if indicated, maximum projections of z-stacks of optical sections. C and D: DRG neurons were cultured for 2 h and treated for a further 22 h with the indicated lipids. Cells were fixed and stained for mitochondria and the neuron-specific β III-tubulin variant tuj1 and quantified for mitochondrial morphology (C) and axonal outgrowth (D). Data are presented as average ± SD. * P < 0.05; ** P < 0.01; *** P < 0.001. n.s., not significant.

References

    1. Zitomer N. C., Mitchell T., Voss K. A., Bondy G. S., Pruett S. T., Garnier-Amblard E. C., Liebeskind L. S., Park H., Wang E., Sullards M. C., et al. . 2009. Ceramide synthase inhibition by fumonisin B1 causes accumulation of 1-deoxysphinganine: a novel category of bioactive 1-deoxysphingoid bases and 1-deoxydihydroceramides biosynthesized by mammalian cell lines and animals. J. Biol. Chem. 284: 4786–4795. - PMC - PubMed
    1. Penno A., Reilly M. M., Houlden H., Laura M., Rentsch K., Niederkofler V., Stoeckli E. T., Nicholson G., Eichler F., Brown R. H. Jr., et al. . 2010. Hereditary sensory neuropathy type 1 is caused by the accumulation of two neurotoxic sphingolipids. J. Biol. Chem. 285: 11178–11187. - PMC - PubMed
    1. Houlden H., King R., Blake J., Groves M., Love S., Woodward C., Hammans S., Nicoll J., Lennox G., O’Donovan D. G., et al. . 2006. Clinical, pathological and genetic characterization of hereditary sensory and autonomic neuropathy type 1 (HSAN I). Brain. 129: 411–425. - PubMed
    1. Bejaoui K., Wu C., Scheffler M. D., Haan G., Ashby P., Wu L., de Jong P., and Brown R. H. Jr. 2001. SPTLC1 is mutated in hereditary sensory neuropathy, type 1. Nat. Genet. 27: 261–262. - PubMed
    1. Dawkins J. L., Hulme D. J., Brahmbhatt S. B., Auer-Grumbach M., and Nicholson G. A.. 2001. Mutations in SPTLC1, encoding serine palmitoyltransferase, long chain base subunit-1, cause hereditary sensory neuropathy type I. Nat. Genet. 27: 309–312. - PubMed

Publication types

MeSH terms