Clinical Trial
. 2016 Nov 24:6:37295.
doi: 10.1038/srep37295.

Systemic and mucosal immune responses following oral adenoviral delivery of influenza vaccine to the human intestine by radio controlled capsule

Affiliations
Clinical Trial

Systemic and mucosal immune responses following oral adenoviral delivery of influenza vaccine to the human intestine by radio controlled capsule

Leesun Kim et al. Sci Rep. .

Abstract

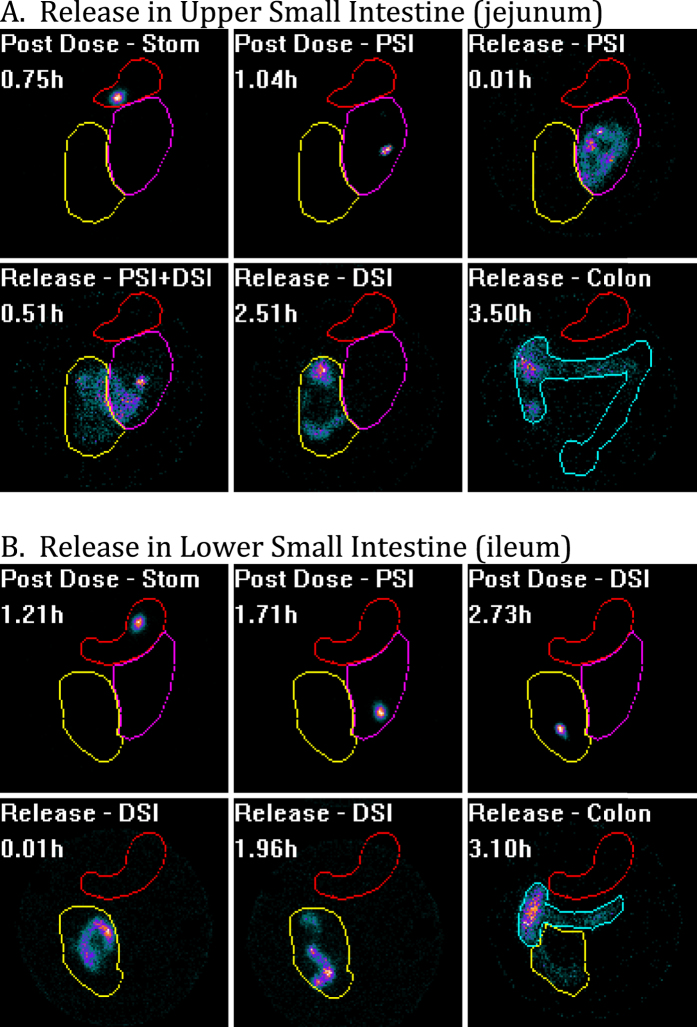
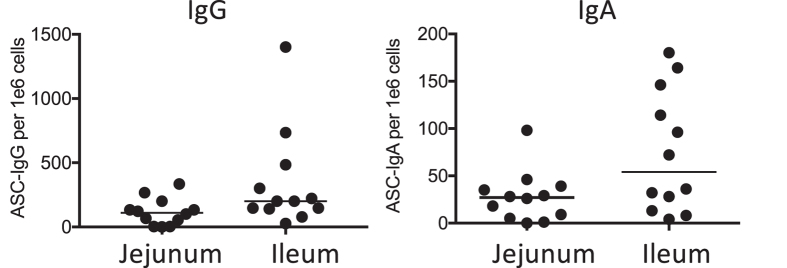
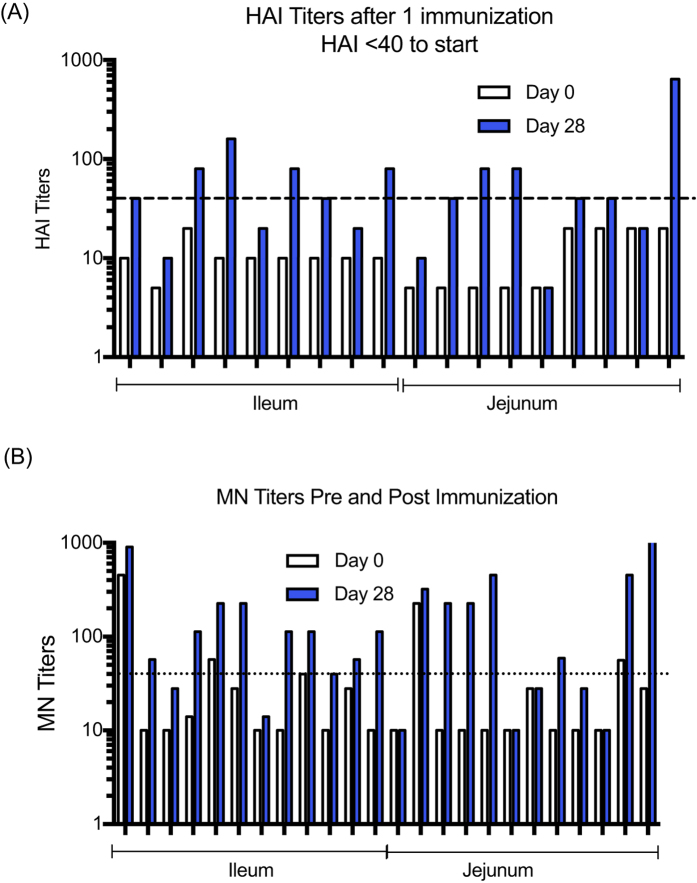
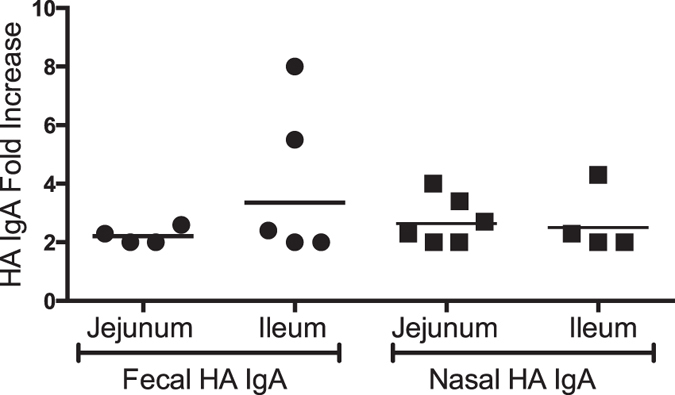
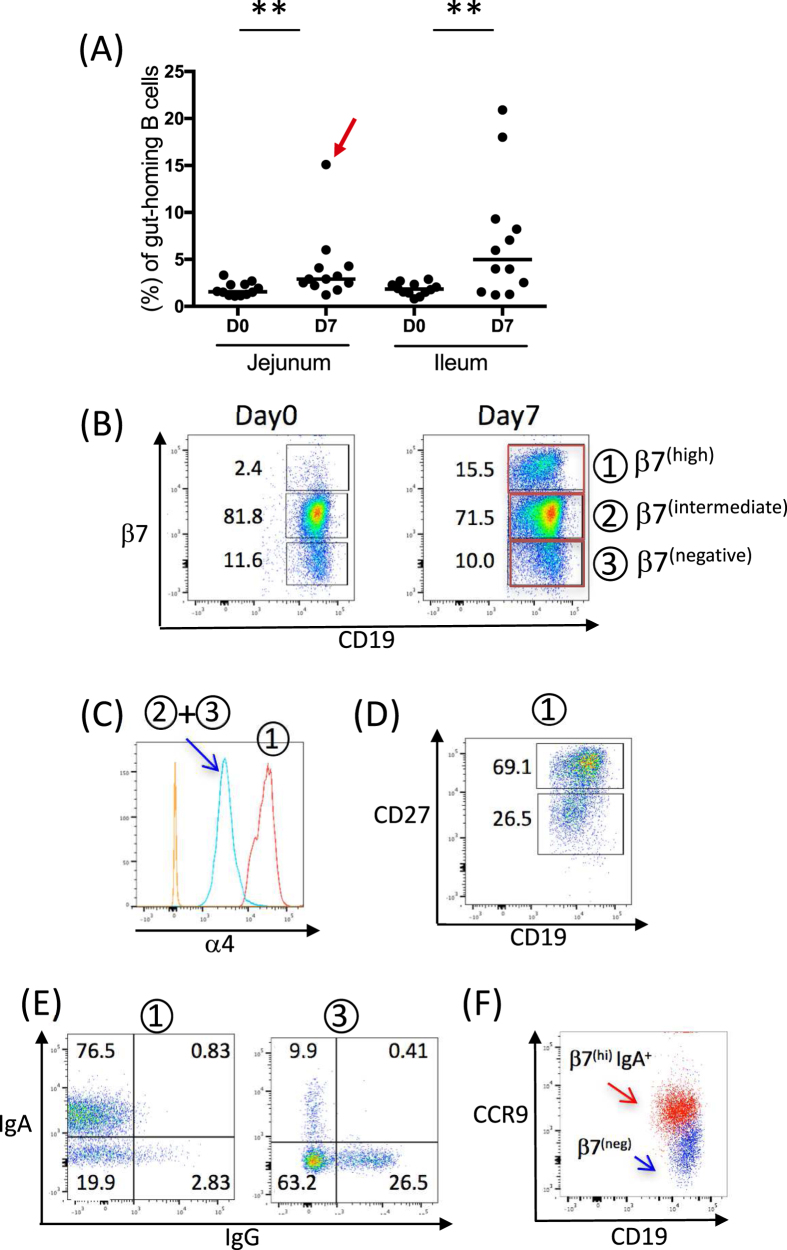
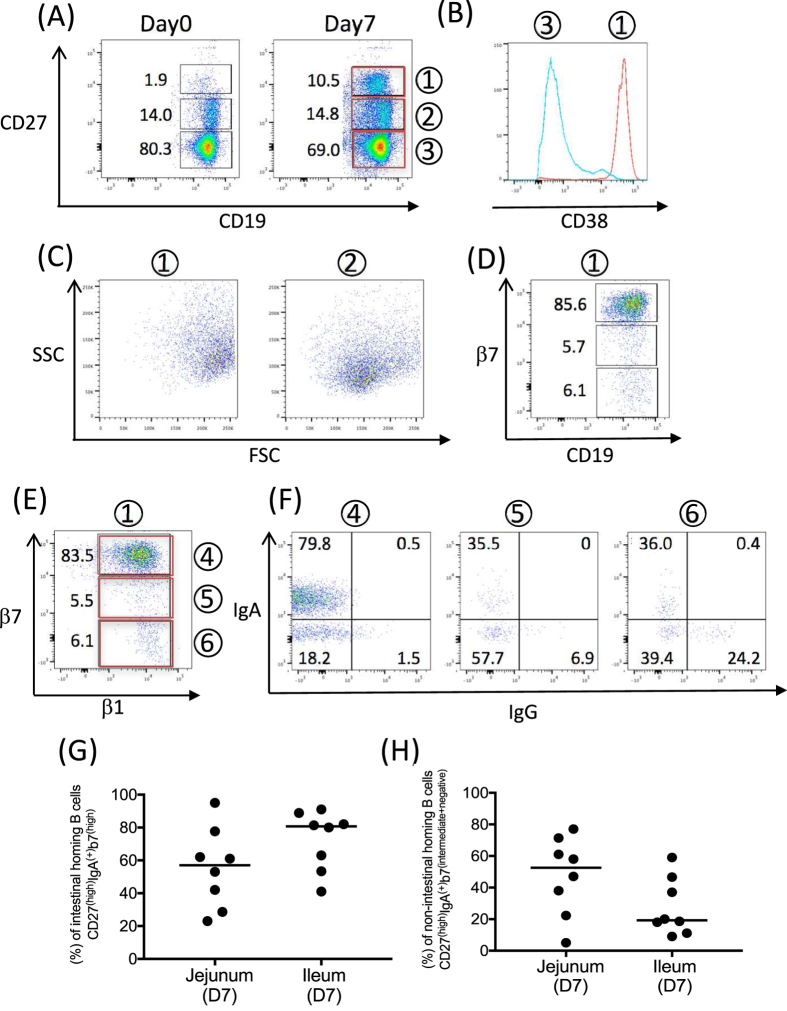
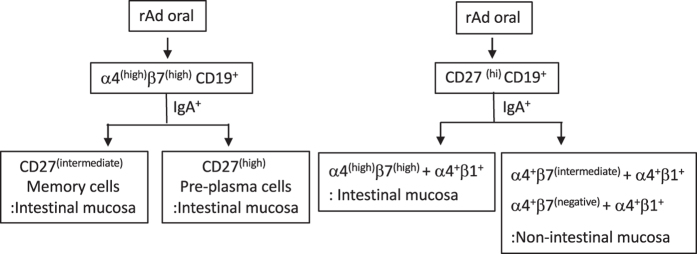
There are several benefits of oral immunization including the ability to elicit mucosal immune responses that may protect against pathogens that invade through a mucosal surface. Our understanding of human immune biology is hampered by the difficulty in isolating mucosal cells from humans, and the fact that animal models may or may not completely mirror human intestinal immunobiology. In this human pharmacodynamic study, a novel adenovirus vector-based platform expressing influenza hemagglutinin was explored. We used radio-controlled capsules to deliver the vaccine to either the jejunum or the ileum. The resulting immune responses induced by immunization at each of the intestinal sites were investigated. Both intestinal sites were capable of inducing mucosal and systemic immune responses to influenza hemagglutinin, but ileum delivery induced higher numbers of antibody secreting cells of IgG and IgA isotypes, increased mucosal homing B cells, and higher number of vaccine responders. Overall, these data provided substantial insights into human mucosal inductive sites, and aided in the design and selection of indications that could be used with this oral vaccine platform.


Conflict of interest statement

The authors LK, CJM, KAH, JRB, GRT, DL, and SNT are employees and/or own stock in Vaxart, the sponsor of the study. The authors EPS and WJD work for a contract research organization that ran the study for the sponsor.

Figures

Figure 1
Figure 1
Scintigraphy visualization of subjects given vaccine released in the upper small intestine (A) versus the lower small intestine (B). Each subject swallows vaccine in a size 000 mechanical capsule loaded with liquid vaccine and a radiolabeled tracer. Post dose, one can visualize the capsule transiting through the stomach (Stom, red circle) and the intestine as a discrete spot because the radiolabeled tracer is all contained with the capsule. As the radiolabeled tracer proceeds through the proximal small intestine (PSI, purple circle) and the distal small intestine (DSI, yellow circle), the figures are labeled with such. Post release, the liquid contents are ejected from the capsule and dispersion of the material can be visualized as it spreads away from the capsule. When verified that the dispersed material has reached the colon (Colon, green outlined region), scintigraphy visualization is no longer required.
Figure 2
Figure 2. IgA and IgG ASC responses to HA following rAd oral vaccination to either the jejunum or ileum.
Results are shown as numbers of HA-specific ASCs/106 PBMC 7 days after vaccination. Each icon represents response level of one subject (A,B). Each bar represents median.
Figure 3
Figure 3. Antibody responses to HA following rAd oral vaccination to either the jejunum or ileum.
(A) HAI titers to A/CA/07/2009 on days 0 and 28 after a single dose for the subjects that were not seroprotected (initial HAI < 40) at the start of the study. The line on the figure indicates a titer of 40 to show subjects seroprotected post immunization. (B) MN titers to A/CA/07/2009 for individual subjects on days 0 and 28 post immunization. The line shows the MN titer of 40.
Figure 4
Figure 4. Fold increases in the anti-HA IgA responses to influenza HA following vaccine delivery by RCC to either the jejunum or ileum.
Data are shown when a > 2-fold increase in GMT from day 0 to day 28 nasal and fecal samples had occurred.
Figure 5
Figure 5
(A) The proportion of β7(high) as a percentage of CD19+B cells in PBMCs are shown days 0 and 7 following vaccination in either the jejunum or ileum (**p = 0.0024 for the jejunum-targeted group and p = 0.0034 for the ileum-targeted group at day0 and day7, Wilcoxon test of paired t test). Each icon represents an individual subject. Bars represent the median of β7(high) CD19+B cells. The red arrow indicates a subject that was analyzed for FACS data in Figs 5 and 6. (B) Samples of CD19 versus β7 staining are shown on day 0 and day 7 PBMCs. (C) Both β7(intermediate) and β7(negative) CD19+B cells expressed α4 integrin (blue line). The negative control (FMO) is shown in orange. CD19+β7(high) cells have high expression of α4 integrin (red line). (D) On day7 following vaccination, β7(high) B cells in PBMCs express CD27(high) and CD27(lintermediate). (E) Gating on β7(high) and β7(negative) B cells, surface IgA and IgG expression are shown. (F) β7(high) IgA + B cells show CCR9 expression compared to β7(negative) B cells. Population 1: day 7 β7(high) CD19+B cells, population 2: day 7 β7(intermediate) CD19+B cells, population 3: β7(negative) CD19+B cells.
Figure 6
Figure 6
(A) After vaccination, CD27(high) B cells appear in PBMCs. (B) CD27(high) B cells express high levels of CD38 (red line) compared to CD27(negative) (blue line). (C) The gated cells on day7 in (A) are shown for their FSC and SSC profile. CD27(hi) cells are larger than CD27(intermediate) B cells. (D) β7 expression on CD27(high) B cells. The major sub population expressed β7(high). (E) β1 integrin versus β7 integrin expression gated on CD27(high) B cells. (F) IgA and IgG surface expressions gated on CD27(high) B cells on day7. (G,H) comparison of intestinal and non-intestinal mucosal B cells in jejunum and ileum release groups.
Figure 7
Figure 7. A schematic representation of the subsets generated after rAd oral vaccination.
Population 1: day 7 CD27(high)CD19+B cells, population 2: day 7 CD27(intermediate) CD19+B cells, population 3: CD27(negative) CD19+B cells, population 4: CD27(high)CD19+β7(high) β1+, population 5, CD27(high)CD19+β7(intermediate) β1+, population 6: CD27(high)CD19+β7(negative) β1+.

References

    1. Ogra P. L., Fishaut M. & Gallagher M. R. Viral vaccination via the mucosal routes. Rev Infect Dis 2, 352–369 (1980). - PubMed
    1. Ermund A., Schutte A., Johansson M. E., Gustafsson J. K. & Hansson G. C. Studies of mucus in mouse stomach, small intestine, and colon. I. Gastrointestinal mucus layers have different properties depending on location as well as over the Peyer’s patches. Am J Physiol Gastrointest Liver Physiol 305, G341–G347, doi: 10.1152/ajpgi.00046.2013 (2013). - DOI - PMC - PubMed
    1. Mowat A. M. & Agace W. W. Regional specialization within the intestinal immune system. Nature reviews. Immunology 14, 667–685, doi: 10.1038/nri3738 (2014). - DOI - PubMed
    1. Van Kruiningen H. J., West A. B., Freda B. J. & Holmes K. A. Distribution of Peyer’s patches in the distal ileum. Inflamm Bowel Dis 8, 180–185 (2002). - PubMed
    1. Cornes J. S. Number, size, and distribution of Peyer’s patches in the human small intestine: Part I The development of Peyer’s patches. Gut 6, 225–229 (1965). - PMC - PubMed

Publication types

MeSH terms

Substances