. 2016 Nov 24:6:37526.
doi: 10.1038/srep37526.

Netrin-1-Induced Stem Cell Bioactivity Contributes to the Regeneration of Injured Tissues via the Lipid Raft-Dependent Integrin α6β4 Signaling Pathway

Affiliations

Netrin-1-Induced Stem Cell Bioactivity Contributes to the Regeneration of Injured Tissues via the Lipid Raft-Dependent Integrin α6β4 Signaling Pathway

Soo Sang Lee et al. Sci Rep. .

Abstract

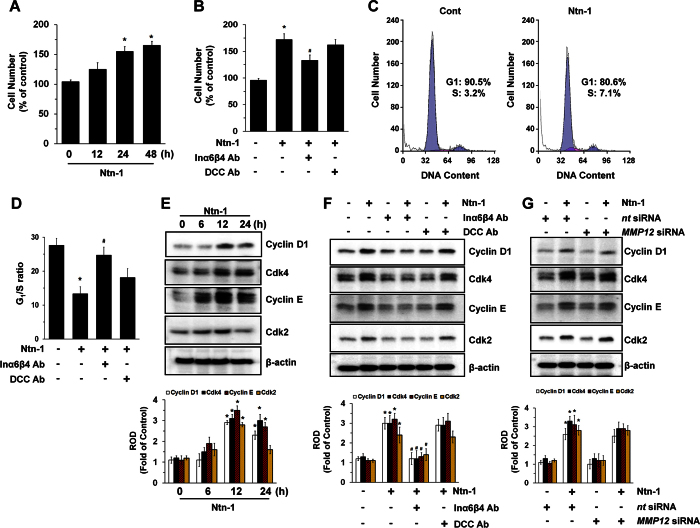
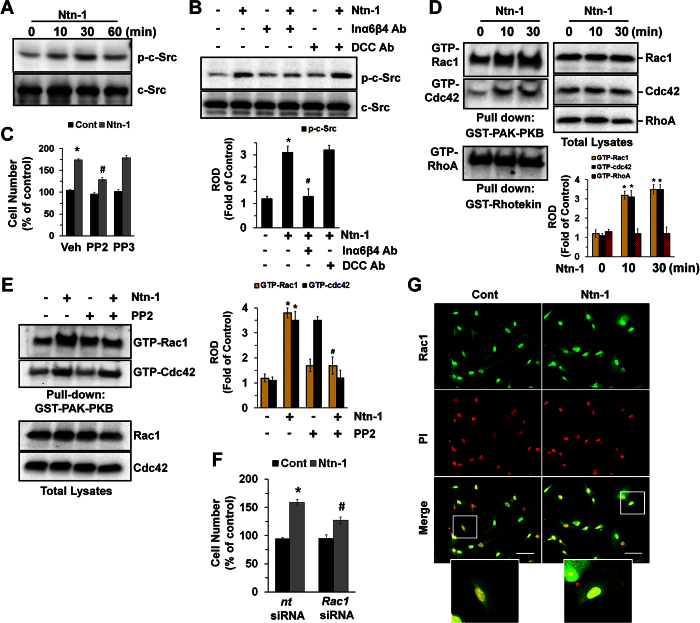
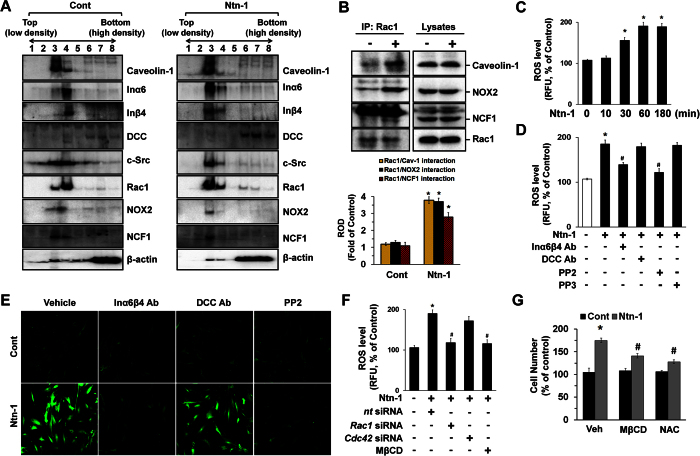
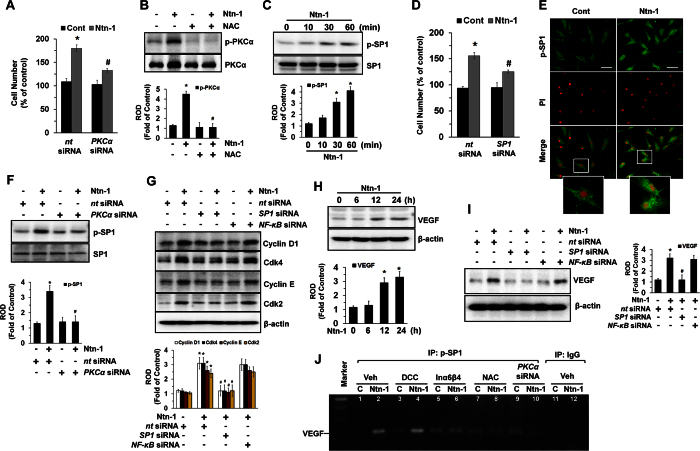
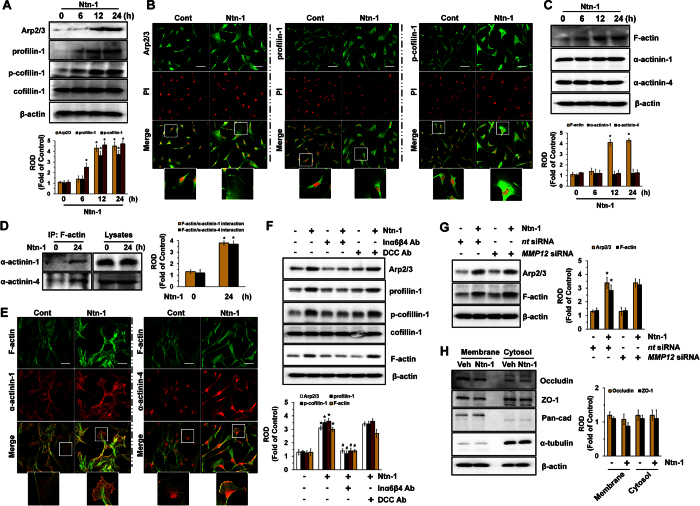
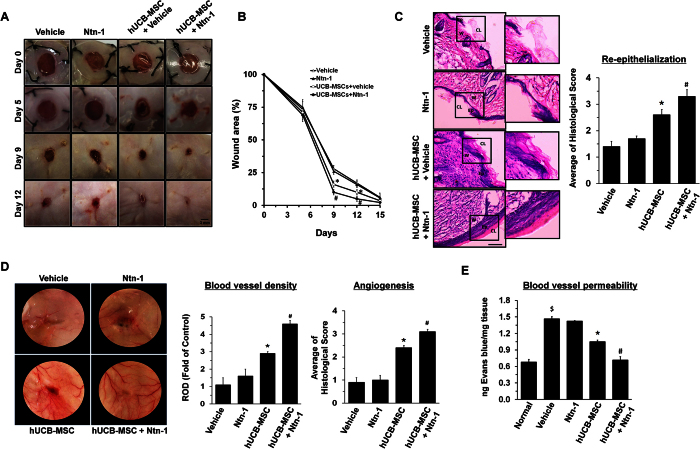
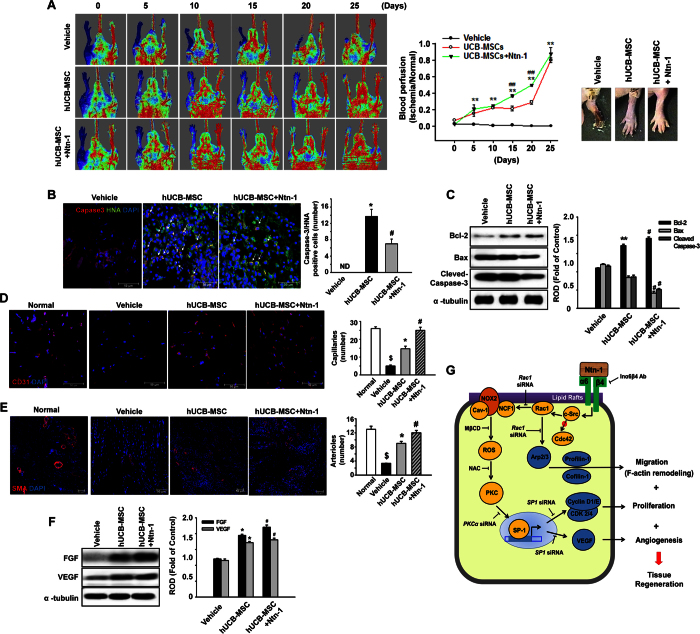
Netrin-1 (Ntn-1) is a multifunctional neuronal signaling molecule; however, its physiological significance, which improves the tissue-regeneration capacity of stem cells, has not been characterized. In the present study, we investigate the mechanism by which Ntn-1 promotes the proliferation of hUCB-MSCs with regard to the regeneration of injured tissues. We found that Ntn-1 induces the proliferation of hUCB-MSCs mainly via Inα6β4 coupled with c-Src. Ntn-1 induced the recruitment of NADPH oxidases and Rac1 into membrane lipid rafts to facilitate ROS production. The Inα6β4 signaling of Ntn-1 through ROS production is uniquely mediated by the activation of SP1 for cell cycle progression and the transcriptional occupancy of SP1 on the VEGF promoter. Moreover, Ntn-1 has the ability to induce the F-actin reorganization of hUCB-MSCs via the Inα6β4 signaling pathway. In an in vivo model, transplantation of hUCB-MSCs pre-treated with Ntn-1 enhanced the skin wound healing process, where relatively more angiogenesis was detected. The potential effect of Ntn-1 on angiogenesis is further verified by the mouse hindlimb ischemia model, where the pre-activation of hUCB-MSCs with Ntn-1 significantly improved vascular regeneration. These results demonstrate that Ntn-1 plays an important role in the tissue regeneration process of hUCB-MSC via the lipid raft-mediated Inα6β4 signaling pathway.


Conflict of interest statement

The authors declare no competing financial interests.

Figures

Figure 1
Figure 1. Regulatory effect of Ntn-1on stem cell proliferation.
(A) hUCB-MSCs were incubated with 50 ng/mL of Ntn-1 for 48 h, and the number of cells was counted. Data represent the mean ± S.E. n = 5. *P < 0.05 vs. 0 h (B) Cells were pre-treated with DCC-function-blocking antibody (2.5 μg/mL) or a combination of Inα6- and Inβ4-function-blocking antibodies (2.5 μg/mL) for 30 min prior to Ntn-1 exposure for 24 h. Cell counting was performed. Data represent the mean ± S.E. n = 4. *P < 0.05 vs. vehicle. #P < 0.05 vs. Ntn-1 alone. (C) Cells were treated with Ntn-1 for 24 h. Gates were manually configured to determine the percentage of cells in S phase based on DNA content by using PI staining and flow cytometry. Data represent the mean ± S.E. n = 4. (D) G1/S ratios measured by flow cytometry. Data represent the mean ± S.E. n = 4. *P < 0.01 vs. vehicle. #P < 0.05 vs. Ntn-1 alone. (E) The cells were incubated in the presence of Ntn-1 for 24 h and then harvested. Total protein was extracted and blotted with Cyclin D1, CDK4, Cyclin E, and CDK2 antibodies. Data represent the mean ± S.E. n = 4. *P < 0.05 vs. 0 h. (F) The level of cell cycle proteins in cells pre-treated with DCC-function-blocking antibody (2.5 μg/mL) or a combination of Inα6- and Inβ4-function-blocking antibodies (2.5 μg/mL) for 30 min prior to Ntn-1 exposure for 24 h is shown. Data represent the mean ± S.E. n = 4. *P < 0.01 vs. vehicle. #P < 0.05 vs. Ntn-1 alone. (G) The effect of Ntn-1 on the level of cell cycle proteins in cells transfected with MMP12siRNA is shown. Cells were transfected for 24 h with specific siRNA for MMP12 prior to Ntn-1 exposure for 24 h. Non-targeting (nt) control siRNA was used as a negative control. Data represent the mean ± S.E. n = 4. *P < 0.01 vs. nt siRNA. (EG) ROD is the abbreviation for relative optical density.
Figure 2
Figure 2. Regulatory effect of Ntn-1 on activation of c-Src and Rac1.
(A) Phosphorylation of c-Src in cells treated with Ntn-1 for 60 min is shown. (B) Phosphorylation of c-Src in cells pre-treated with DCC-function-blocking antibody or a combination of Inα6- and Inβ4-function-blocking antibodies for 30 min prior to Ntn-1 exposure for 30 min is shown. Data represent the mean ± S.E. n = 4. *P < 0.01 vs. vehicle. #P < 0.01 vs. Ntn-1 alone. (C) Cells were pre-treated with PP2 (10 μM) or PP3 (10 μM) for 30 min prior to Ntn-1 exposure for 24 h. Cell counting with a hemocytometer was performed. Data represent the mean ± S.E. n = 4. *P < 0.01 vs. vehicle alone. #P < 0.05 vs. Ntn-1 + vehicle alone. (D) Cells were treated with Ntn-1 for 30 min, and the lysates (400 μg) were incubated with agarose beads containing GST-PAK-PBD or GST-Rhotekin-RBD. The bound activated GTP-Rac1, GTP-Cdc42, and GTP-RhoA were resolved by SDS-PAGE, transferred, and blotted using an anti-Rac1, anti-Cdc42, and anti-RhoA antibodies to determine the extent of the activation of Rac1, Cdc42, and RhoA. Total Rac1, Cdc42, and RhoA levels were determined using lysates (right panel). Data represent the mean ± S.E. n = 4. *P < 0.05 vs. vehicle. (E) The activation of Rac1 and Cdc42 in cells pre-treated with PP2 (10 μM) for 30 min prior to Ntn-1 exposure for 30 min is shown. Data represent the mean ± S.E. n = 4. *P < 0.01 vs. vehicle. #P < 0.05 vs. Ntn-1 alone. (F) Cells were transfected with Rac1siRNA prior to Ntn-1 exposure for 24 h. Cell counting with a hemocytometer was performed. Data represent the mean ± S.E. n = 4. *P < 0.01 vs. nt siRNA alone. #P < 0.05 vs. nt siRNA + Ntn-1 alone (G) Rac1 expression (green) was determined by confocal microscopy using immunofluorescence staining. Propidium iodide (PI) was used for nuclear counterstaining (red). Scale bars, 100 μm (magnification, x400). n = 3. (BE) ROD is the abbreviation for relative optical density.
Figure 3
Figure 3. Cell proliferation is mediated by lipid raft-mediated ROS production.
(A) Caveolin-enriched membrane fractions were prepared by discontinuous sucrose density gradient fractionation, and the location of Caveolin-1, Inα6, Inβ4, DCC, c-Src, Rac1, NOX2, and NCF1 was determined by Western blot analysis. n = 3. (B) Rac1 co-immunoprecipitated with caveolin-1, NOX2, and NCF1 is shown (left side). The level of caveolin-1, NOX2, NCF1 and Rac1 in total cell lysates is shown in the right side. (C) Time responses of 50 ng/mL of Ntn-1 for 180 min in ROS production are shown. n = 5. (D) The level of ROS production in cells pre-treated with DCC-function-blocking antibody, a combination of Inα6- and Inβ4-function-blocking antibodies, PP2 (10 μM), or PP3 (10 μM) for 30 min prior to Ntn-1 exposure for 60 min is shown. Data represent the mean ± S.E. n = 4. *P < 0.01 vs. vehicle. #P < 0.05 vs. Ntn-1 alone. (E) ROS production (green) was visualized by confocal microscopy. Scale bars, 100 μm. n = 4. (F) The level of ROS production in cells transfected with siRNA for Rac1 and Cdc42 or pre-treated with MβCD (0.1 mM) was shown. Data represent the means ± S.E. *P < 0.01 vs. vehicle. #P < 0.01 vs. nt siRNA + Ntn-1. (G) Cells were pre-treated with MβCD (0.1 mM) and NAC (10 μM) for 30 min prior to Ntn-1 exposure for 24 h. Cell counting with a hemocytometer was performed. Data represent the mean ± S.E. n = 4. *P < 0.05 vs. vehicle alone. #P < 0.05 vs. vehicle + Ntn-1 alone. (BD,F) ROD and RFU are the abbreviations for relative optical density and relative fluorescence unit, respectively.
Figure 4
Figure 4. Regulatory effect of Ntn-1 on SP1 activation and VEGF expression.
(A) The number of cells transfected with PKCαsiRNA prior to Ntn-1 exposure for 24 h is shown. Data represent the mean ± S.E. n = 3. *P < 0.05 vs. nt siRNA alone. #P < 0.05 vs. nt siRNA + Ntn-1 alone. (B) Activation of PKCα in cells treated with NAC (10 μM) for 30 min prior to Ntn-1 exposure for 60 min is shown. Data represent the mean ± S.E. n = 3. *P < 0.01 vs. vehicle. #P < 0.01 vs. Ntn-1 alone. (C) Phosphorylation of SP1 is shown. Data represent the mean ± S.E. n = 3. *P < 0.05 vs. 0 h. (D) The number of cells transfected with SP1siRNA prior to Ntn-1 exposure for 60 min is shown. (E) p-SP1 expression (green) was determined by confocal microscopy. Propidium iodide (PI) was used for nuclear counterstaining (red). Scale bars, 100 μm (magnification, x400). n = 3. (F) Phosphorylation of SP1 in cells transfected with PKCαsiRNA prior to Ntn-1 exposure for 60 min is shown. (G) The level of cell cycle proteins in cells transfected with SP1siRNA or NF-κBsiRNA is shown. (H) The level of VEGF is shown. Data represent the mean ± S.E. n = 3. *P < 0.05 vs. 0 h. (I) The amount of VEGF in cells transfected with SP1siRNA or NF-κBsiRNA prior to Ntn-1 exposure for 24 h is shown. (J) Cells were treated with DCC-function-blocking antibody, a combination of Inα6- and Inβ4-function-blocking antibodies, and NAC, or transfected with PKCαsiRNA prior to Ntn-1 exposure for 12 h. The binding of p-SP1 to VEGF promoter was determined by ChIP assay. n = 3. Normal mouse IgG was used as negative control for the ChIP. n = 3. (D,F,G,I) Data represent the mean ± S.E. n = 5. *P < 0.05 vs. nt siRNA. #P < 0.05 vs. nt siRNA + Ntn-1. (B,C,FH,I) ROD is the abbreviation for relative optical density.
Figure 5
Figure 5. Regulatory effect of Ntn-1on F-actin reorganization of stem cells.
(A) The level of Arp2/3, profilin-1, p-cofilin-1, and cofilin-1 in cells treated with Ntn-1 for 24 h is shown. Data represent the mean ± S.E. n = 4. *P < 0.01 vs. 0 h. (B) The increased expressions of Arp2/3 (green, left panel), profilin-1 (green, middle panel) and p-cofilin-1 (green, right panel) were determined by confocal microscopy. Propidium iodide (PI) was used for nuclear counterstaining (red). Scale bars, 100 μm (magnification, x400). n = 3. (C) Time responses of Ntn-1 in expression of F-actin, α-actinin-1, and α-actinin-4 for 24 h are shown. Data represent the mean ± S.E. n = 4. *P < 0.01 vs. 0 h. (D) Co-immunoprecipitation of F-actin with α-actinins is shown (left panel). The level of α-actinin-1 and −4 in total cell lysates is shown in the right panel. Data represent the mean ± S.E. n = 3. *P < 0.05 vs. 0 h. (E) The increased colocalization of F-actin (green) with α-actinin-1 and −4 (red) was determined by confocal microscopy. Scale bars, 100 μm (magnification, x400). n = 3. (F) The level of Arp2/3, profilin-1, p-cofilin-1, cofilin-1, and F-actin in cells pre-treated with DCC-function-blocking antibody and a combination of Inα6- and Inβ4-function-blocking antibodies for 30 min prior to Ntn-1 exposure for 24 h is shown. Data represent the mean ± S.E. n = 4. *P < 0.01 vs. vehicle. #P < 0.01 vs. Ntn-1 alone. (G) The effect of Ntn-1 on the amount of Arp2/3 and F-actin in cells transfected with MMP12siRNA is shown. Data represent the mean ± S.E. n = 4. *P < 0.01 vs. nt siRNA. (H) The level of Occludin and ZO-1 presented in membrane and cytosol fraction in cells treated with Ntn-1 for 24 h was determined by Western blot analysis. Pan-cadherin and α-tubulin were used as internal controls for plasma membrane and cytosol, respectively. Data represent the mean ± S.E. n = 4. (AD,FH) ROD is the abbreviation for relative optical density.
Figure 6
Figure 6. Effects of Ntn-1 on mouse skin wound healing.
(A) Representative gross images on skin wound healing on day 0, 5, 9, and 12 are shown (left panel). Mouse skin wounds were made by 6-mm-diameter biopsy punch and treated with vehicle, Ntn-1, hUCB-MSC + vehicle, and hUCB-MSC + Ntn-1, respectively. (B) Quantifications of wound sizes relative to original wound size for 15 days are shown. Data represent the mean ± S.E. n = 7. *P < 0.05 vs. vehicle alone. #P < 0.05 vs. hUCB-MSC + vehicle. (C) Representative wound tissues stained with H&E on day 12 are shown (Top panel). n = 7. Scale bars, 100 μm. Abbreviations: Ep, epidermis; W, wound bed; CL, cornified layer. Histological scores in re-epithelialization were quantified according to the Supplementary Table 1 (right panel). (D) Representative images of blood vessels in wounds on day 12. n = 7 (left panel). Vessel densities relative to the group treated with Vehicle alone were quantified by using Image J program (middle panel). ROD, relative optical density. Histological scores in angiogenesis were quantified according to the Supplementary Table 1 (right panel). (E) Upon postoperative day 12, Miles assay was performed to measure blood vessel permeability. Wound tissue samples (100 mg) were incubated with 500 μL formamide to release the extravagated Evans blue for 24 h. Optical density was measured at 610 nm and the measurements converted into ng dye extravagated per mg tissue (n = 7). $P < 0.01 versus Normal. *P < 0.01 versus vehicle. #P < 0.05 versus hUCB-MSCs alone.
Figure 7
Figure 7. Effects of Ntn-1 on vascular regeneration in mouse hindlimb ischemia model.
(A) The ratio of blood perfusion (blood flow in the left ischemic limb/blood flow in the right non-ischemic limb) was measured using Laser Doppler perfusion imaging analysis in the ischemic limbs of nude mice injected with PBS, hUCB-MSC, or hUCB-MSC + Ntn-1 on postoperative days 0, 5, 10, 15, 20, and 25 (left and middle panels). Gross morphologies of mice hindlimb on postoperative day 15 are shown (right panel). Data represent the mean ± SE. n = 5. **P < 0.01 vs. vehicle, ##P <0.01 vs. hUCB-MSC + Ntn-1. (B) The survival of transplanted hUCB-MSCs was assessed by immunofluorescent staining with Cleaved Caspase-3 (red) and anti-human nuclei antigen (HNA, green) antibodies. DAPI was used as nuclear control (blue). n = 3. Scale bar, 50 μm. Apoptotic cells were quantified as the number of HNA- and Cleaved Caspase-3-positive cells. (C) The level of apoptosis-related proteins in the mice treated with vehicle, hUCB-MSCs, and hUCB-MSCs + Ntn-1 on 3 days was determined by Western blot with Bcl-2, Bax, and Cleaved Caspase-3 antibodies. n = 3. *P < 0.01 versus vehicle. #P < 0.05 versus hUCB-MSCs alone. Data represent the means ± S.E. Upon postoperative day 15, ischemic limb tissue samples were immunostained with an anti-CD31 (D) and anti-α-SMA (E) for assessment of capillary density and arteriole density, respectively. n = 3. Scale bar, 50 μm. The density of capillary and arteriole was quantified as the number of CD31- and α-SMA-positive cells. $P < 0.01 versus Normal. *P < 0.01 versus vehicle. #P < 0.05 versus hUCB-MSCs alone. (F) The level of FGF and VEGF in the mice treated with vehicle, hUCB-MSCs, and hUCB-MSCs + Ntn-1 for 15 days was determined by Western blot. *P < 0.01 versus vehicle. #P < 0.05 versus hUCB-MSCs alone. Data represent the means ± S.E. n = 3. (G) A hypothetical model for Ntn-1-induced signaling pathway in promoting mouse wound healing and vascular regeneration. (C,F) ROD is the abbreviation for relative optical density.

References

    1. Hocking A. M. & Gibran N. S. Mesenchymal stem cells: paracrine signaling and differentiation during cutaneous wound repair. Exp Cell Res 36, 2213–2219 (2010). - PMC - PubMed
    1. Kim S. W., Zhang H. Z., Guo L., Kim J. M. & Kim M. H. Amniotic mesenchymal stem cells enhance wound healing in diabetic NOD/SCID mice through high angiogenic and engraftment capabilities. PLoS One 7, e41105 (2012). - PMC - PubMed
    1. Ojeh N., Pastar I., Tomic-Canic M. & Stojadinovic O. Stem cells in skin regeneration, wound healing, and their clinical applications. Int J Mol Sci 16, 25476–25501 (2015). - PMC - PubMed
    1. Braun K. M. & Prowse D. M. Distinct epidermal stem cell compartments are maintained by independent niche microenvironments. Stem Cell Rev 2, 221–231 (2006). - PubMed
    1. Yau W. W. Y., Rujitanaroj P. O., Lam L. & Chew S. Y. Directing stem cell fate by controlled RNA interference. Biomaterials 33, 2608–2628 (2012). - PubMed

Publication types

MeSH terms