

Bayesian analysis of heterogeneous treatment effects for patient-centered outcomes research
- PMID: 27881932
- PMCID: PMC5097788
- DOI: 10.1007/s10742-016-0159-3
Bayesian analysis of heterogeneous treatment effects for patient-centered outcomes research
Abstract
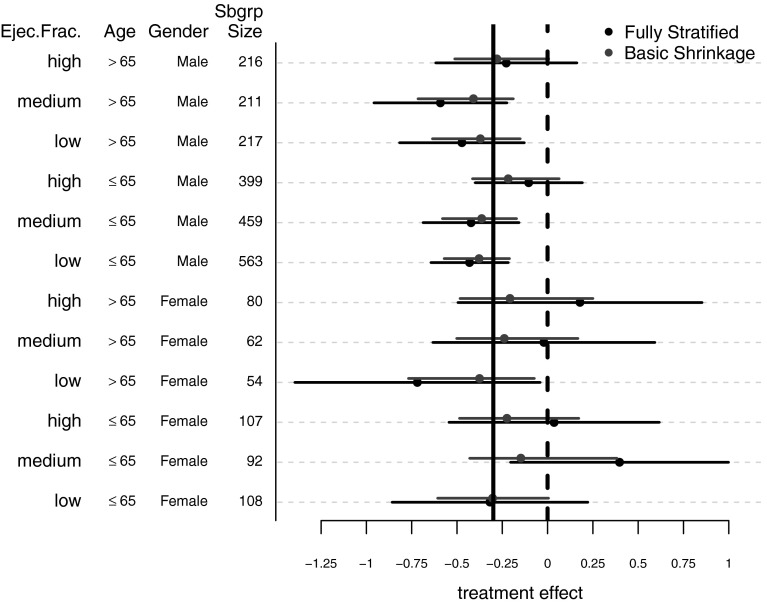
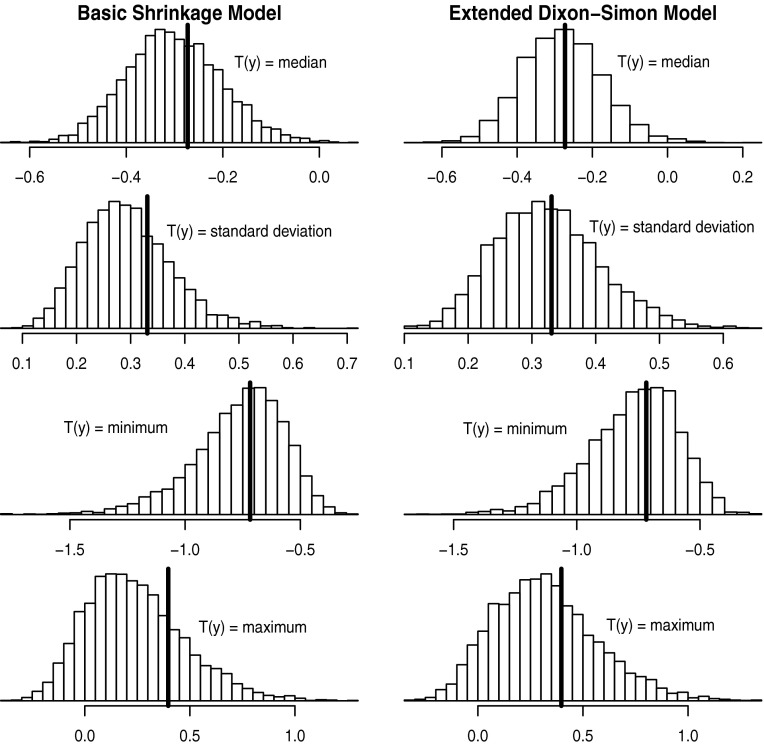
Evaluation of heterogeneity of treatment effect (HTE) is an essential aspect of personalized medicine and patient-centered outcomes research. Our goal in this article is to promote the use of Bayesian methods for subgroup analysis and to lower the barriers to their implementation by describing the ways in which the companion software beanz can facilitate these types of analyses. To advance this goal, we describe several key Bayesian models for investigating HTE and outline the ways in which they are well-suited to address many of the commonly cited challenges in the study of HTE. Topics highlighted include shrinkage estimation, model choice, sensitivity analysis, and posterior predictive checking. A case study is presented in which we demonstrate the use of the methods discussed.
Keywords: Bayesian subgroup analysis; Heterogeneity of treatment effect; Hierarchical modeling; Personalized medicine; Precision medicine; Treatment–covariate interaction.
Conflict of interest statement
All the authors declare that they have no conflict of interest. Ethical approval This article does not contain any studies with human participants or animals performed by any of the authors. The study was approved by the Johns Hopkins IRB as a “Not Human Subjects Research (NHSR)/Quality Improvement (QI)” study.
Figures


References
-
- Alosh M, Fritsch K, Huque M, Mahjoob K, Panello G, Rothmann M, Russek-Cohen E, Smith F, Wilson S, Yue L. Statistical considerations on subgroup analysis in clinical trials. Stat. Biopharm. Res. 2015;7(4):286–304. doi: 10.1080/19466315.2015.1077726. - DOI
-
- Carlin BP, Louis TA. Bayesian Methods for Data Analysis. Boca Raton: Chapman & Hall/CRC; 2009.
-
- Efron B, Morris C. Stein’s estimation rule and its competitors—an empirical Bayes approach. J. Am. Stat. Assoc. 1973;68:117–130.
LinkOut - more resources
Full Text Sources
Other Literature Sources