. 2016 Nov 9:7:1695.
doi: 10.3389/fpls.2016.01695. eCollection 2016.

Transcriptome Analysis and Identification of Genes Associated with Floral Transition and Flower Development in Sugar Apple (Annona squamosa L.)

Affiliations

Transcriptome Analysis and Identification of Genes Associated with Floral Transition and Flower Development in Sugar Apple (Annona squamosa L.)

Kaidong Liu et al. Front Plant Sci. .

Abstract

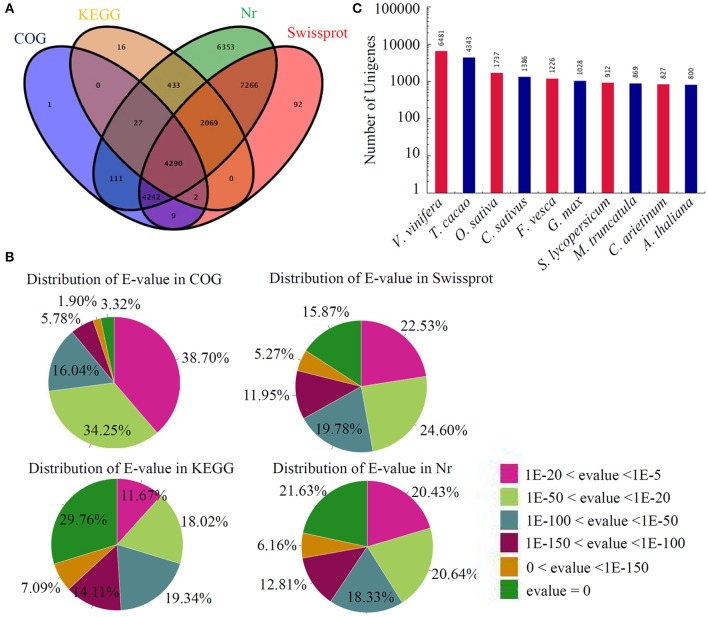
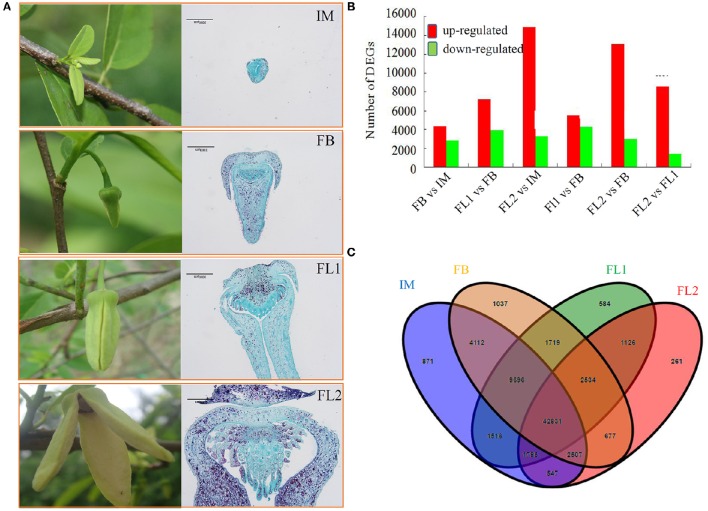
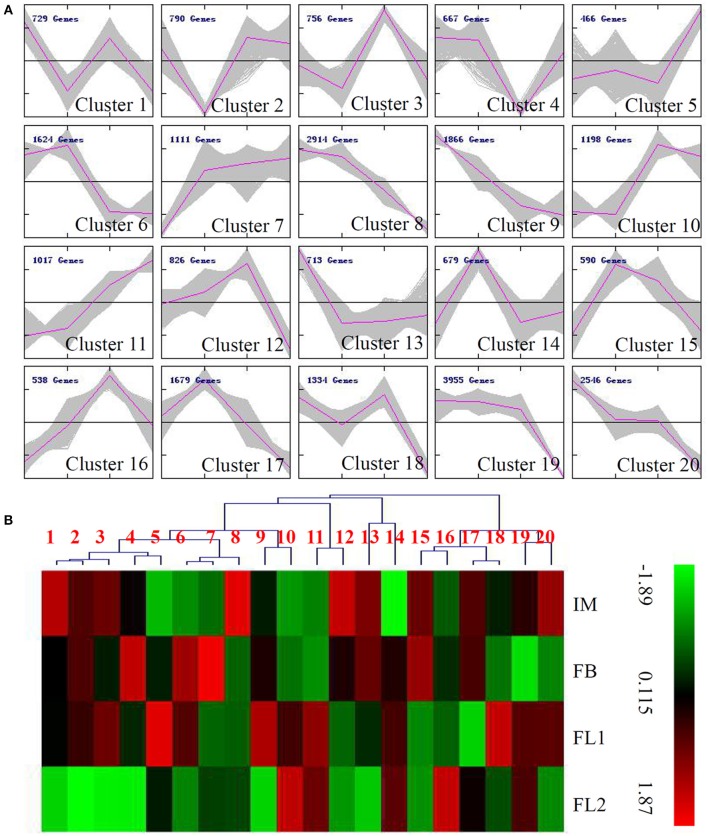
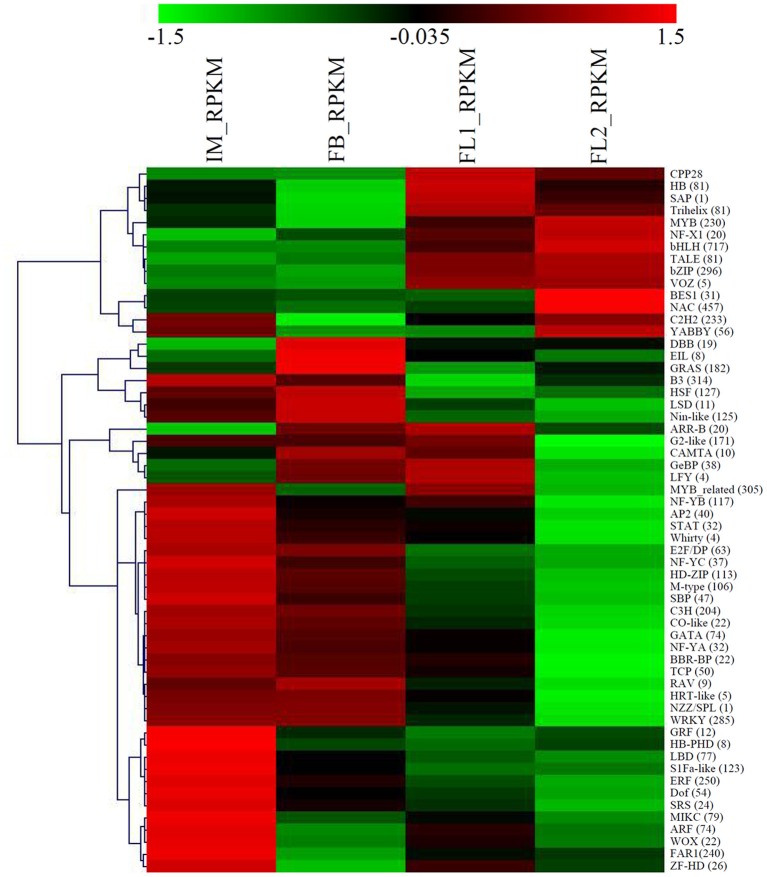
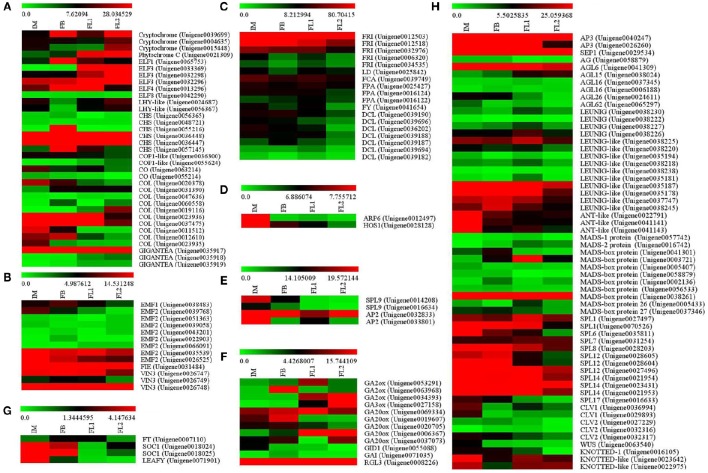
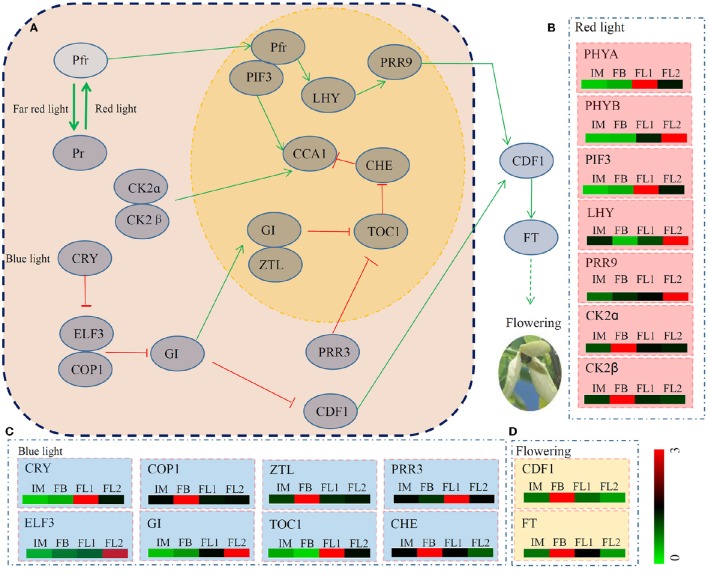
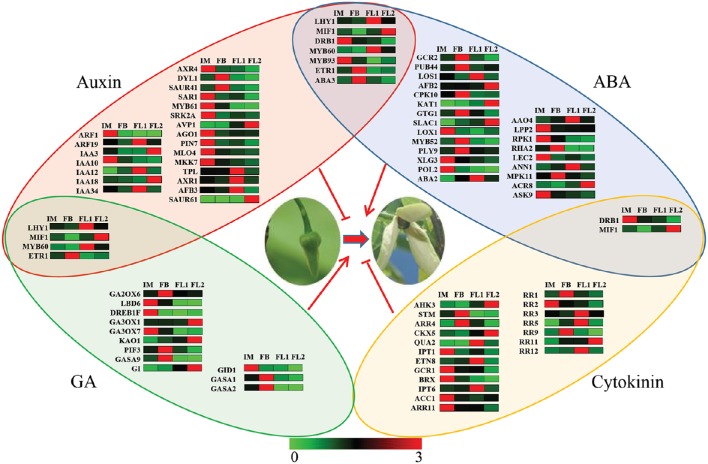
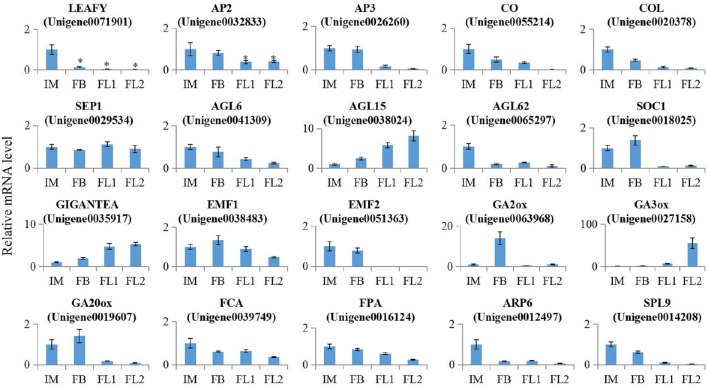
Sugar apple (Annona squamosa L.) is a semi-deciduous subtropical tree that progressively sheds its leaves in the spring. However, little information is available on the mechanism involved in flower developmental pattern. To gain a global perspective on the floral transition and flower development of sugar apple, cDNA libraries were prepared independently from inflorescent meristem and three flowering stages. Illumina sequencing generated 107,197,488 high quality reads that were assembled into 71,948 unigenes, with an average sequence length of 825.40 bp. Among the unigenes, various transcription factor families involved in floral transition and flower development were elucidated. Furthermore, a Kyoto Encyclopedia of Genes and Genomes pathway enrichment analysis revealed that unigenes exhibiting differential expressions were involved in various phytohormone signal transduction events and circadian rhythms. In addition, 147 unigenes exhibiting sequence similarities to known flowering-related genes from other plants were differentially expressed during flower development. The expression patterns of 20 selected genes were validated using quantitative-PCR. The expression data presented in our study is the most comprehensive dataset available for sugar apple so far and will serve as a resource for investigating the genetics of the flowering process in sugar apple and other Annona species.

Keywords: A. squamosa; circadian rhythm; digital gene expression; flower development; phytohormone; transcriptome.


Figures

Figure 1
Figure 1
Annotation of assembled sugar apple unigenes. (A) In total, 24911 unigenes were annotated by different protein databases. The number of unigenes annotated by different databases, including Nr, Swissprot, COG, and KEG, were showed in a Venn diagram. (B) Distribution of E-value in Nr database. (C) Identification of the transcripts of other plant species homologous to the annotated unigenes of sugar apple.
Figure 2
Figure 2
Analysis of the differentially expressed unigenes (DEGs) during the floral transition and flower development process in sugar apple. (A) Numbers of DEGs in different comparisons, including FB vs. IM, FL1 vs. FB, FL2 vs. IM, FL1 vs. FB, FL2 vs. FB, and FL2 vs. FL1. The red indicated up-regulated unigenes and green indicated down-regulated unigenes. (B) Venn diagram showed the number of DEGs in different stages of flower development. (C) The expression profiling of stage-preferential unigenes in sugar apple.
Figure 3
Figure 3
Expression profiles of the differentially expressed unigenes during the flowering process in sugar apple. (A) MeV cluster analysis of differentially expressed unigenes from the expression profiles during the flowering process. Red lines indicated the average expression level of unigenes grouped into the same Cluster under different flowering stages. (B) Heat map for cluster analysis of the differentially expressed unigenes by K-means method. Red indicates up-regulated genes and blue indicates down-regulated genes.
Figure 4
Figure 4
Identification and analysis of floral transition and flower development-associated transcription factor genes. A heat map depicting the overall trend of the differential expression profiles of the transcription factor genes during flower development was constructed using MeV. The number of each transcription factor was showed in parentheses.
Figure 5
Figure 5
Identification of the floral transition and flower development-associated genes. (A) Flower development stage-preferential expression pattern of the genes involved in photoperiod pathway. (B) Flower development stage-preferential expression pattern of the genes involved in autonomous pathway. (C) Flower development stage-preferential expression pattern of the genes involved in vernalization pathway. (D) Flower development stage-preferential expression pattern of the genes involved in thermosensory pathway. (E) Flower development stage-preferential expression pattern of the genes involved in aging pathway. (F) Flower development stage-preferential expression pattern of the genes associated with flowering integron. (G) Flower development stage-preferential expression pattern of the genes involved in GA signaling pathway. (H) Flower development stage-preferential expression pattern of the genes related to non-classified flowering regulators.
Figure 6
Figure 6
The detailed information on genes involved in the pathway of circadian rhythm. (A) The putative regulation network of circadian clock associated with flowering in sugar apple. Red arrow indicated depressing; and green arrow indicated activating. (B) The expression pattern of red light signaling pathway related genes during the flowering process. (C) The expression pattern of blue light signaling pathway related genes during the flowering process. (D) The expression pattern of two key flower development regulation genes during the flowering process. The different colors correspond to the log-transcription values of RPKM refer to each gene shown in the bar at the lower right corner of the figure.
Figure 7
Figure 7
Network analysis of various hormones involved in the regulation of flowering process. The red shadow color indicated the key genes associated with auxin signaling pathway. The blue shadow color indicated the key genes with ABA signaling pathway. The green shadow color indicated the key genes with GA signaling pathway. The yellow shadow color indicated the key genes with cytokinin signaling pathway. The different colors correspond to the log-transcription values of RPKM refer to each gene shown in the bar at the bottom of the figure.
Figure 8
Figure 8
Validation of the expression of flowering-related Genes in sugar apple. Expression level of 20 flower development related genes in different stages of flowering process was validated by qRT-PCR. All these data were based on the analysis of three independent biological repeats. Significant differences in gene expressions were indicated by “*”.
Figure 9
Figure 9
Endogenous hormones measurements in various flowering stages. The differences in endogenous (A) GA contents, (B) ABA contents, (C) ZA contents, and (D) IAA contents during four flower developmental stages in sugar apple were measured. The data were analyzed by three independent repeats, and standard deviations were shown with error bars. Significant differences in expression level between IM and FB were indicated by “a”; Significant differences in expression level between IM and FL1 were indicated by “b”; Significant differences in expression level between IM and FL2 were indicated by “c”; Significant differences in expression level between FB and FL1 were indicated by “d”; Significant differences in expression level between FB and FL2 were indicated by “e”.

References

    1. Alabadí D., Blázquez M. A., Carbonell J., Ferrándiz C., Pérez-Amador M. A. (2009). Instructive roles for hormones in plant development. Int. J. Dev. Biol. 53, 1597–1608. 10.1387/ijdb.072423da - DOI - PubMed
    1. Andrés F., Coupland G. (2012). The genetic basis of flowering responses to seasonal cues. Nat. Rev. Genet. 13, 627–639. 10.1038/nrg3291 - DOI - PubMed
    1. Bai S., Saito T., Sakamoto D., Ito A., Fujii H., Moriguchi T. (2013). Transcriptome analysis of Japanese pear (Pyrus pyrifolia Nakai) flower buds transitioning through endodormancy. Plant Cell Physiol. 54, 1132–1151. 10.1093/pcp/pct067 - DOI - PubMed
    1. Bartrina I., Otto E., Strnad M., Werner T., Schmülling T. (2011). Cytokinin regulates the activity of reproductive meristems, flower organ size, ovule formation, and thus seed yield in Arabidopsis thaliana. Plant Cell 23, 69–80. 10.1105/tpc.110.079079 - DOI - PMC - PubMed
    1. Bernier G., Havelange A., Houssa C., Petitjean A., Lejeune P. (1993). Physiological signals that induce flowering. Plant Cell 5, 1147–1155. - PMC - PubMed

LinkOut - more resources