. 2016 Nov 17;1(19):e89631.
doi: 10.1172/jci.insight.89631.

Plasma vesicle miRNAs for therapy response monitoring in Hodgkin lymphoma patients

Affiliations

Plasma vesicle miRNAs for therapy response monitoring in Hodgkin lymphoma patients

Monique Aj van Eijndhoven et al. JCI Insight. .

Abstract

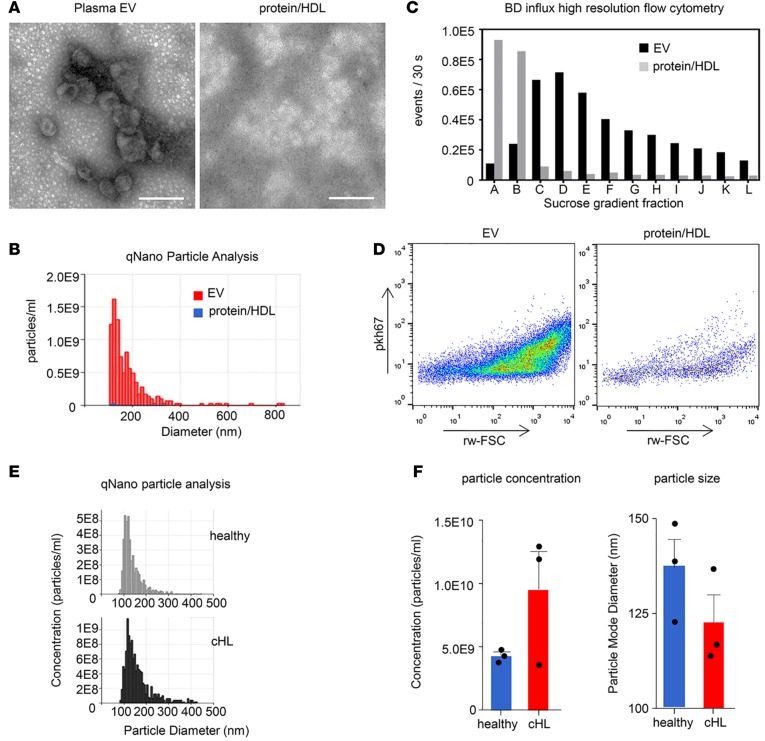
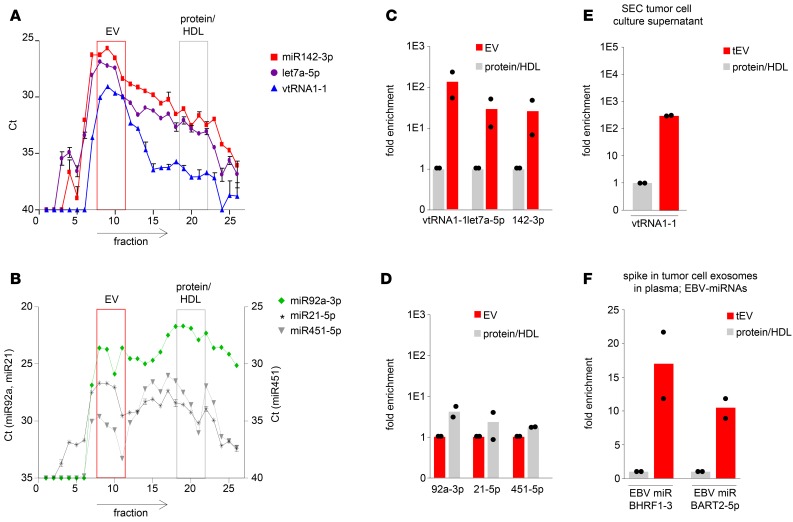
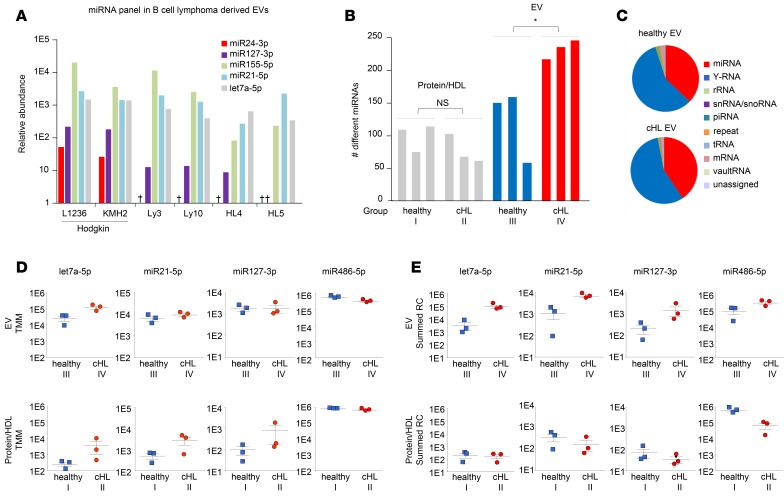
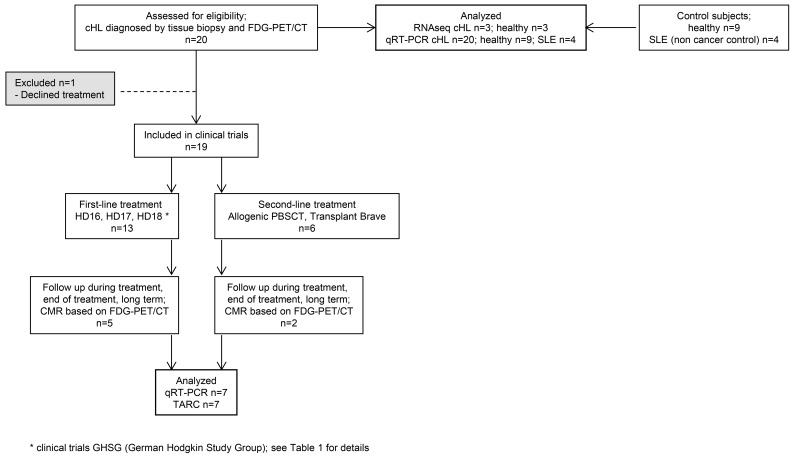
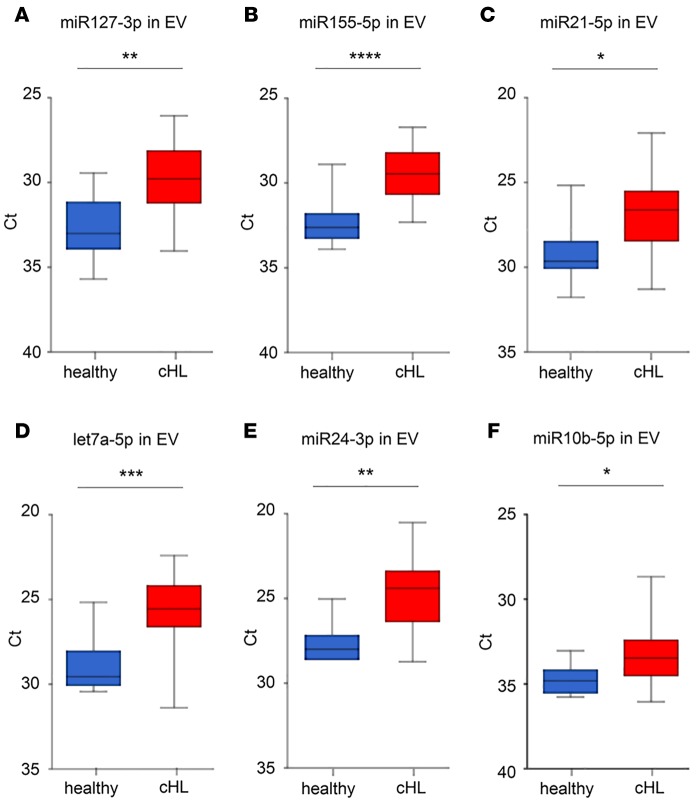
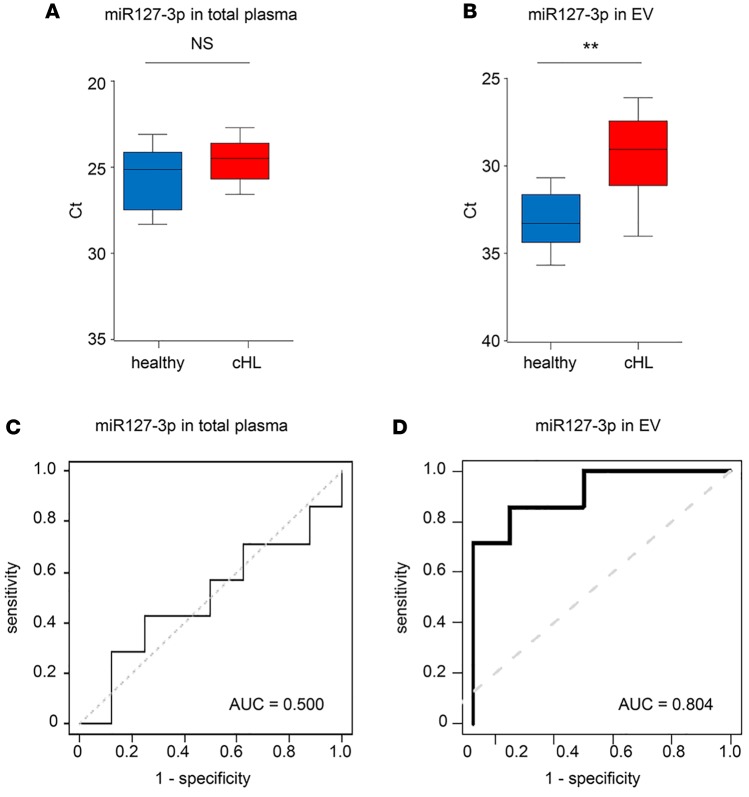
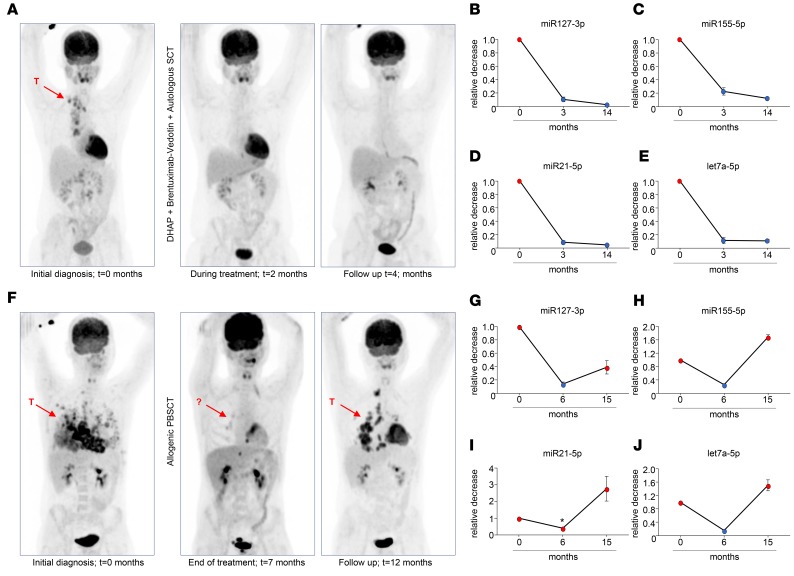
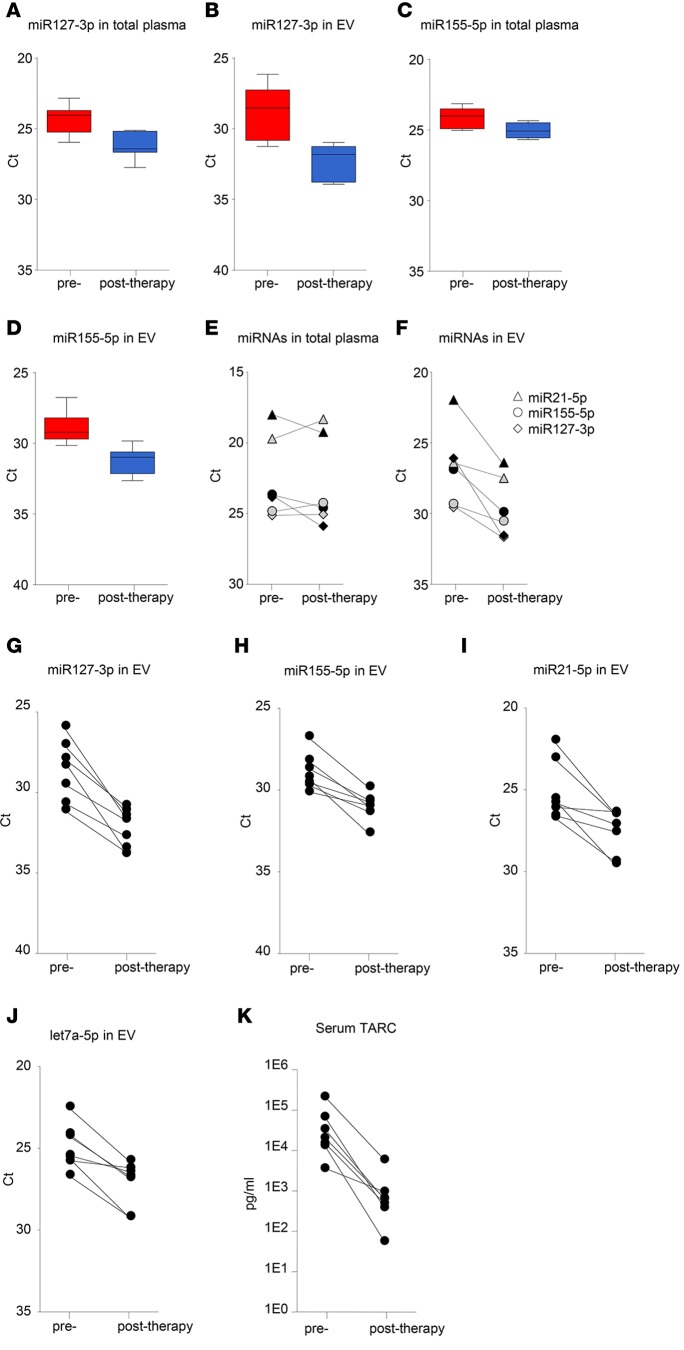
BACKGROUND. Cell-free circulating nucleic acids, including 22-nt microRNAs (miRNAs), represent noninvasive biomarkers for treatment response monitoring of cancer patients. While the majority of plasma miRNA is bound to proteins, a smaller, less well-characterized pool is associated with extracellular vesicles (EVs). Here, we addressed whether EV-associated miRNAs reflect metabolic disease in classical Hodgkin lymphoma (cHL) patients. METHODS. With standardized size-exclusion chromatography (SEC), we isolated EV-associated extracellular RNA (exRNA) fractions and protein-bound miRNA from plasma of cHL patients and healthy subjects. We performed a comprehensive small RNA sequencing analysis and validation by TaqMan qRT-PCR for candidate discovery. Fluorodeoxyglucose-PET (FDG-PET) status before treatment, directly after treatment, and during long-term follow-up was compared directly with EV miRNA levels. RESULTS. The plasma EV miRNA repertoire was more extensive compared with protein-bound miRNA that was heavily dominated by a few abundant miRNA species and was less informative of disease status. Purified EV fractions of untreated cHL patients and tumor EVs had enriched levels of miR24-3p, miR127-3p, miR21-5p, miR155-5p, and let7a-5p compared with EV fractions from healthy subjects and disease controls. Serial monitoring of EV miRNA levels in patients before treatment, directly after treatment, and during long-term follow-up revealed robust, stable decreases in miRNA levels matching a complete metabolic response, as observed with FDG-PET. Importantly, EV miRNA levels rose again in relapse patients. CONCLUSION. We conclude that cHL-related miRNA levels in circulating EVs reflect the presence of vital tumor tissue and are suitable for therapy response and relapse monitoring in individual cHL patients. FUNDING. Cancer Center Amsterdam Foundation (CCA-2013), Dutch Cancer Society (KWF-5510), Technology Foundation STW (STW Perspectief CANCER-ID).


Conflict of interest statement

The authors have declared that no conflict of interest exists.

Figures

Figure 1
Figure 1. Size-exclusion chromatography separates extracellular plasma vesicles from protein/HDL.
(A) EM images of plasma extracellular vesicles (EVs) and protein/HDL fraction after size-exclusion chromatography of 1.5 ml healthy donor plasma. Scale bar: 200 nm. (B) Particle analysis using qNano (iZON) of plasma EV (red) and protein/HDL fraction (blue). (C) High-resolution flow cytometry (BD Influx) of plasma EV (black) and protein/HDL fraction (gray) after pkh67 fluorescent labeling followed by sucrose gradient centrifugation. (D) Scatter plots of plasma EV and protein/HDL fraction corresponding with sucrose gradient fraction D, as shown in C. (E) qNano particle analysis of plasma EV from a healthy donor and a cHL patient. (F) Particle concentration and size using qNano. n = 3 healthy donors and cHL patients. Error bars represent mean ± SEM; dots indicate individual samples.
Figure 2
Figure 2. Small RNA distribution and recovery in EV fractions 9 and 10.
(A and B) RNA distribution of miR142-3p, let7a-5p, and vtRNA1-1 (A) and miR92a-3p, miR21-5p, and miR451-5p (B) in 26 fractions upon size-exclusion chromatography (SEC) of 1.5 ml healthy donor plasma. Total RNA was isolated with TRIzol followed by RT-PCR. Data are depicted as raw Ct values; error bars represent SEM from PCR duplicates. (C) Fold enrichment of vtRNA1-1, let7a-5p, and miR142-3p in plasma extracellular vesicles (EVs) (fractions 9 and 10) compared with protein/HDL (fractions 20 and 21). Data are shown as the mean of 2 donors; dots indicate individual samples. (D) Fold enrichment of miR92a-3p, miR21-5p, and miR451-5p in protein/HDL (fractions 20 and 21) compared with plasma EVs (fractions 9 and 10). Data are shown as the mean of 2 donors; dots indicate individual samples. (E) Fold enrichment of vtRNA1-1 in tumor EV (tEV; fractions 9 and 10) compared with protein/HDL (fractions 20 and 21) after SEC of 1.5 ml B cell culture supernatant. (F) SEC of 1.5 ml healthy donor plasma after spike in with 50 μl tumor cell line–derived exosomes. Shown is the fold increase of EBV-miR BHRF1-3 and BART2-5p in EV (fractions 9 and 10) compared with protein/HDL (fractions 20 and 21). Data are shown as the mean of the 2 consecutive SEC fractions; dots represent individual fractions (E and F).
Figure 3
Figure 3. RNAseq reveals lymphoma-secreted miRNAs in circulating extracellular vesicles.
(A) RNAseq analysis of miR24-3p, miR127-3p, miR155-5p, miR21-5p, and let7a-5p in extracellular vesicles (EVs) isolated from B cell lymphoma cell lines. Data are shown as reads per million miRNA reads (RPM). (B) Number of different miRNAs identified in plasma EV and protein/HDL fractions of healthy donors and cHL patients (n = 3 each). *P < 0.05 (unpaired 2-tailed t test). (C) Distribution of small RNA subclasses in plasma EVs of a healthy individual and a cHL patient. Data shown are of 1 representative donor (n = 3) and depicted as percentage read counts. (D) RNAseq analysis of let7a-5p, miR21-5p, miR127-3p, and miR486-5p in healthy and cHL patient plasma EVs and protein/HDL fractions. Dots represent individual samples; error bars represent mean ± SEM. Reads are normalized using the trimmed mean of M values (TMM) method. (E) As in D, but data are shown as summed read counts.
Figure 4
Figure 4. Study flow chart.
Figure 5
Figure 5. Candidate miRNA levels are elevated in EVs of cHL patients compared with healthy controls.
RT-PCR analysis of miR127-3p (A), miR155-5p (B), miR21-5p (C), let7a-5p (D), miR24-3p (E), and miR10b-5p (F) in plasma extracellular vesicles (EVs) of healthy individuals (n = 9) and cHL patients (n = 20) after size-exclusion chromatography (SEC) and total RNA isolation using TRIzol. For each individual sample, the mean Ct value of SEC fractions 9 and 10 was used. Boxes show the 25%–75% percentile; whiskers show the minimum-maximum; and lines represent the median. *P < 0.05; **P < 0.005; ***P < 0.0005; ****P < 0.0001 (unpaired 2-tailed t test).
Figure 6
Figure 6. miR127-3p EV outperforms total plasma in distinguishing cHL patients from controls.
(A) RT-PCR analysis of miR127-3p in total plasma of healthy controls (n = 7) and cHL patients (n = 8) after RNA isolation using TRIzol-LS. (B) RT-PCR analysis of miR127-3p in extracellular vesicle (EV) fractions of the same healthy individuals and cHL patients as in A after size-exclusion chromatography (SEC) and total RNA isolation. For each individual, the mean Ct value of SEC fractions 9 and 10 is used. (A and B) Boxes show the 25%–75% percentile; whiskers show the minimum-maximum; and lines represent the median. **P < 0.005 (unpaired 2-tailed t test). (C and D) ROC curves of miR127-3p in total plasma (C) and EV fractions (D) of the same healthy individuals and cHL patients as in A and B.
Figure 7
Figure 7. Candidate miRNA markers in plasma EVs correspond with clinical response to treatment.
(A) FDG-PET imaging of a cHL patient at initial diagnosis, during treatment, and at follow-up 4 months after initial diagnosis. T, tumor. Arrows indicate the location of tumor masses at initial diagnosis. (BE) RT-PCR analysis of miR127-3p (B), miR155-5p (C), miR21-5p (D), and let7a-5p (E) in plasma extracellular vesicles (EVs) of the same cHL patient as in A at diagnosis (t = 0), at the end of treatment (t = 3 months), and at long-term follow-up (t = 14 months). Data are shown as a relative decrease compared with t = 0. Dots represent the mean ± SEM of the 2 consecutive size-exclusion chromatography fractions. (F–J) As in A–E, but for a cHL patient who did not reach complete metabolic response. The asterisk indicates a relative low decrease compared with other patients measured.
Figure 8
Figure 8. EV outperforms total plasma for monitoring treatment response and corresponds with TARC.
(A) RT-PCR analysis of miR127-3p in total plasma of cHL patients (n = 7) before and after treatment, after RNA isolation using TRIzol-LS. (B) RT-PCR analysis of miR127-3p in plasma extracellular vesicles (EVs) of the same cHL patients (n = 7) as in A, after size-exclusion chromatography (SEC) and total RNA isolation. For each individual, the mean Ct value of SEC fractions 9 and 10 is used. Boxes show the 25%–75% percentile; whiskers show the minimum-maximum; and lines represent the median. (C and D) As in A and B, but for miR155-5p. (E and F) RT-PCR analysis of miR21-5p, miR155-5p, and miR127-3p in total plasma (E) and in plasma EVs (F) of an individual cHL patient with primary tumor before and after first-line treatment (gray symbols) and a cHL patient with relapsed disease before and after second-line treatment (black symbols). (GJ) RT-PCR analysis of miR127-3p (G), miR155-5p (H), miR21-5p (I), and let7a-5p (J) in plasma EVs of cHL patients before and after treatment (n = 7). Each data point is the mean Ct value of the 2 consecutive SEC fractions 9 and 10. (K) Serum TARC levels in the same cHL patients as in G–J before and after treatment, as measured by ELISA. Data are shown as paired before and after therapy samples (E–K).

References

    1. Cortez MA, Bueso-Ramos C, Ferdin J, Lopez-Berestein G, Sood AK, Calin GA. MicroRNAs in body fluids--the mix of hormones and biomarkers. Nat Rev Clin Oncol. 2011;8(8):467–477. doi: 10.1038/nrclinonc.2011.76. - DOI - PMC - PubMed
    1. Bettegowda C, et al. Detection of circulating tumor DNA in early- and late-stage human malignancies. Sci Transl Med. 2014;6(224):224ra24. doi: 10.1126/scitranslmed.3007094. - DOI - PMC - PubMed
    1. Diehl F, et al. Circulating mutant DNA to assess tumor dynamics. Nat Med. 2008;14(9):985–990. doi: 10.1038/nm.1789. - DOI - PMC - PubMed
    1. Kurtz DM, et al. Noninvasive monitoring of diffuse large B-cell lymphoma by immunoglobulin high-throughput sequencing. Blood. 2015;125(24):3679–3687. doi: 10.1182/blood-2015-03-635169. - DOI - PMC - PubMed
    1. Jones K, Nourse JP, Keane C, Bhatnagar A, Gandhi MK. Plasma microRNA are disease response biomarkers in classical Hodgkin lymphoma. Clin Cancer Res. 2014;20(1):253–264. doi: 10.1158/1078-0432.CCR-13-1024. - DOI - PubMed

Publication types