. 2016 Nov 24:7:13496.
doi: 10.1038/ncomms13496.

Hyperglycaemia induces metabolic dysfunction and glycogen accumulation in pancreatic β-cells

Affiliations

Hyperglycaemia induces metabolic dysfunction and glycogen accumulation in pancreatic β-cells

Melissa F Brereton et al. Nat Commun. .

Abstract

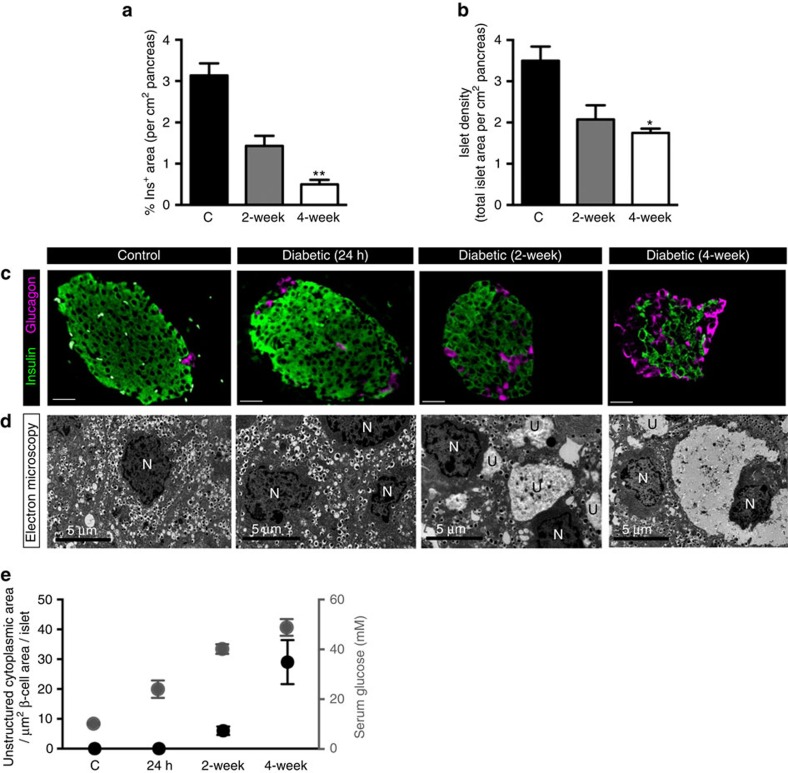
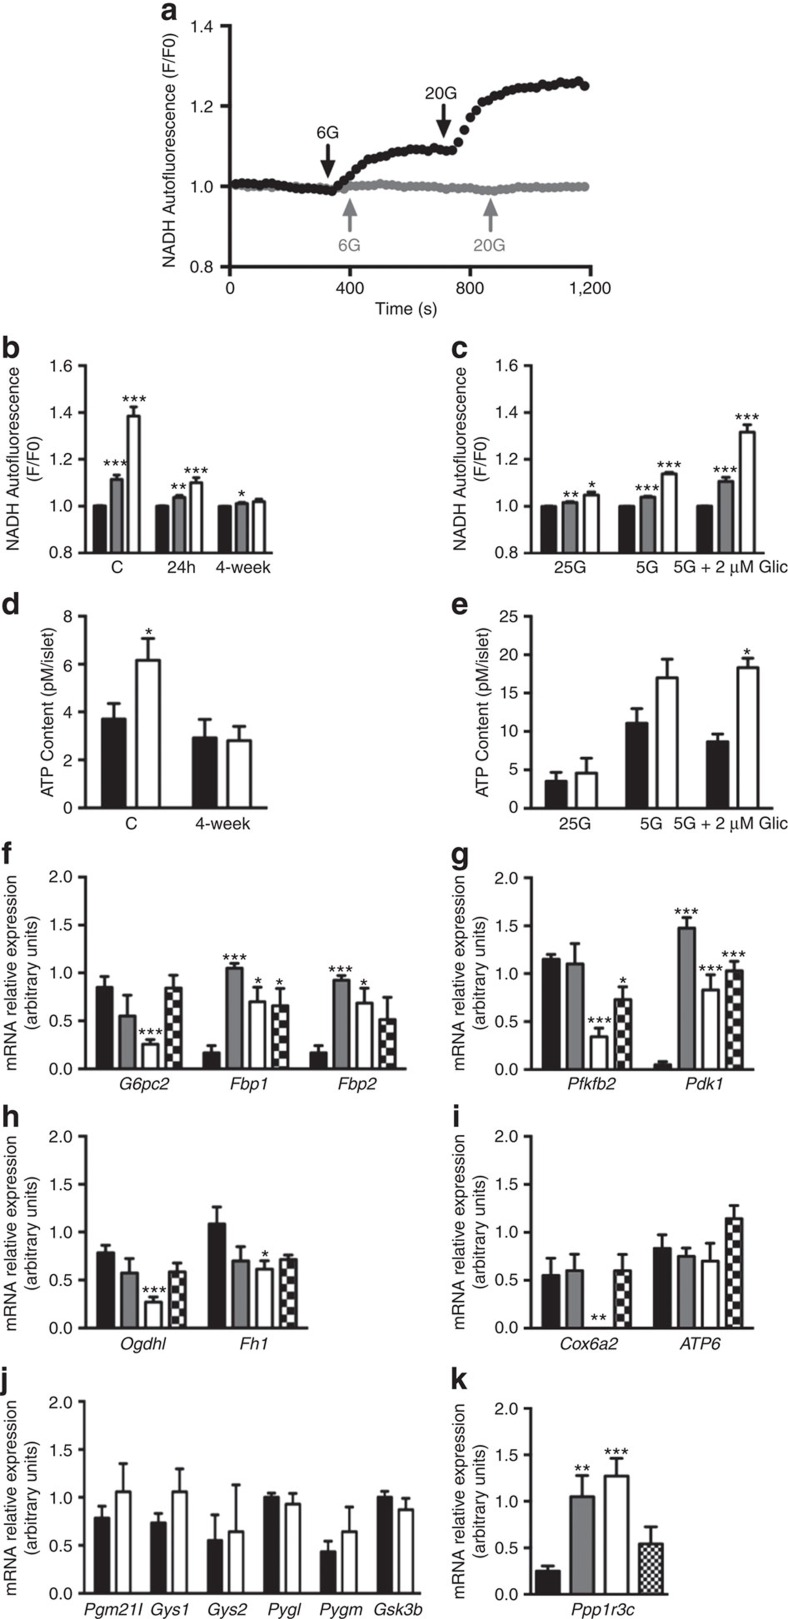
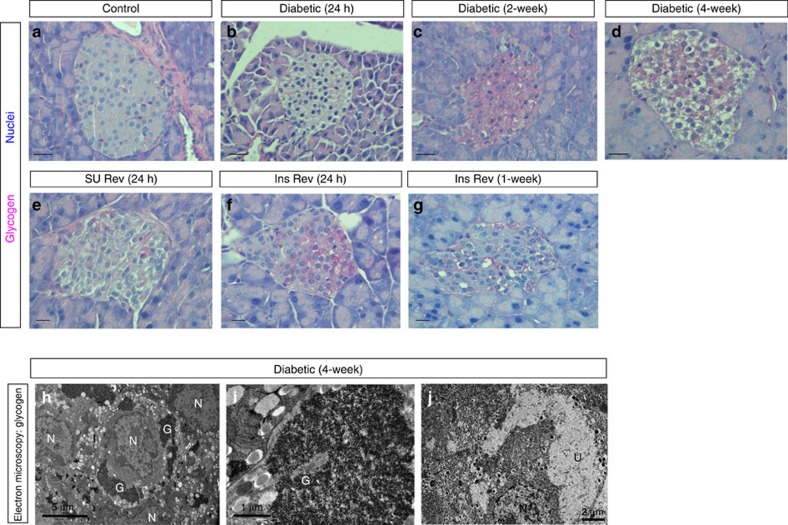
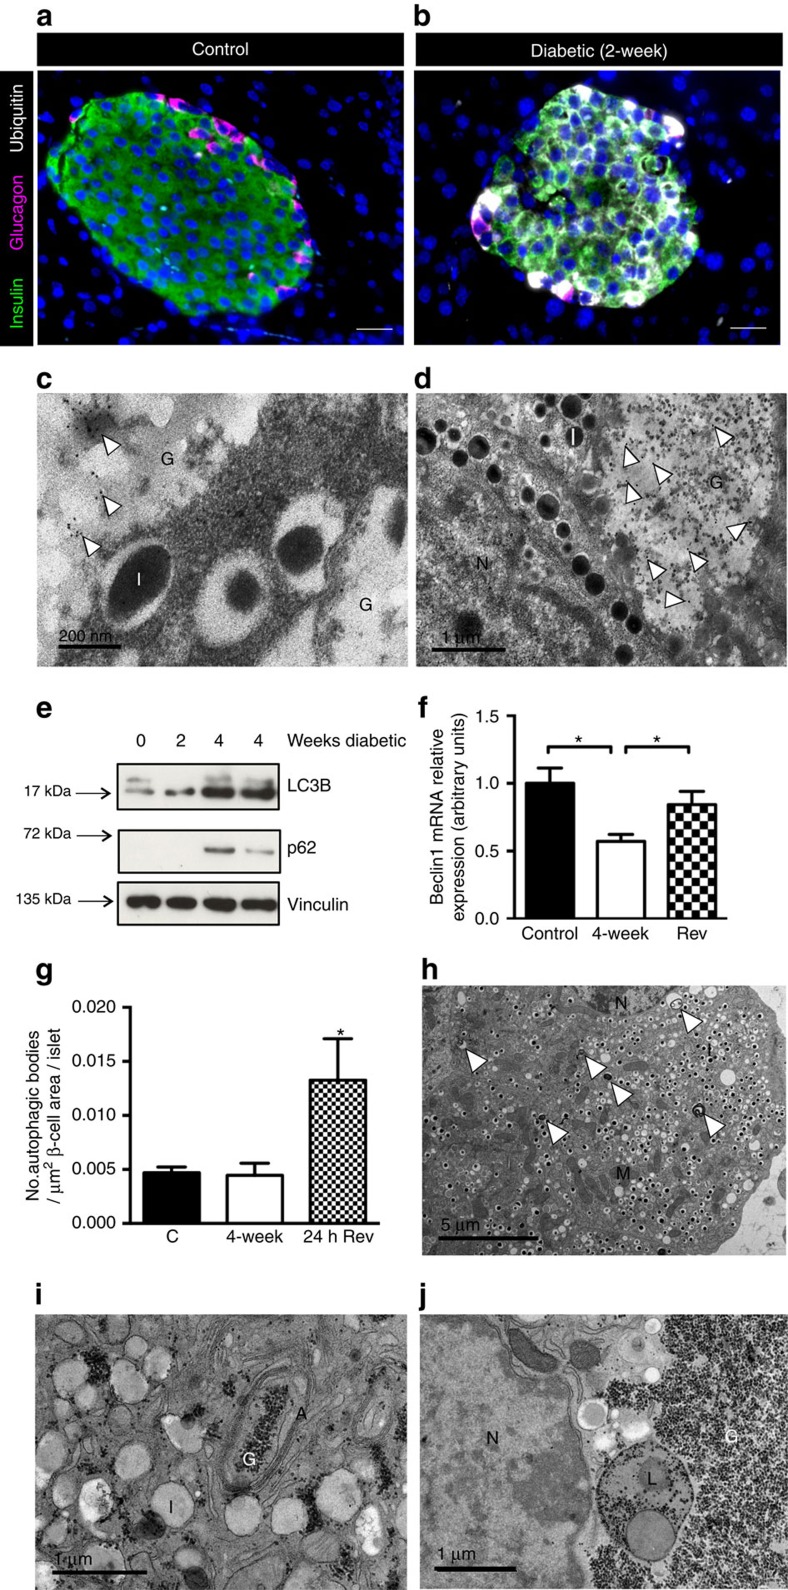
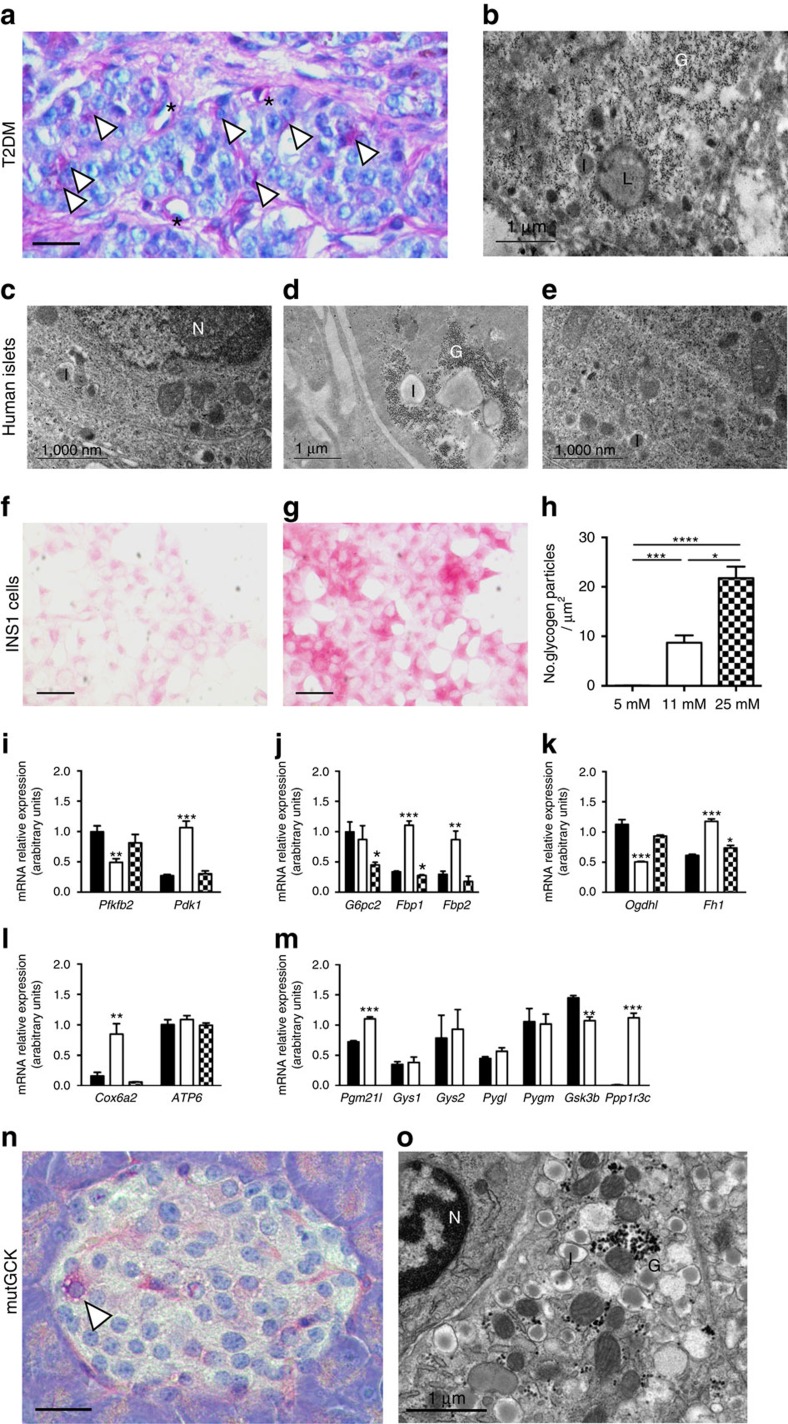
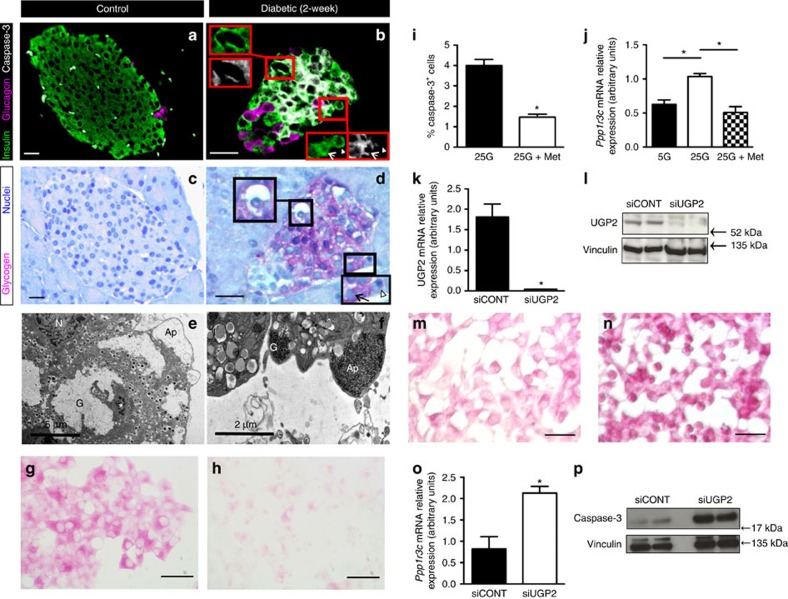
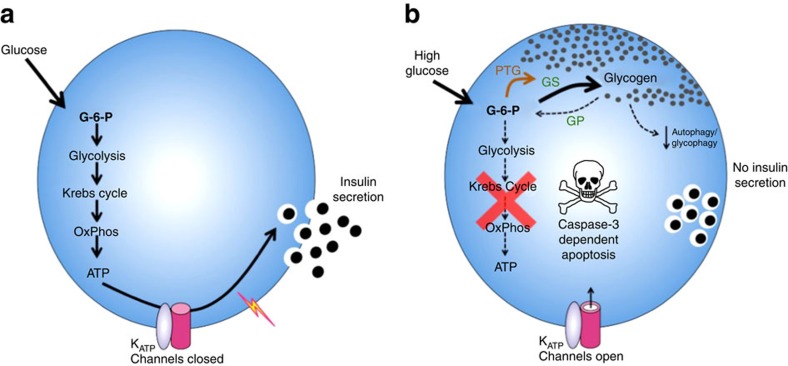
Insulin secretion from pancreatic β-cells is impaired in all forms of diabetes. The resultant hyperglycaemia has deleterious effects on many tissues, including β-cells. Here we show that chronic hyperglycaemia impairs glucose metabolism and alters expression of metabolic genes in pancreatic islets. In a mouse model of human neonatal diabetes, hyperglycaemia results in marked glycogen accumulation, and increased apoptosis in β-cells. Sulphonylurea therapy rapidly normalizes blood glucose levels, dissipates glycogen stores, increases autophagy and restores β-cell metabolism. Insulin therapy has the same effect but with slower kinetics. Similar changes are observed in mice expressing an activating glucokinase mutation, in in vitro models of hyperglycaemia, and in islets from type-2 diabetic patients. Altered β-cell metabolism may underlie both the progressive impairment of insulin secretion and reduced β-cell mass in diabetes.


Figures

Figure 1
Figure 1. Hyperglycaemia in βV59M mice induces progressive changes in β-cell mass and ultrastructure.
(a,b) Mean islet cross-sectional area immunostaining for insulin (a), and total islet area (b), expressed as a percentage of the total cross-sectional area of the pancreas (cm2) in control mice (black bar; n=8), and βV59M mice left diabetic for 2 weeks (gray bar; n=5) or 4 weeks (white bar; n=4). Data are mean±s.e.m. (5 sections per mouse, 100 μm apart). *P<0.05; compared with control; one-way ANOVA followed by post hoc Bonferroni test. (c,d) Representative pancreatic sections from control mice (column 1), βV59M mice left diabetic for 24 h (column 2), 2 weeks (column 3) and 4 weeks (column 4). (c) Islets were immunostained for insulin (green) and glucagon (pink). Scale bars 200 μm. (d) Electron microscopy. N, nucleus. U, unstructured substance. Scale bars 5 μm. Data are representative of 3-4 mice in each case. (e) Serum glucose measurements (white circles) and area of unstructured cytoplasm in β-cells (black circles, calculated from electron micrographs) in control, 24-h, 2-week and 4-week diabetic βV59M mice. For serum glucose measurements ‘n' corresponds to number of mice where, n=26 (control), n=6 (24-h diabetic), n=6 (2-week diabetic) and n=8 (4-week diabetic). For calculation of unstructured cytoplasm ‘n' corresponds to the number of islets from 3–8 mice where, n=8 (control), n=3 (24-h diabetic), n=4 (2-week diabetic) and n=4 (4-week diabetic). Data are mean±s.e.m.
Figure 2
Figure 2. Effects of hyperglycaemia reversal in βV59M mice.
(a) Blood glucose levels of 4-week diabetic βV59M mice implanted with a slow release sulphonylurea pellet at time zero for mice in which euglycaemia was established within 4 days. (b) Mean (±s.e.m.) insulin content of isolated islets (n=4–12 mice). Mice were implanted with either placebo or glibenclamide pellets immediately after gene induction and elevation of blood glucose to >20 mM. The duration of diabetes is indicated above and that of glibenclamide therapy below. *P<0.05; *, P<0.01. NS, not significant (t-test). (c,d) Representative pancreatic sections from 4-week diabetic βV59M mice after 24-h treatment with the sulphonylurea glibenclamide (SU reversal, left), or treatment with insulin for 24 h (middle) or 1 week (right). (c) Islets immunostained for insulin (green) and glucagon (pink). Scale bar (200 μm). (d) Electron microscopy. N, nucleus. U, unstructured substance. Scale bars 4 μm (left), 5 μm (middle, right). Data are representative of 3–4 mice in each case. (e) Mean (±s.e.m.) area of unstructured cytoplasm in β-cells (calculated from electron micrographs of isolated islets) from 4-week diabetic βV59M mice (n=4 islets) and 4-week diabetic βV59M mice treated for 24 h with glibenclamide (n=4 islets) or insulin (n=6 islets).
Figure 3
Figure 3. Diabetic βV59M mice have altered glucose metabolism and gene expression.
(a) Representative changes in NAD(P)H autofluorescence measured in response to 6 mM and 20 mM glucose from islets isolated from a control mouse (black trace) or a 4-week diabetic βV59M mouse (gray trace). Data are normalized to the level in 1 mM glucose. (b) Mean (±s.e.m.) NAD(P)H autofluorescence produced by 1 mM (black bars) 6 mM (gray bars) and 20 mM glucose (white bars) in control islets (n=7 islets from 3 mice) and islets isolated from 24h (n=7 islets from 4 mice) and 4-week diabetic βV59M mice (n=9 islets from 4 mice). *P<0.05, ** P<0.01, ***P<0.001 v. 2 mM glucose (t-test). (c) Mean (±s.e.m.) NAD(P)H autofluorescence produced by 1 mM (black bars) 6 mM (gray bars) and 20 mM glucose (white bars) in islets isolated from 4-week diabetic βV59M mice and then cultured at 25 mM glucose (n=5 islets), 5 mM glucose (n=8 islets) or 5 mM glucose plus 2 μM gliclazide (n=8 islets) for 72 h. *P<0.05, ** P<0.01, ***P<0.001 v. 2 mM glucose (t-test). (d) Mean (±s.e.m.) ATP content of control (C; n=6 mice) and 4-week diabetic βV59M (4-week n=5 mice) islets incubated for 1 h in 2 mM (black bars) or 20 mM glucose (white bars). *P<0.05 versus control (t-test). (e) Mean (±s.e.m.) ATP content of islets incubated at 2 mM glucose (black bars) or 20 mM glucose (white bars) for 1 h. Islets were isolated from 4-week diabetic βV59M mice (n=4 mice) and cultured at 25 mM glucose, 5 mM glucose, or 5 mM glucose plus 2 μM gliclazide, or 25 mM glucose for 72 h before experiment. *P<0.05 versus control (t-test). (fk) Quantitative PCR of mRNA isolated from islets from control mice (black bars; n=6 mice) or from βV59M mice 24 h (gray bars; n=4 mice) and 4 weeks (white bars; n=7 mice) after diabetes onset, or after 4 weeks of diabetes and 4 weeks of glibenclamide therapy (hatched bars; n=7 mice). Genes assayed are involved in gluconeogenesis (f) glycolysis (g), Krebs cycle (h), oxidative phosphorylation (i), and glycogen metabolism (j,k). Data are mean±s.e.m. *P<0.05, ** P<0.01, ***P<0.001 v. control (t-test).
Figure 4
Figure 4. Glycogen accumulates in βV59M mice.
(ag) Representative pancreatic sections showing PAS staining for glycogen (pink) from control mice (a); βV59M mice left diabetic for 24 h (b), 2 weeks (c) or 4 weeks (d); and βV59M mice left diabetic for 4 weeks and then treated with glibenclamide (SU) for 24 h (e) or with insulin (Ins) for 24 h (f) or 1-week (g). Scale bars, 200 μm. (hj) Electron micrographs from 4-week diabetic βV59M mice obtained using lead-citrate fixation (h,i), which preserves glycogen granules, or using conventional fixation (j), which leads to loss of glycogen and produces an electrolucent cytoplasm. Note insulin granules appear pale and without a ‘halo' using lead-citrate fixation. N, nucleus; G, glycogen; U, unstructured substance (=glycogen); I, insulin granules. Scale bars 5 μm (left), 1 μm (middle) 2 μm (right).
Figure 5
Figure 5. βV59M mice have altered protein turnover.
(a,b) Representative pancreatic sections immunostained for insulin (green), glucagon (pink) and ubiquitin (white) from control mice (a) and 4-week diabetic βV59M mice (b). Scale bars 200 μm. (c,d) Representative electron micrographs of islets isolated from 4-week diabetic βV59M mice showing immunogold labelling for ubiquitin (c, arrowed) or p62 (d, arrowed). Scale bars 200 nm (c), 1 μm (d). I, insulin granule. G, glycogen. N, nucleus. (e) Western blot analysis for LC3B, p62 and vinculin (loading control) in islets isolated from control, 2-week and 4-week diabetic βV59M mice. The lower band in the LC3B blot is LC3B-II. Data are representative of 3 experiments. (f) Quantitative PCR of beclin-1 mRNA in islets isolated from control mice (black bars; n=6 mice) and βV59M mice 4 weeks after diabetes onset (white bars; n=7 mice), or after 4 weeks of diabetes and 4 weeks of glibenclamide therapy (hatched bars; n=7 mice). Data are mean±s.e.m., n=6-8 mice per genotype. *P<0.05 (t-test). (g) Mean (±s.e.m.) density of autophagosomes in islets of control mice (black bars, n=8 mice) and βV59M mice after 4 weeks of diabetes (white bars, n=4 mice), or after 4 weeks diabetes plus 24-h diabetes reversal with glibenclamide (hatched bars, n=4 mice). *P<0.05 versus control (c, t-test). Autophagosomes were counted from 10 fields of view per islet and expressed per μm2 of β-cell cytoplasm. (hj) Representative electron micrographs from 4-week diabetic βV59M mouse treated with glibenclamide for 48 h (24-h euglycaemia). Arrowheads (h) denote autophagosomes. A, autophagosomes. G, glycogen granules. N, nucleus. I, insulin granule. L, lysosome. M, mitochondrion. Scale bar 5 μm (h), 1 μm (i,j).
Figure 6
Figure 6. Hyperglycaemia alters glucose handling in human and rodent islets, and in INS-1 cells.
(a,b) Representative light microscope pancreatic section (a) and β-cell electron micrograph (b) from two different organ donors with type 2 diabetes. In each case, data are representative of 12 patients with type 2 diabetes and fasting blood glucose levels of 10–16 mM. (a) Section stained for glycogen with PAS (pink) and for nuclei with haematoxylin (blue). Scale bar, 200 μm. Arrowheads denote glycogen; * denotes an ‘empty' cell. (b) G, glycogen. I, insulin granule. L, lysosome. Scale bar 1 μm. (ce) Representative electron micrographs of isolated islets from non-diabetic organ donors following 48-h culture at 5 mM (c) or 25 mM glucose (d), or 48 h at 25 mM glucose followed by 24 h in 5 mM glucose (e). Data are representative of islets from three donors. I, insulin granule. N, nucleus. G, glycogen granules. Scale bars 1 μm. (f,g) Representative images of PAS-stained INS-1 cells following 48-h culture in 5 mM (f) or 25 mM glucose (g). Scale bars 200 μm. (h) Mean (±s.e.m.) number of glycogen particles measured from electron micrographs in INS-1 cells cultured for 48 h at 5 mM glucose (n=29 cells), 11 mM glucose (n=37 cells), and 25 mM glucose (n=24 cells). *P<0.05, ** P<0.01, ***P<0.001 (Mann–Whitney test). (im) Quantitative PCR of mRNA isolated from INS-1 cells cultured for 24 h at 2 mM (black bars) or 25 mM glucose (white bars); or 24 h at 25 mM glucose followed by 24 h at 2 mM glucose (hatched bars). Genes assayed are involved in gluconeogenesis (i), glycolysis (j), the Krebs cycle (k), oxidative phosphorylation (l), and glycogen metabolism (m). Data are mean±s.e.m. (n=4). *P<0.05, ** P<0.01, ***P<0.001 versus 2 mM glucose (t-test). (n,o) Representative pancreatic section stained for glycogen (PAS; pink) and nuclei (haematoxylin; blue) (n) and β-cell electron micrograph (o) from mutGCK mice 4 days after gene induction. (n) Arrow indicates a β-cell containing glycogen. Scale bar, 200 μm. (o) N, nucleus. I insulin granule. G, glycogen particles. Scale bar, 1 μm.
Figure 7
Figure 7. Hyperglycaemia in βV59M mice promotes apoptosis.
(ad) Representative serial pancreatic sections from control mice (a,c) and βV59M mice after 2 weeks diabetes (b,d). Above, immunofluoresence for insulin (green), glucagon (pink) and cleaved-caspase-3 (white). Below, PAS staining for glycogen (pink) and haematoxylin staining for nuclei (blue). Scale bars, 200 μm. (b,d) Insets top left show an ‘empty' β-cell staining for glycogen, insulin and cleaved-caspase-3. Insets bottom right show insulin+-positive β-cells containing (arrowed) or lacking (arrowhead) both glycogen and cleaved-caspase-3. (e,f) Electron micrographs from 4-week diabetic βV59M mice using conventional fixation, which leads to loss of glycogen and electrolucent cytoplasm (e) or lead-citrate fixation, which preserves glycogen (f). Apoptotic bodies (Ap) filled with glycogen are evident in E (as electrolucent cytoplasm) and F (as glycogen granules, G). N, nucleus, *apoptotic nucleus. Scale bar 5 μm (e), 2 μm (f). (g,h) PAS-stained INS-1 cells following 48-h culture in 25 mM glucose without (g) or with 0.5 mM metformin (h). (i) Mean±s.e.m. number of cleaved-caspase-3 positive INS-1 cells, expressed as a percentage of the total number of INS-1 cells, for cells cultured for 48-h at 25 mM glucose with (black bar), or without 0.5 mM metformin (white bar). n=25 fields of view from three experiments. *P<0.05 (t-test). (j) Quantitative PCR of Ppp1r3c mRNA from INS-1 cells cultured for 48-h in 5 mM glucose (black bar), and 25 mM glucose with (white bar) or without (checked bar) 0.5 mM metformin. Data are mean±s.e.m. (n=3). *P<0.05 (t-test). (k,l) UGP2 mRNA (k) and protein (l) levels in INS-1 cells 72 h after treatment with control (siCONT) or UGP2 (siUGP2) siRNA and culture for 48-h at 25 mM glucose. Data are mean±s.e.m. (n=3). *P<0.05. (m,n) Representative images of PAS-stained INS-1 cells 72 h after treatment with control (m) or UGP2 (n) siRNA and culture for 48-h at 25 mM glucose. Data are representative of three experiments. (o) Quantitative PCR of Ppp1r3c mRNA in INS-1 cells 72 h after treatment with control (black bars) or UGP2 (white bars) siRNA and culture for 48-h at 25 mM glucose. Data are mean±s.e.m. (n=3). *P<0.05 (t-test). (p) Western blots of cleaved caspase-3 and vinculin (loading control) from INS-1 cells treated with control (siCONT) or UGP2 (siUGP2) siRNA 72 hrs previously and then cultured for 48-h at 25 mM glucose (n=3).
Figure 8
Figure 8. Suggested mechanism for β-cell dysfunction and apoptosis.
(a) In response to a rise in blood glucose, glucose enters the β-cell and is phosphorylated to glucose-6-phosphate (G6P). It is then metabolized via glycolysis and oxidative phosphorylation to produce ATP. ATP inhibits the ATP-sensitive K+ channel (KATP) and thereby promotes membrane depolarization and insulin secretion. (b) Chronic hyperglycaemia leads to impaired oxidative metabolism and reduced ATP generation in response to glucose, thereby preventing KATP channel closure, electrical activity and insulin secretion. Hyperglycaemia leads to elevation of G6P, which stimulates glycogen synthase and also leads to elevation of Ppp1r3c (PTG), both of which promote glycogen accumulation. Hyperglycaemia may also impair autophagy, further increasing glycogen storage and enhancing β-cell death. KATP, ATP-sensitive K+ channel. G6P, glucose-6-phosphate. PTG, protein targeting to glycogen (Ppp1r3c). GS, glycogen synthase. GP, glycogen phosphorylase.

References

    1. Weir G. C., Aguayo-Mazzucato C. & Bonner-Weir S. Beta-cell dedifferentiation in diabetes is important, but what is it? Islets 5, 233–237 (2013). - PMC - PubMed
    1. Jonas J. C. et al.. Chronic hyperglycemia triggers loss of pancreatic beta cell differentiation in an animal model of diabetes. J. Biol. Chem. 274, 14112–14121 (1999). - PubMed
    1. Brereton M. F. et al.. Reversible changes in pancreatic islet structure and function produced by elevated blood glucose. Nat. Commun. 5, 4639 (2014). - PMC - PubMed
    1. Girard C. A. et al.. Expression of an activating mutation in the gene encoding the KATP channel subunit Kir6.2 in mouse pancreatic beta cells recapitulates neonatal diabetes. The Journal of clinical investigation 119, 80–90 (2009). - PMC - PubMed
    1. Henquin J. C. Triggering and amplifying pathways of regulation of insulin secretion by glucose. Diabetes 49, 1751–1760 (2000). - PubMed

Publication types

MeSH terms