. 2016 Nov 24:7:13656.
doi: 10.1038/ncomms13656.

Multiple myeloma risk variant at 7p15.3 creates an IRF4-binding site and interferes with CDCA7L expression

Affiliations

Multiple myeloma risk variant at 7p15.3 creates an IRF4-binding site and interferes with CDCA7L expression

Ni Li et al. Nat Commun. .

Abstract

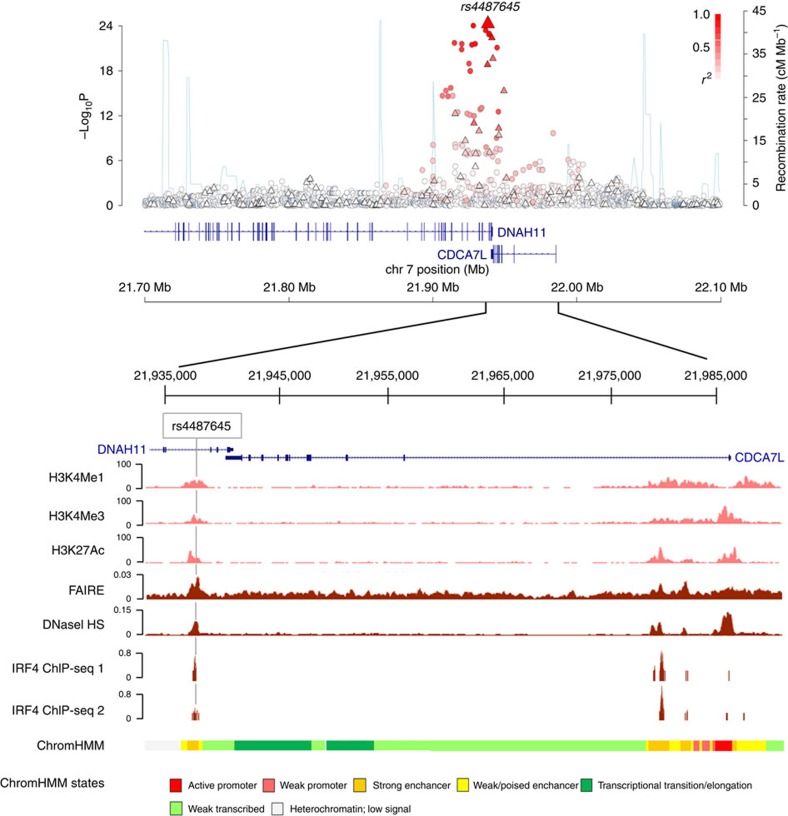
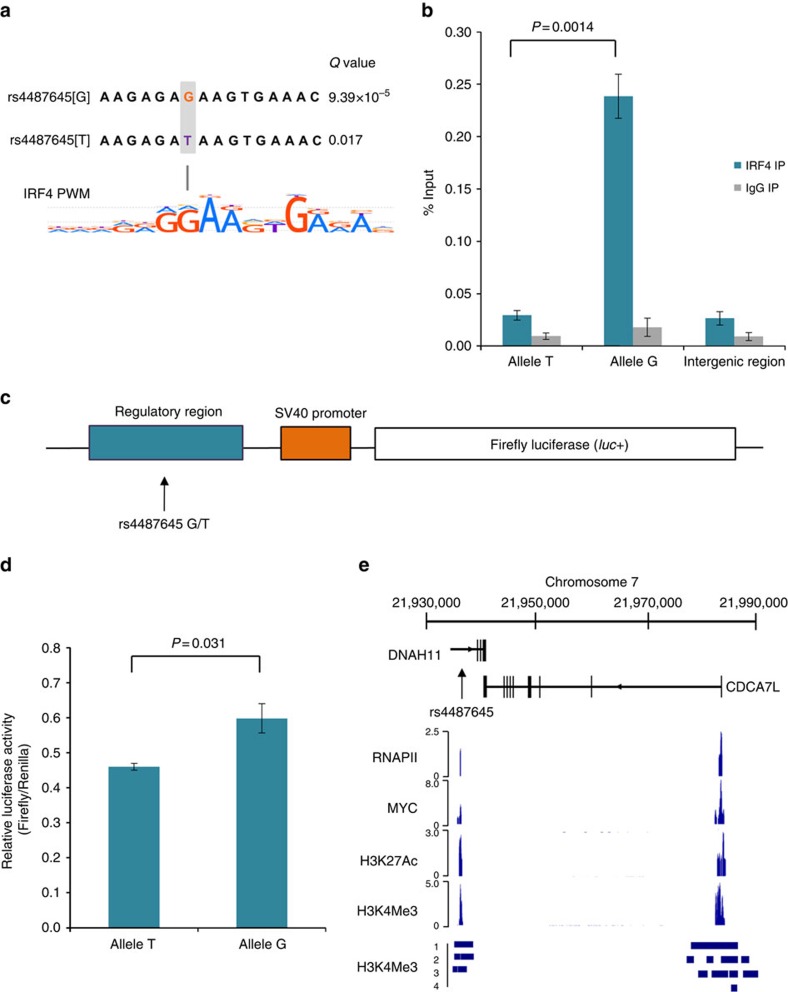
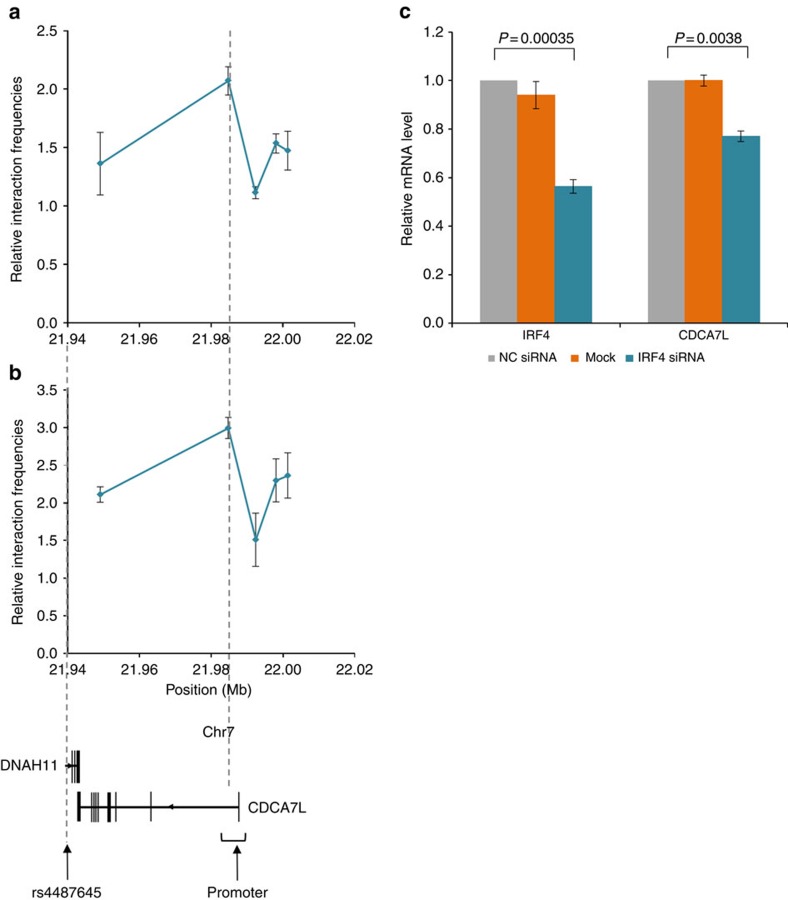
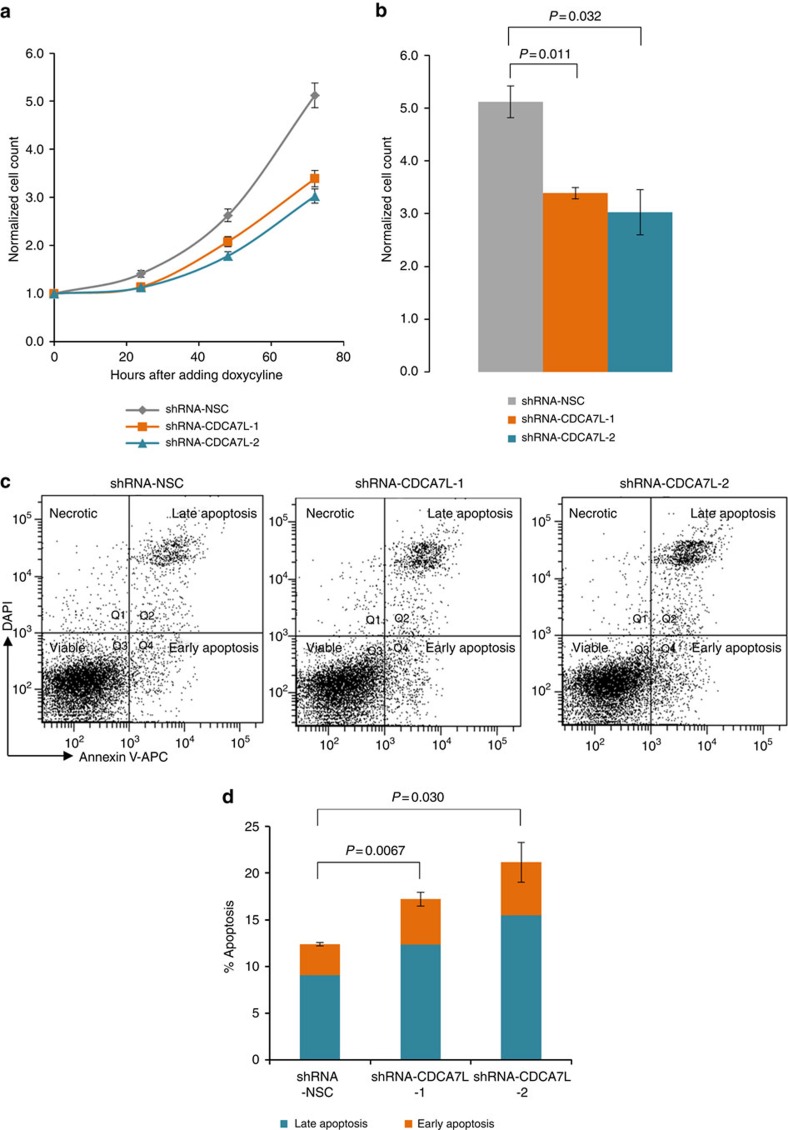
Genome-wide association studies have identified several risk loci for multiple myeloma (MM); however, the mechanisms by which they influence MM are unknown. Here by using genetic association data and functional characterization, we demonstrate that rs4487645 G>T, the most highly associated variant (P = 5.30 × 10⁻²⁵), resides in an enhancer element 47 kb upstream of the transcription start site of c-Myc-interacting CDCA7L. The G-risk allele, associated with increased CDCA7L expression (P=1.95 × 10-36), increases IRF4 binding and the enhancer interacts with the CDCA7L promoter. We show that suppression of CDCA7L limits MM proliferation through apoptosis, and increased CDCA7L expression is associated with adverse patient survival. These findings implicate IRF4-mediated CDCA7L expression in MM biology and indicate how germline variation might confer susceptibility to MM.


Figures

Figure 1
Figure 1. Genetic mapping and epigenetic landscape at the 7p15.3 locus.
Manhattan plot of 7p15.3 is shown with genotyped (triangles) and imputed (circles) SNPs. −log10 P values (y axis) of the SNPs are shown according to their chromosomal positions (x axis; NCBI build 37 of the human genome). The top genotyped SNP (rs4487645) is labelled with a large triangle. The colour intensity of each symbol in the Manhattan plot reflects the extent of linkage disequilibrium with rs4487645, from white (r2=0) to dark red (r2=1.0). Genetic recombination rates are estimated using HapMap Utah residents of Western and Northern European ancestry (CEU) samples, and shown with a light blue line. The relative positions of DNAH11 and CDCA7L transcripts mapping to 7p15.3 are shown. The chromatin state of the DNAH11CDCA7L gene locus in GM12878 is detailed with H3K4Me1, H3K4Me3, H3K27Ac, FAIRE, DNaseI HS studies and chromatin state segmentation track (ChromHMM), with called peaks on two replicates of IRF4 ChIP-seq in GM12878 shown below accessed from the UCSC Genome Browser. Position of rs4487645 is highlighted with grey line.
Figure 2
Figure 2. SNP rs4487645 shows allele-specific binding of IRF4 and confers enhancer regulatory activity in multiple myeloma cells.
(a) rs4487645 is located in an IRF4 DNA-binding motif predicted by Find Individual Motif Occurrences (FIMO). Shown below is the IRF4 position weight matrix generated by HOCOMOCO. G-risk allele is highlighted in red. (b) ChIP–qPCR using either the anti-IRF4 or isotype control antibody was performed on GM11992 heterozygous for rs4487645. The ChIP–qPCR signal is based on the abundance of allele-specific amplicons for rs4487645 in the immunoprecipitated DNA, relative to input DNA. Also shown is the relative abundance of intergenic control region. ChIP data show differential binding of IRF4 for the risk G-allele relative to the T-allele. Data shown are mean±s.e.m. from three biological replicates and assessed by two-tailed t-test. Each qPCR reaction was performed with three technical replicates. (c) An ∼1 kb putative regulatory sequence flanking rs4487645 (G/T) was cloned upstream of the SV40 promoter in the pGL3-promoter vector for testing luciferase reporter gene activity. (d) The resultant reporter constructs were transiently transfected into KMS11, and the relative luciferase activity was measured for each reporter gene construct. The luminescence ratio of the experimental vector to the Renilla internal control, pRL-SV40, was normalized to the backbone pGL3-SV40 promoter vector. Data shown are mean±s.e.m. from four biological replicates and assessed by two-tailed t-test. (e) The chromatin state of the DNAH11CDCA7L gene locus is detailed with RNA polymerase II (RNAPII), MYC, H3K4Me3 and H3K27Ac ChIP-seq data from MM cell line MM1.S (GSE36354). ChIP-seq data in four MM patients (labelled 1–4) show MM-unique H3K4Me3-occupied regions compared with normal bone marrow plasma cells (GSE53215).
Figure 3
Figure 3. Physical interaction between SNP rs4487645 and CDCA7L promoter and the regulation of IRF4 on CDCA7L.
Long-range interactions detected between fragments mapping to rs4487645 and the CDCA7L promoter in GM11992 (a) and KMS11 (b). Relative interaction frequencies between rs4487645 and target regions ∼70 kb upstream were determined by 3C-qPCR, comparing the relative abundance of ligation products formed between the fragment mapping to rs4487645 and each of the target fragments±s.e.m., normalized to the relative abundance of intersite control region. Each qPCR reaction was performed with three technical replicates. The assay was performed independently for three times in both GM11992 and KMS11. (c) qPCR analysis of the siRNA knockdown of IRF4. Data shown are the mean IRF4 and CDCA7L mRNA levels±s.e.m. relative to the GAPDH reference mRNA level, normalized to control siRNA (NC siRNA). Data also show relative mRNA level of IRF4 and CDCA7L for mock transfection without siRNA oligos. Each qPCR reaction was performed with three technical replicates. P values were determined with two-tailed t-test over three biological replicates.
Figure 4
Figure 4. CDCA7L knockdown induces cell apoptosis and suppresses cellular proliferation.
(a) Data shown are the mean cell counts of viable Trypan-blue-negative cells±s.e.m. for three biological replicates at 24, 48 and 72 h after addition of doxycycline (final concentration 1 μg ml−1). Data were normalized to initial seeding number at 0 h when doxycycline was added to cells. (b) P values assessing the differences in normalized cell counts between CDCA7L and control knockdowns at 72 h were determined using two-tailed t-test. (c) Cell viability at 72 h after addition of doxycycline was assessed with FACS using Annexin V-APC and 4,6-diamidino-2-phenylindole. Representative fluorescence-activated cell sorting data show four subgroups of cells: the lower left quadrant (Q3; unstained) represents the viable cell population; the lower right (Q4; Annexin V-APC+ DAPI−) contains early apoptotic cells; the upper right quadrant (Q2; Annexin V-APC+ DAPI+) represents late apoptotic cells; the upper left (Q1; Annexin V-APC− DAPI+) represents necrotic cells. (d) The percentages of apoptotic cells of shRNA-CDCA7L-1, shRNA-CDCA7L-2 and shRNA-NSC are shown at 72 h after addition of doxycycline. Data shown are mean±s.e.m. for three biological replicates. P values were determined with two-tailed t-test.

References

    1. Edwards S. L., Beesley J., French J. D. & Dunning A. M. Beyond GWASs: illuminating the dark road from association to function. Am. J. Hum. Genet. 93, 779–797 (2013). - PMC - PubMed
    1. Broderick P. et al. Common variation at 3p22.1 and 7p15.3 influences multiple myeloma risk. Nat. Genet. 44, 58–61 (2012). - PMC - PubMed
    1. Chubb D. et al. Common variation at 3q26.2, 6p21.33, 17p11.2 and 22q13.1 influences multiple myeloma risk. Nat. Genet. 45, 1221–1225 (2013). - PMC - PubMed
    1. Swaminathan B. et al. Variants in ELL2 influencing immunoglobulin levels associate with multiple myeloma. Nat. Commun. 6, 7213 (2015). - PMC - PubMed
    1. Mitchell J. S. et al. Genome-wide association study identifies multiple susceptibility loci for multiple myeloma. Nat. Commun. 7, 12050 (2016). - PMC - PubMed

Publication types

MeSH terms

Substances