. 2016 Nov 24:7:13344.
doi: 10.1038/ncomms13344.

Macrophage-dependent IL-1β production induces cardiac arrhythmias in diabetic mice

Affiliations

Macrophage-dependent IL-1β production induces cardiac arrhythmias in diabetic mice

Gustavo Monnerat et al. Nat Commun. .

Erratum in

Abstract

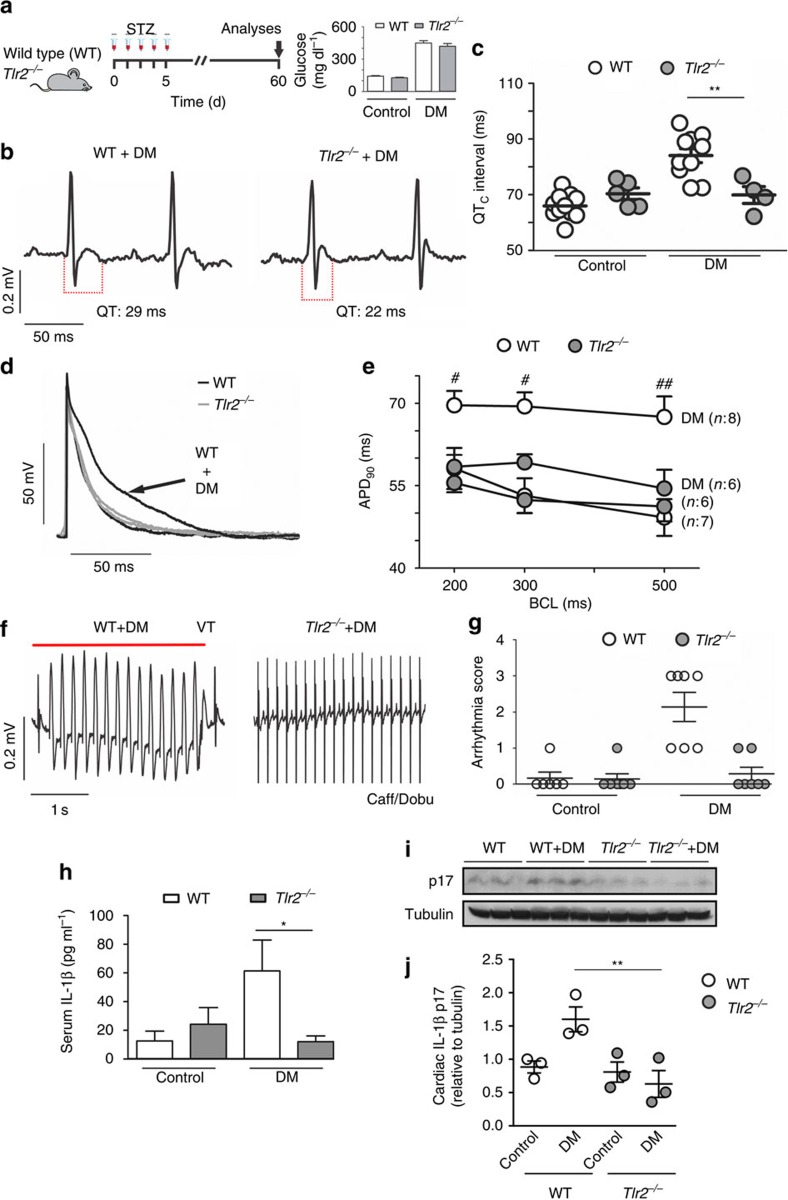
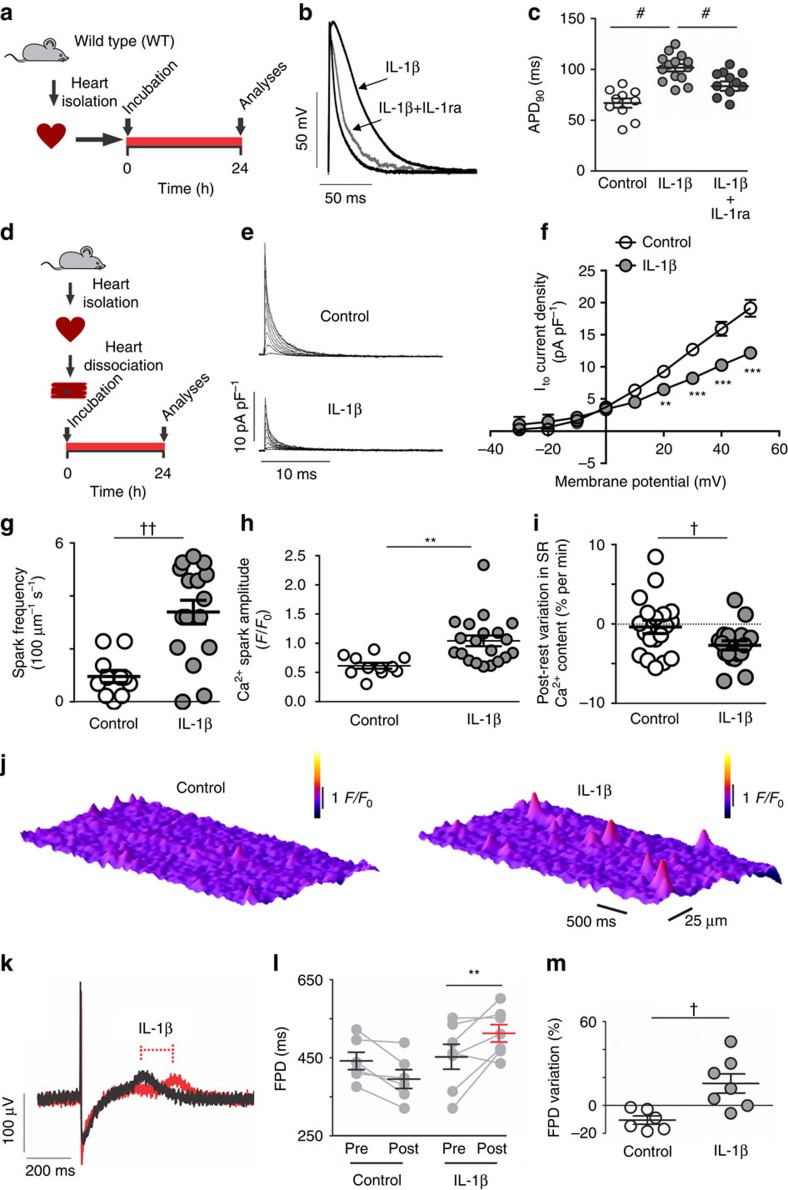
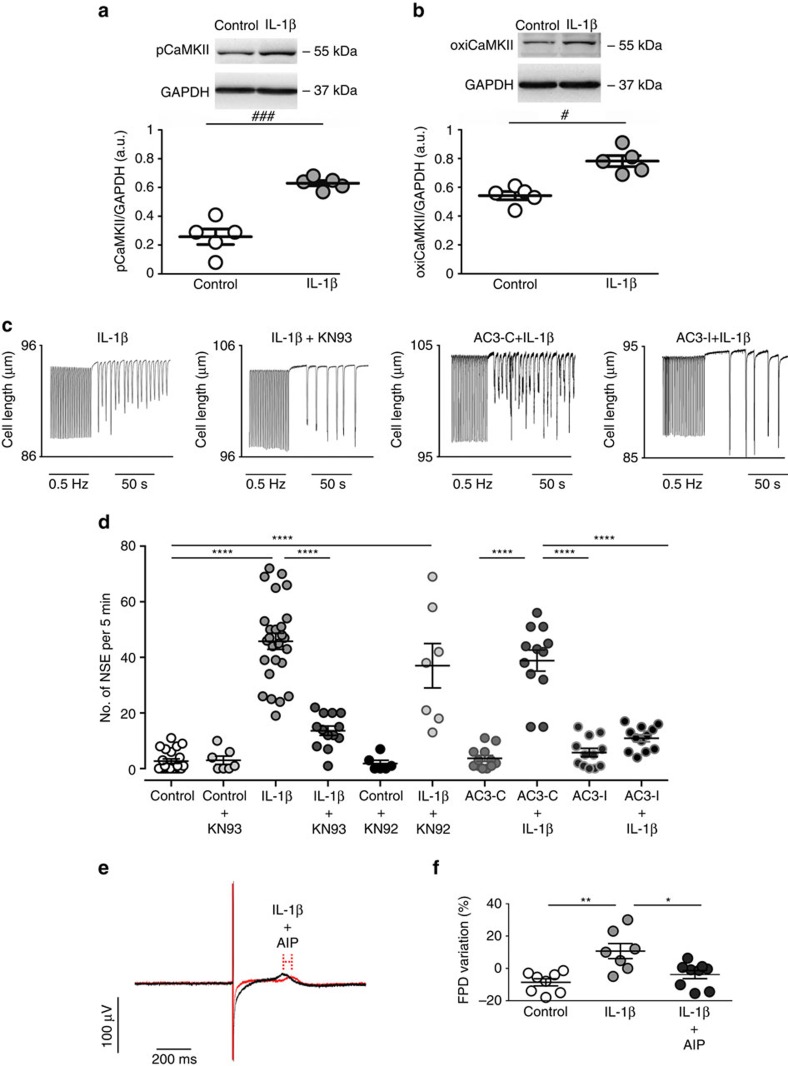
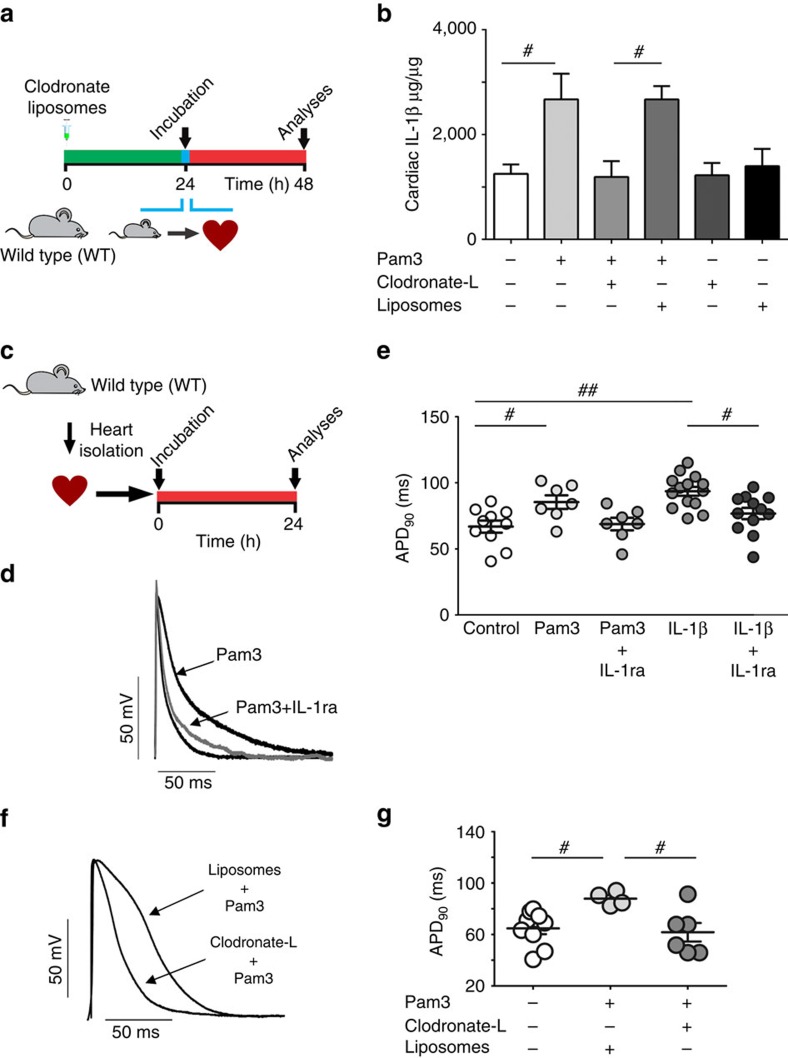
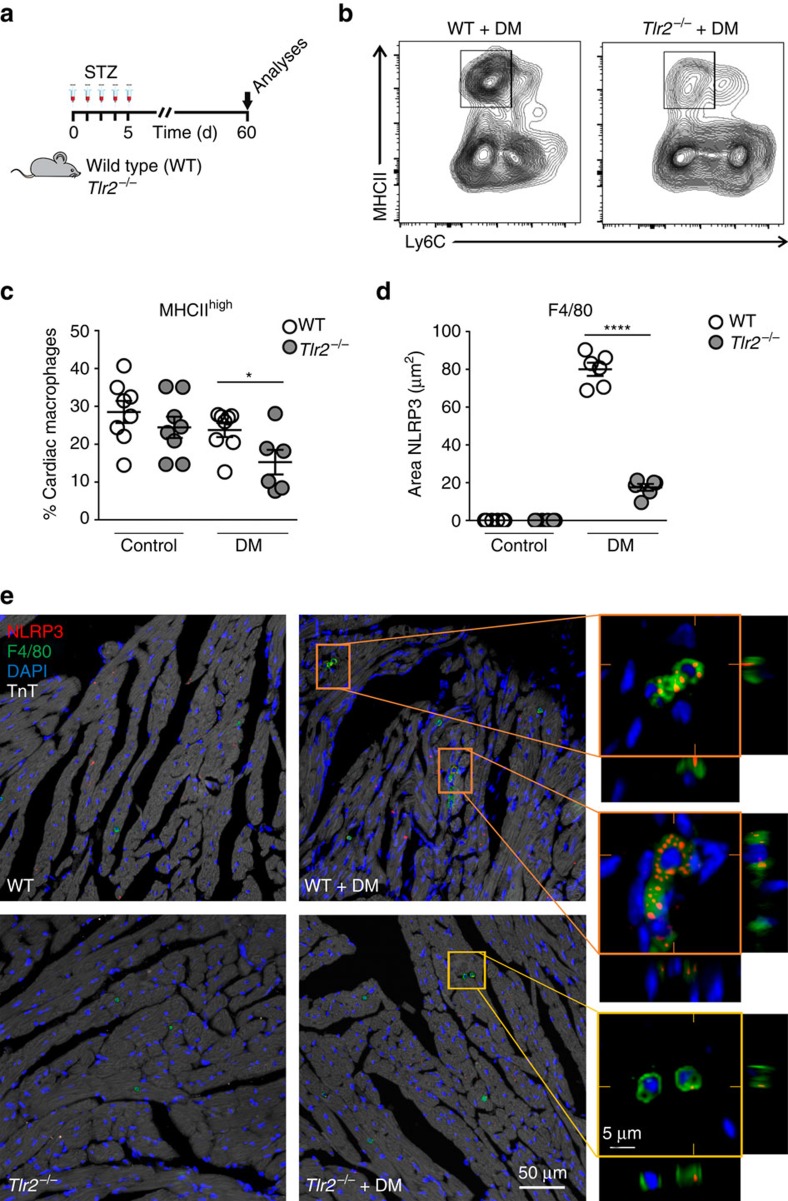
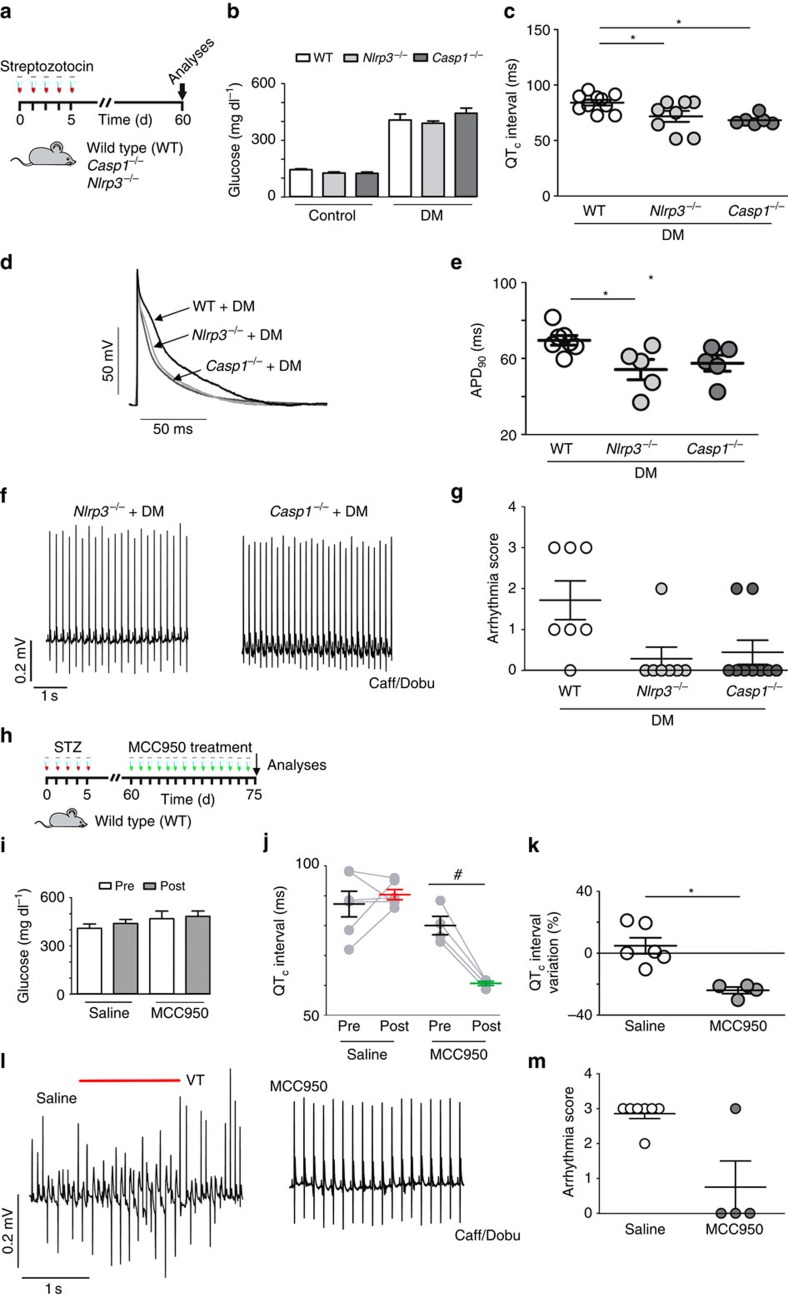
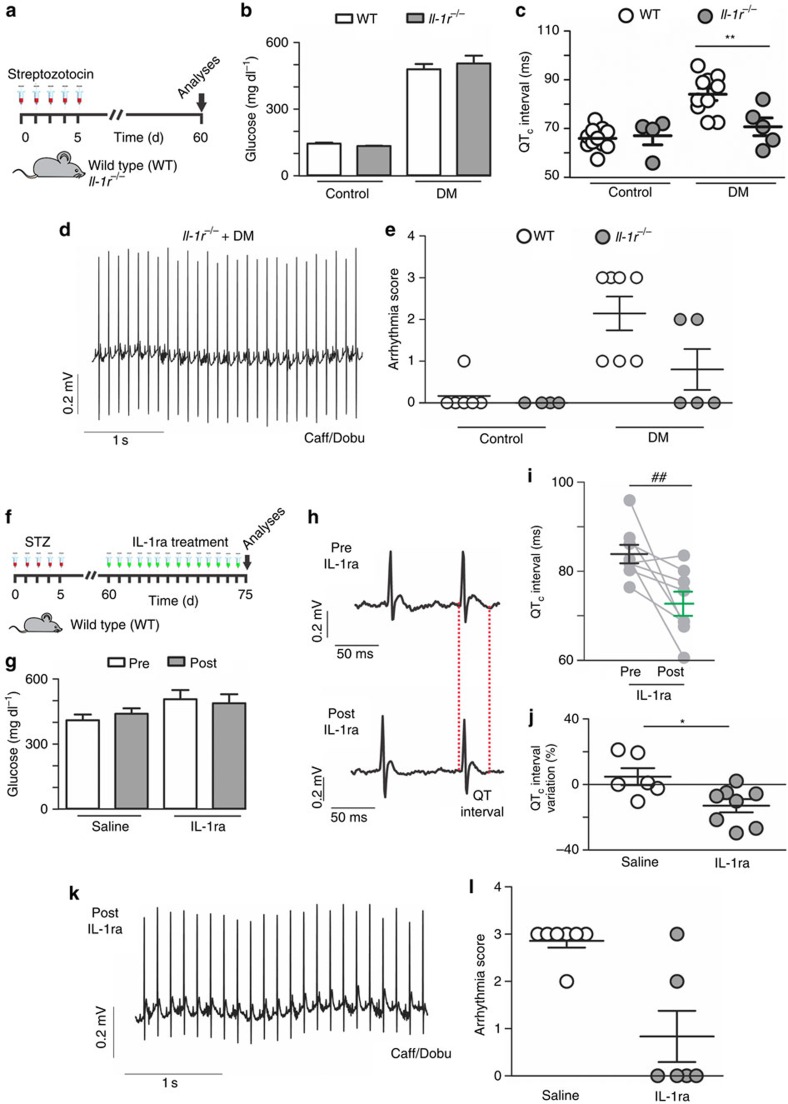
Diabetes mellitus (DM) encompasses a multitude of secondary disorders, including heart disease. One of the most frequent and potentially life threatening disorders of DM-induced heart disease is ventricular tachycardia (VT). Here we show that toll-like receptor 2 (TLR2) and NLRP3 inflammasome activation in cardiac macrophages mediate the production of IL-1β in DM mice. IL-1β causes prolongation of the action potential duration, induces a decrease in potassium current and an increase in calcium sparks in cardiomyocytes, which are changes that underlie arrhythmia propensity. IL-1β-induced spontaneous contractile events are associated with CaMKII oxidation and phosphorylation. We further show that DM-induced arrhythmias can be successfully treated by inhibiting the IL-1β axis with either IL-1 receptor antagonist or by inhibiting the NLRP3 inflammasome. Our results establish IL-1β as an inflammatory connection between metabolic dysfunction and arrhythmias in DM.


Figures

Figure 1
Figure 1. TLR2 regulates cardiac electrical parameters and incidence/severity of DM-induced arrhythmias.
(a) Experimental protocol: diabetes (DM) was induced in wild-type mice (WT) and toll-like receptor 2 knock-out mice (Tlr2−/−) by five daily i.p. injections of streptozotocin (STZ) (50 mg kg−1) and several parameters were analysed 60 days after the beginning of the protocol. Inset shows serum glucose levels of all experimental groups at day 60 (n=WT: 10; Tlr2−/−: 10; WT+DM: 10; Tlr2−/−+DM: 10). (b) Representative ECG traces of DM mice highlighting QT interval prolongation only in the WT group. (c) Corrected QT (QTc) interval duration (n=WT: 10; Tlr2−/−: 5; WT+DM: 10; Tlr2−/−+DM: 4). (d) Representative action potential (AP) traces from the endocardial layer of left ventricle strips at 300 ms basic cycle length (BCL) stimulation. (e) AP duration at 90 per cent of repolarization (APD90) in different BCL (n=WT: 7; Tlr2−/−: 6; WT+DM: 8; Tlr2−/−+DM: 6). (f) Representative ECG traces during arrhythmia vulnerability test induced by caffeine and dobutamine (Caff/Dobu) showing ventricular tachycardia (VT - see red line) in WT+DM mice and a normal ECG in Tlr2−/−+DM. (g) Score quantification of arrhythmia incidence and severity (n=WT: 6; Tlr2−/−: 6; WT+DM: 7; Tlr2−/−+DM: 7). (hj) Serum and local (heart) protein levels of IL-1β after 60 days of DM induction in experimental groups. Graph represents three (serum) and two (hearts, n=6 mice per group) independent experiments performed in duplicate. The results are expressed as mean±s.e.m. Scatter plot shows values from individual mice, where horizontal bars represent means and error bars, s.e.m. * and ** represent respectively P<0.05 and P<0.01 versus WT+DM, (unpaired t-test). # and ## represent, respectively, P<0.05 and P<0.01 versus WT+DM (Bonferroni's post test following two-way ANOVA).
Figure 2
Figure 2. IL-1β induces electrical abnormalities in rat and human cardiac cells.
(a) Experimental protocol. Cardiac muscle strips from rat hearts were incubated for 24 h with IL-1β (10 ng ml−1) with or without IL-1 receptor antagonist (IL-1ra: 100 ng ml−1) and electrical function was assessed. (b,c) Representative action potential (AP) traces from left ventricle endocardial at 300 ms basic cycle length (BCL) before and after incubation with IL-1β (left panel), and APD90 data from endocardial layer of left ventricular strips (right panel) (n of cells=Control: 10; IL-1β: 14; IL-1β+IL-1ra: 12; 4 hearts). (d) Experimental protocol: Hearts from rats were enzymatically dissociated and isolated cardiomyocytes were incubated for 24 h with IL-1β. (e,f) Representative traces (left panel) and current versus voltage (IV) curves (right panel) of Ito current after exposure to IL-1β (n of cells=Control: 17; IL-1β (60 pg ml−1): 5; from three hearts). (g) Quantification of calcium spark frequency and (h) spark fluorescence amplitude (F/F0) (n of cells=Control: 11; IL-1β 20; cells from three hearts). (i) Post-rest decrease in sarcoplasmatic reticulum (SR) calcium content expressed as variation as per cent of the steady-state content per min rest (n of cells=Control: 19; IL-1β 18; four hearts). (j) Representative images of calcium spark before and after incubation or not with IL-1β. (k) Representative traces of field potential in human iPS-derived cardiomyocytes highlighting effect of IL-1β on the field potential duration (FPD. (l,m) FPD and its variation in individual cell preparations before and after 24 h of incubation with control solution or IL-1β (10 ng ml−1) (n=Control: 6; IL-1β: 7; from three independent experiments). The results are expressed as mean±s.e.m. Scatter plot shows values from individual cell preparations, where horizontal bars represent means and error bars, s.e.m. # represents P<0.05 (Bonferroni's post test following one-way ANOVA). ** and *** represent, respectively, P<0.01 and P<0.001 (Bonferroni's post test following two-way ANOVA). † and †† represent, respectively, P<0.05 and P<0.01(unpaired t-test).
Figure 3
Figure 3. IL-1β induces pCaMKII/oxiCaMKII and spontaneous cardiac activity.
(a) Representative immunoblots of pCaMKII and GAPDH and quantitative densitometry values after 24 h incubation in the absence (control) or presence of IL-1β. (b) Representative immunoblots of oxiCaMKII and GAPDH and quantitative densitometry values. (c) Representative traces of cell shortening in isolated rat cardiomyocyte after 24 h incubation with IL-1β or IL-1β plus CaMKII inhibitor (KN93) as well as in transgenic mice with myocardial-delimited expression of the specific peptide inhibitor of CaMKII inactive control (AC3-C) or the active inhibitory (AC3-I), in which spontaneous contractions developed after pacing (0.5 Hz) interruption. (d) Number of spontaneous contractions for 5 min after pacing (NSE), which was increased after IL-1β incubation (n of cells=Control: 22; Control+KN93: 7; IL-1β: 26; IL-1β+KN93: 13; Control+KN92: 6; IL-1β +KN92: 7; AC3-C: 12; AC3-C+IL-1β: 12; AC3-I: 12; AC3-I+IL-1β: 12; from three hearts). (e) Representative traces of field potential in human iPS-derived cardiomyocytes highlighting inhibitory influence of CamKII with AIP of the IL-1β effect on the field potential duration (FPD). (f) FPD variation in individual cell preparations after 24 h incubation with control solution or IL-1β+AIP (10 ng ml−1 and 1 μmol l−1, respectively) (n=Control: 8; IL-1β: 7; IL-1β+AIP: 9; obtained from three independent experiments). The results are expressed as mean±s.e.m. Scatter plot shows values from individual cell preparations, where horizontal bars represent means and error bars, s.e.m. # and ### represents, respectively, P<0.05 and P<0.001 (unpaired t-test). *, ** and **** represent, respectively P<0.05, P<0.01 and P<0.0001 (Bonferroni's post test following one-way ANOVA).
Figure 4
Figure 4. TLR2 regulates APD through production of IL-1β by cardiac macrophages.
(a) Experimental protocol: macrophages from rat hearts were depleted with clodronate liposomes (clodronate-L). After depletion, cardiac muscle strips were incubated with TLR2 agonist Pam3 (1 μg ml−1). Liposomes containing PBS were used as control vehicle solution (Liposomes). (b) Enzyme-linked immunosorbent assay quantification of IL-1β cardiac content (graph represents three independent experiments in duplicate, n=6 hearts per group). (c) Experimental protocol: rat cardiac muscle strips were incubated for 24 h with Pam3 (1 μg ml−1) in the presence or absence of the IL-1 receptor antagonist IL-1ra (100 ng ml−1) and electrical function was assessed (n of cells=Control: 10; Pam3: 7; Pam3+IL-1ra: 7; IL-1β: 14; IL-1β+IL-1ra: 12; from four hearts). (d) Representative action potential (AP) traces from endocardial layer of left ventricle strips at 300 ms basic cycle length (BCL). (e) The graph summarizes the APD90 values from endocardial layer of left ventricle strips at 300 ms BCL under different condition. (f,g) Representative AP traces (left panel) and APD90 values (right panel) in rats cardiac strips from animals pre-treated with clodronate liposomes or control liposomes and then exposed 24 h to Pam3 (n=Control: 10; Pam3+liposomes: four hearts ; Pam3+clodronate-L: six hearts). The results are expressed as mean±s.e.m. Scatter plots show values from individual cell preparations, where horizontal bars represent means and error bars, s.e.m. # and ## represents, respectively P<0.05 and P<0.01 (Bonferroni's post test following one-way ANOVA).
Figure 5
Figure 5. TLR2 regulates macrophage subsets and NLRP3 expression in diabetic hearts.
(a) Experimental protocol. (b) Flow cytometry of cardiac macrophages shows decrease of MHCII Ly6C double-positive macrophages in the TLR2−/−+DM mouse heart. (c) Percentage of cardiac macrophages positive for MHCIIhigh and Ly6c (see Supplementary Fig. 8 for gating strategy) (n of hearts per group=WT: 7; Tlr2−/−: 8; WT+DM: 8; Tlr2−/−+DM: 6). (d) Quantification of NLRP3 immunostained area in cardiac tissue shows increase of NLRP3 in cardiac macrophages from WT+DM mice (n of hearts per group=WT: 6; Tlr2−/−: 6; WT+DM: 6; Tlr2−/−+DM: 6). (e) Representative immunostaining shows higher NLRP3 (red) content in cardiac (TnT—white) macrophages (F4/80—green) of WT+DM mice, but low expression in TLR2−/−+DM. The results are expressed as mean±s.e.m. Scatter plots show values from individual mice, where horizontal bars represent means and error bars, s.e.m. * and **** represents, respectively P<0.05 and P<0.0001 (unpaired t-test).
Figure 6
Figure 6. DM-induced cardiac electrical alterations are regulated by the NLRP3 inflammasome.
(a) Experimental protocol: diabetes induction in WT, NLRP3 knockout (Nlrp3−/−) and Casp1 knockout mice (Casp1−/−). (b) Fasting blood glucose levels at day 60 (n=WT+DM: 10; Nlrp3−/−+DM: 8; Casp1−/−+DM: 10). (c) Corrected QT (QTc) interval duration (n=WT+DM: 10; Nlrp3−/−+DM: 8; Casp1−/−+DM: 6). (d,e) Representative action potential (AP) traces (left panel) and APD90 data (right panel) from the endocardial layer of left ventricle strips at 300 ms basic cycle length (BCL) stimulation (n=WT+DM: 7; Nlrp3−/−+DM: 5; Casp1−/−+DM: 5). (f) Representative traces of arrhythmic vulnerability test induced by Caff/Dobu showing normal ECGs in Nlrp3−/−+DM and Casp1−/−+DM mice (n=WT+DM: 7; Nlrp3−/−+DM: 7; Casp1−/−+DM: 9). (g) Score quantification of arrhythmia incidence and severity in diabetic groups. (h) Experimental protocol for MCC-950 treatment (50 mg kg−1 i.p./daily/15 consecutive days). (i) Fasting blood glucose levels pre (day 60) and post (day 75) treatment from at least four mice per group. (j,k) QTc interval values and per cent variation pre (60 days) and post (75 days) treatment with saline or MCC-950. (l) Caff/Dobu test showing ventricular tachycardia (VT - see red line) in WT+DM treated with saline, but not when treated with MCC-950. (m) Arrhythmia score summary after MCC-950 treatment (n=Saline: 6; MCC-950: 4). The results are expressed as mean±s.e.m. Scatter plot shows values from individual mice, where horizontal bars represent means and error bars, s.e.m. * Represents P<0.05 versus WT+DM (unpaired t-test). # represent P<0.05 (Bonferroni's post test following two-way ANOVA.
Figure 7
Figure 7. IL-1β regulates cardiac electrical remodelling and cardiac arrhythmias.
(a) Experimental protocol of diabetes induction in WT and IL-1 receptor knock-out mice (IL-1r−/−). (b) Fasting blood glucose levels at day 60 (c) Corrected QT (QTc) interval duration (n=WT: 10; lL-1r−/−: 4; WT+DM: 10; IL-1r−/−+DM: 5). (d) Representative traces of arrhythmic vulnerability test induced by Caff/Dobu showing a normal ECG in IL-1r−/−+DM mice. (e) Score quantification of arrhythmia incidence and severity (n=WT: 7; lL-1r−/−: 4; WT+DM: 7; IL-1r−/−+DM: 5). (f) Experimental protocol for IL-1ra treatment (Anakinra, 10 mg kg−1 i.p./daily/15 consecutive days). (g) Fasting blood glucose levels pre (day 60) and post (day 75) treatment (at least four mice per group). (h) Representative ECG traces highlighting QT interval pre and post treatment with saline or IL-1ra. (i,j) QTc interval values and their per cent variation pre and post treatment (for control reference please check Fig. 6j). (k) Representative ECG traces of WT+DM mice treated with IL-1ra during Caff/Dobu test, showing normal electrical function. (l) Arrhythmia score summary after IL-1ra treatment (n=saline: 6; IL-1ra: 8). The results are expressed as mean±s.e.m. Scatter plot shows values from individual mice, where horizontal bars represent means and error bars, s.e.m. * and ** represents, respectively, P<0.05 and P<0.01 (unpaired t-test). ## represent P<0.01 (Bonferroni's post test following two-way ANOVA).

References

    1. Martinon F., Pétrilli V., Mayor A., Tardivel A. & Tschopp J. Gout-associated uric acid crystals activate the NALP3 inflammasome. Nature 440, 237–241 (2006). - PubMed
    1. Vilaysane A. et al. The NLRP3 inflammasome promotes renal inflammation and contributes to CKD. J. Am. Soc. Nephrol. 21, 1732–1744 (2010). - PMC - PubMed
    1. De Nardo D. & Latz E. NLRP3 inflammasomes link inflammation and metabolic disease. Trends Immunol. 32, 373–379 (2011). - PMC - PubMed
    1. Grishman E. K., White P. C. & Savani R. C. Toll-like receptors, the NLRP3 inflammasome, and interleukin-1β in the development and progression of type 1 diabetes. Pediatr. Res. 71, 626–632 (2012). - PubMed
    1. Kannel W. B. & McGee D. L. Diabetes and cardiovascular risk factors: the Framingham study. Circulation 59, 8–13 (1979). - PubMed

Publication types

MeSH terms