. 2016 Nov 24;539(7630):524-529.
doi: 10.1038/nature20166.

Bacteria establish an aqueous living space in plants crucial for virulence

Affiliations

Bacteria establish an aqueous living space in plants crucial for virulence

Xiu-Fang Xin et al. Nature. .

Abstract

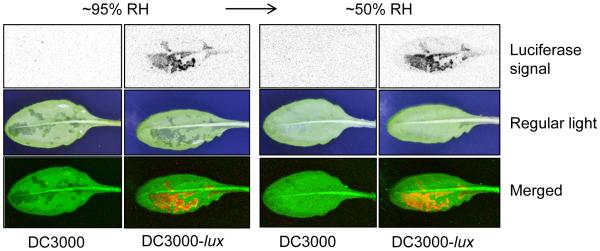
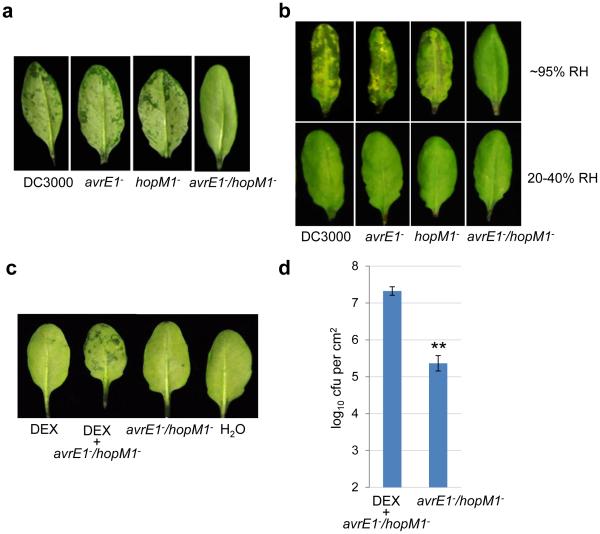
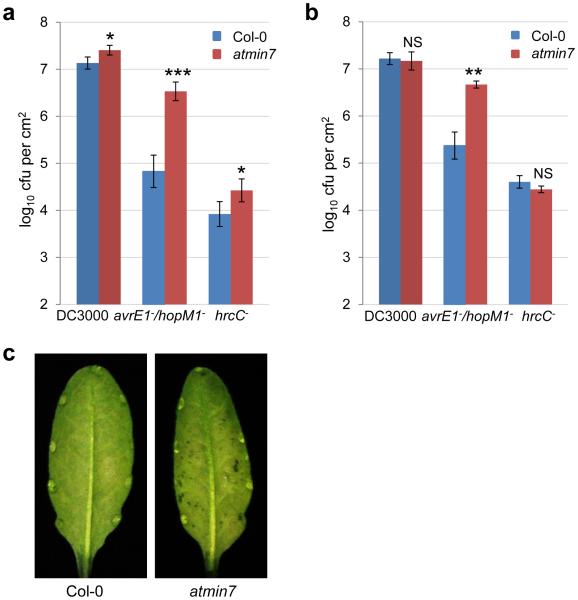
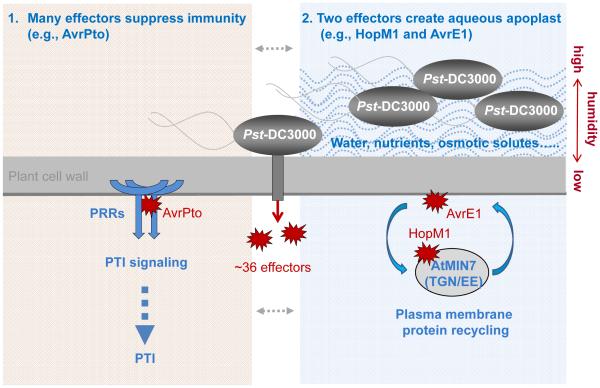
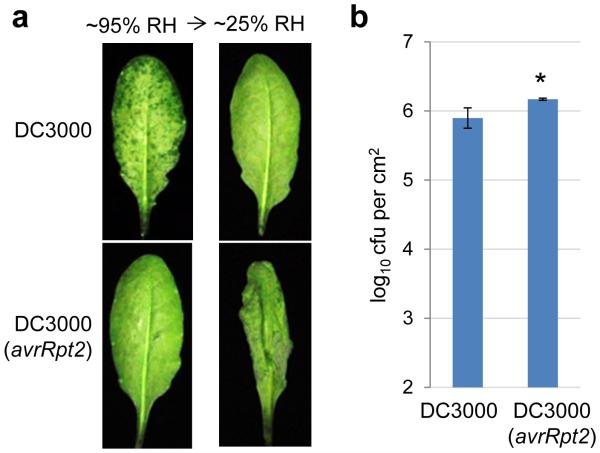
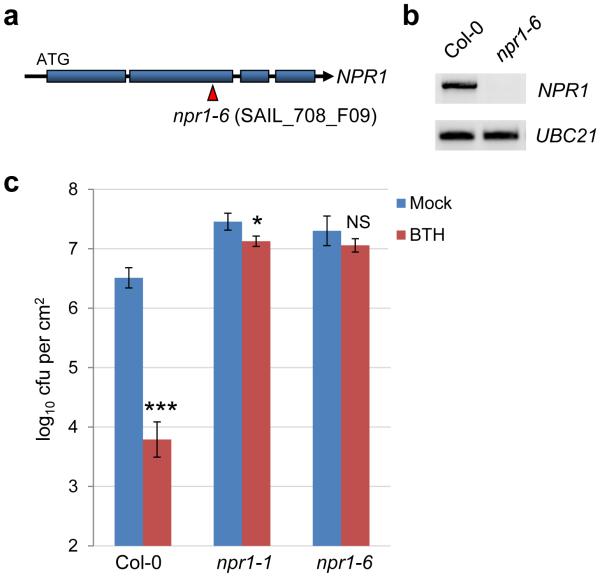
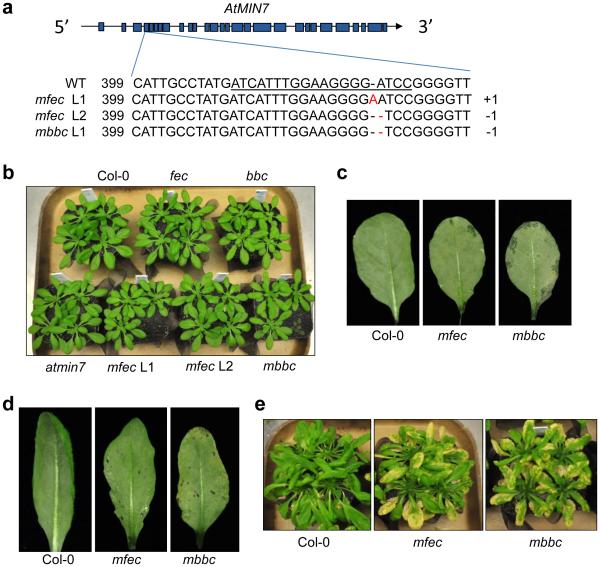
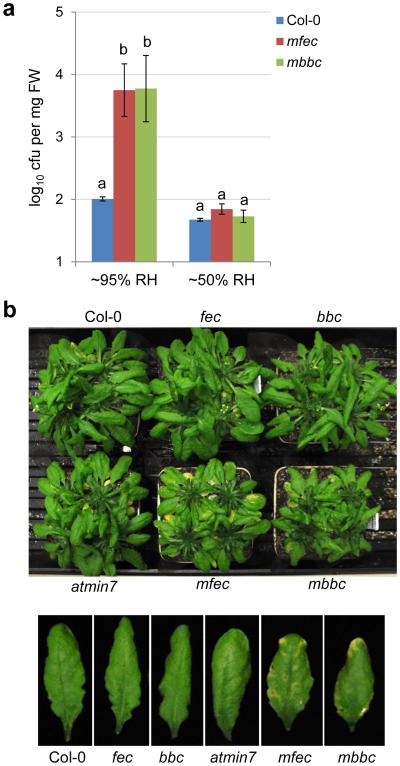
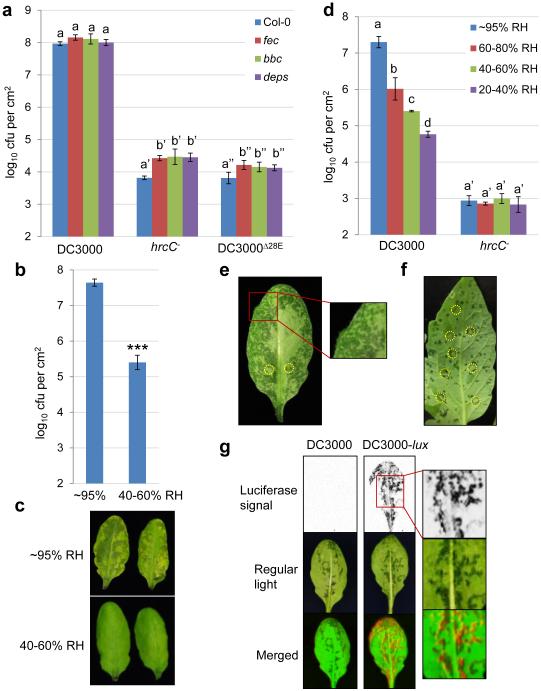
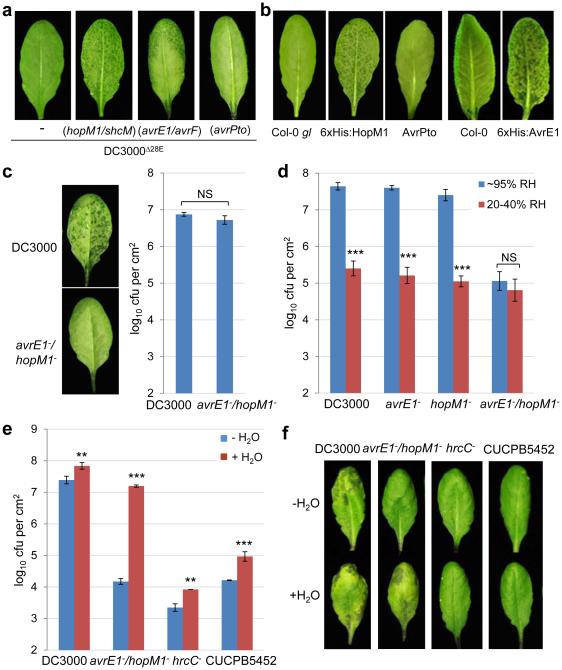
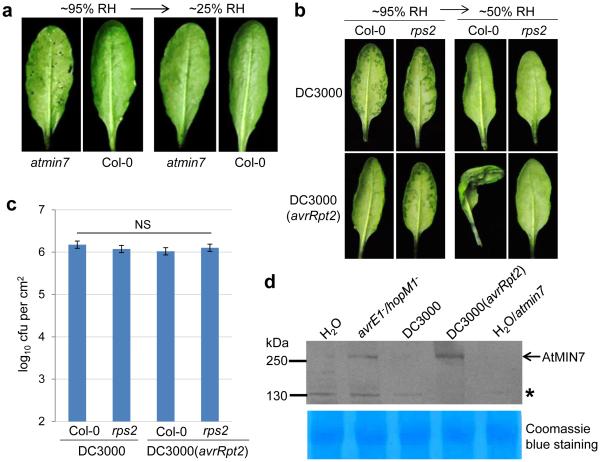
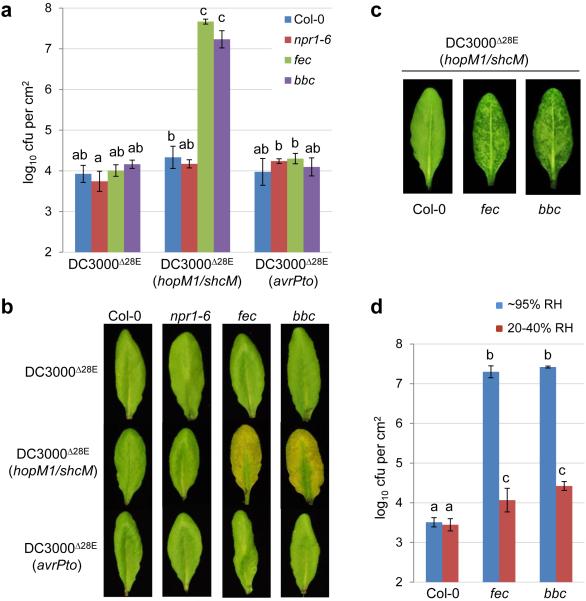
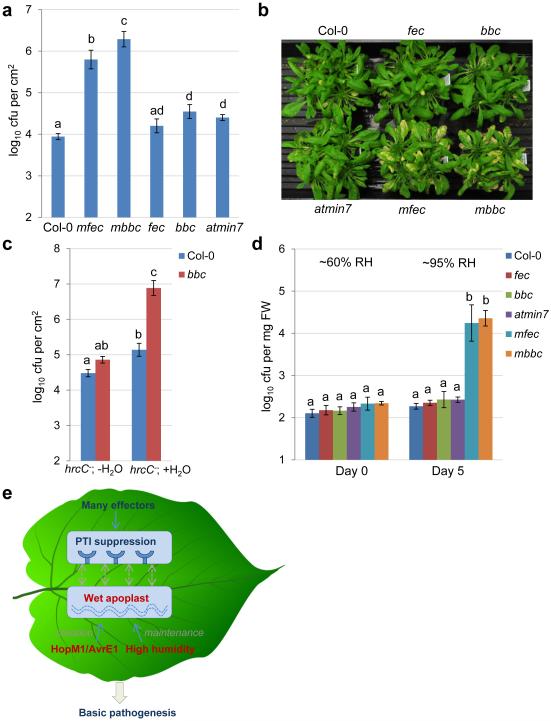
High humidity has a strong influence on the development of numerous diseases affecting the above-ground parts of plants (the phyllosphere) in crop fields and natural ecosystems, but the molecular basis of this humidity effect is not understood. Previous studies have emphasized immune suppression as a key step in bacterial pathogenesis. Here we show that humidity-dependent, pathogen-driven establishment of an aqueous intercellular space (apoplast) is another important step in bacterial infection of the phyllosphere. Bacterial effectors, such as Pseudomonas syringae HopM1, induce establishment of the aqueous apoplast and are sufficient to transform non-pathogenic P. syringae strains into virulent pathogens in immunodeficient Arabidopsis thaliana under high humidity. Arabidopsis quadruple mutants simultaneously defective in a host target (AtMIN7) of HopM1 and in pattern-triggered immunity could not only be used to reconstitute the basic features of bacterial infection, but also exhibited humidity-dependent dyshomeostasis of the endophytic commensal bacterial community in the phyllosphere. These results highlight a new conceptual framework for understanding diverse phyllosphere-bacterial interactions.


Figures

Extended Data Figure 1
Water soaking does not affect luminescence signal. Col-0 plants were dip-inoculated with bacteria at 2×10⁸ cfu/ml, and kept under high humidity (~95%) for 2 days. Imaging was performed in the same way as in Fig. 1g. Water-soaked leaves were air-dried for about 2 h and imaged again (right panel). Images were representative of leaves from more than four plants.
Extended Data Figure 2
a-b, The virulence of the avrE/hopM1 mutant is insensitive to humidity settings. a, Col-0 plants were syringe-infiltrated with indicated bacteria at 2×10⁵ cfu/ml. Inoculated plants were kept under high (~95%) humidity, and pictures were taken 24 h post infiltration. b, Col-0 plants were syringe-infiltrated with Pst DC3000, the avrE mutant, the hopM1 mutant or the avrE/hopM1 mutant at 2×10⁵ cfu/ml. Inoculated plants were kept under high (~95%) or low (20-40%) humidity. Pictures were taken 3 days post inoculation. Images were representative of leaves from more than four plants. c-d, The 6xHis:HopM1 transgenic plants were infiltrated with 0.1 nM DEX, the avrE/hopM1 mutant (at 1×10⁵ cfu/ml) or both. H2O was infiltrated as control. Infiltrated plants were kept at high humidity (~95%). Leaf pictures were taken 24 h post infiltration (c) and bacterial populations were determined 3 days post infiltration (d). * indicates a significant difference, as determined by Student’s t-test; (two-tailed); ***, p=1.03×10⁻⁵. n=6 technical replicates from there independent experiments (n=2 in each experiment); error bars, mean±s.d.
Extended Data Figure 3
Bacterial multiplication and water soaking in Col-0 and the min7 mutant. a, The Col-0 and min7 plants were dip-inoculated with Pst DC3000, the avrE/hopM1 mutant or the hrcC mutant at 1×10⁸ cfu/ml. Bacterial populations were determined 4 days post inoculation. * indicates a significant difference between Col-0 and min7 plants, as determined by Student’s t-test (two-tailed); *, p=1.61×10⁻² and 3.12×10⁻² for DC3000 and hrcC, respectively; ***, p=1.41×10⁻⁴ for avrE/hopM1. n=4 technical replicates; error bars, mean±s.d. Experiments were repeated three times. b-c, The Col-0 and min7 plants were syringe-infiltrated with Pst DC3000, the avrE /hopM1 mutant or the hrcC mutant at 1×10⁶ cfu/ml. Bacterial populations were determined 3 days post inoculation (b) and leaf pictures were taken 38 h after infiltration to show water soaking in min7 leaves (c). * indicates a significant difference between Col-0 and min7 plants, as determined by Student’s t-test (two-tailed); **, p=1.63×10⁻³ for avrE/hopM1; ns, not significant (p=0.72 and 0.14 for DC3000 and hrcC, respectively). n=3 technical replicates; error bars, mean±s.d. Experiments were repeated three times. Images were representative of leaves from more than four plants.
Extended Data Figure 4
Pst DC3000 delivers a total of 36 effectors into the plant cell. Many effectors, including AvrPto, appear to suppress pattern-triggered immunity (PTI). AvrPto inhibits pattern recognition receptor (PRR) function. Two conserved effectors, HopM1 and AvrE, create an aqueous apoplast in a humidity-dependent manner. AvrE is localized to the host plasma membrane (PM); its host target is currently unknown. HopM1 targets MIN7 (an ARF-GEF protein) in the trans-Golgi-network/early endosome (TGN/EE), which is involved in recycling of PM proteins.
Extended Data Figure 5
a, Col-0 leaves were syringe-infiltrated with Pst DC3000 (1×10⁶ cfu/ml) or Pst DC3000 (avrRpt2) (1×10⁷ cfu/ml). Plants were kept under high humidity (~95%) for 24 h to observe water soaking and then shifted to low humidity (~25%) for 2 h to observe ETI-associated tissue collapse. Pictures were taken before and after low humidity exposure (a) and bacterial populations were determined 24 h post infiltration to show similar population levels (b). * indicates a significant difference of bacterial population, as determined by Student’s t-test (two-tailed); *, p=0.033. n=3 technical replicates; error bars, mean±s.d. Experiments were repeated three times. This is an experimental replicate of Fig. 3b and 3c (without rps2).
Extended Data Figure 6
Characterization of the npr1-6 mutant. a, A diagram showing the T-DNA insertion site in the npr1-6 mutant. Blue boxes indicate exons in the NPR1 gene. b, RT-PCR results showing that the npr1-6 line cannot produce the full-length NPR1 transcript. Primers used (NPR1 sequence is underlined): NPR1-F: agaattcATGGACACCACCATTGATGGA; NPR1-R: agtcgacCCGACGACGATGAGAGARTTTAC; UBC21-F: TCAAATGGACCGCTCTTATC; UBC21-R: TCAAATGGACCGCTCTTATC. Uncropped gel images are included in Supplementary Figure 1. c, The npr1-6 line, similar to npr1-1, is greatly compromised in benzothiadiazole (BTH)-mediated resistance to Pst DC3000 infection. The Col-0, npr1-1 and npr1-6 plants were sprayed with 100μM BTH and, 24 h later, dip-inoculated with Pst DC3000 at 1×10⁸ cfu/ml. Bacterial populations were determined 3 days post inoculation. * indicates a significant difference between mock and BTH treatment, as determined by Student’s t-test (two-tailed); *, p=0.027; ***, p=1.6×10⁻⁴; ns, not significant (p=0.19). n=3 technical replicates; error bars, mean±s.d. Experiments were repeated three times.
Extended Data Figure 7
Construction and characterization of the mfec and mbbc quadruple mutants. a, CRISPR-Cas9-mediated mutations in the 4th exon of the MIN7 gene (exons indicated by blue boxes) in the quadruple mutant lines used in this study. The underlined sequence in the wild type (WT) indicates the region targeted by sgRNA. The number “399” indicates the nucleotide position in the MIN7 coding sequence. “+1” and −1” indicate frame shifts in the mutant lines. b, Col-0 and various mutants used in this study have similar growth, development and morphology. Four-week-old plants are shown. c, The mfec and mbbc plants show a tendency of developing sporadic water soaking under high humidity. Five-week-old regularly-grown (~60% relative humidity) Col-0, mfec and mbbc plants were shifted to high humidity (~95%) for overnight and pictures of mature leaves were taken after high humidity incubation. d, Even leaves of mfec and mbbc plants that do not have sporadic water-soaking have a tendency to develop some water soaking after hrcC inoculation. Five-week old Col-0, mfec and mbbc plants were dip-inoculated with hrcC at 1×10⁸ cfu/ml, and kept under high humidity (~95%). Leaf pictures were taken 2 days post inoculation. Images were representative of leaves from at least four plants. e, The non-pathogenic hrcC mutant causes significant necrosis and chlorosis in the quadruple mutant plants. Col-0, mfec and mbbc plants were dip-inoculated with the hrcC strain at 1×10⁸ cfu/ml. Pictures were taken 9 days post inoculation. This is one of the four independent experimental repeats of the results presented in Fig. 5b.
Extended Data Fig. 8
a, Increased endophytic bacterial community in the mfec and mbbc plants depend on high humidity. Col-0, mfec and mbbc plants were either sprayed with H2O and kept under high humidity (~95%) or kept under low humidity (~50%). On day 5, total populations of the endophytic bacterial community were quantified. Statistical analysis was performed by one-way ANOVA with Tukey’s test (p value set at 0.05). Bacterial populations indicated by different letters (i.e., a and b) are significantly different. n=4 technical replicates; error bars, mean±s.d. Experiments were repeated three times. b, Mild chlorosis and necrosis in leaves is associated with increased endophytic bacterial community level in the mfec and mbbc quadruple mutant plants. Plants were sprayed with H2O and kept under high (~95%) humidity. Pictures were taken 10 days after spray. Individual leaves are enlarged and shown in the lower panel, showing mild chlorosis and necrosis in some of the mfec and mbbc leaves.
Extended Data Fig. 9
Validation of 1 min as an effective surface sterilization time. Five-week old Col-0 plants were sprayed with H2O and kept under high humidity (~95%) for 5 days. Leaves were detached, surface sterilized in 75% ethanol for 20s, 40s, 1min or 2min and then rinsed in sterile water twice. No sterilization (0s) was used as control. Leaves were ground in sterile water and bacterial numbers were determined by serial dilutions and counting of colony-forming units on R2A plates. Statistical analysis was performed by one-way ANOVA with Tukey’s test (p value set at 0.05). Bacterial populations indicated by different letters (i.e., a and b) are significantly different. n=4 technical replicates; error bars, mean±s.d. Experiments were repeated twice with similar results.
Figure 1
Figure 1
Full-scale Pst DC3000 infection requires high humidity and is tightly associated with apoplast “water soaking”. See Methods for syringe-infiltration or dip-inoculation of plants described in all figures. a, Bacterial populations in Col-0, fls2/efr/cerk1 (fec), bak1-5/bkk1-1/cerk1 (bbc) and dde2/ein2/pad4/sid2 (deps) leaves 2 days post infiltration with bacteria at 1×10⁶ cfu/ml. Humidity: ~95%. Two-way ANOVA with Tukey’s test (p value set at 0.05) was performed. No significant differences were found for DC3000 populations in different plant genotypes (indicated by the same letter a), whereas differences were found for hrcC or DC3000D28E populations in different plant genotypes, as indicated by different letters of the same type (a’ vs. b’ for hrcC and a” vs. b” for DC3000D28E). n=4 technical replicates; error bars, mean±s.d. Experiments were repeated three times with similar results. b-c, Bacterial populations (b) and disease symptoms (c) 3 days post infiltration with Pst DC3000 at 1×10⁵ cfu/ml. * indicates a significant difference determined by Student’s t-test (two-tailed); ***, p=1.08×10⁻⁶. n=4 technical replicates; error bars, mean±s.d. Experiments were repeated four times with similar results. d, Bacterial populations in Col-0 leaves 3 days post infiltration with bacteria at 1×10⁵ cfu/ml. Statistical analysis was the same as in a. Significant differences were found for DC3000 populations under different humidities, as indicated by different letters (a, b, c and d). No significant differences were found in hrcC populations (indicated by the same letter a’). n=3 technical replicates; error bars, mean±s.d. Experiments were repeated three times with similar results. e, Pictures of the abaxial sides of Col-0 leaves 24 h post infiltration with Pst DC3000 at 1×10⁶ cfu/ml. Humidity: ~95%. Dark spots on the leaf indicate water soaking spots. Red boxes indicate “zoomed-in” regions. f, Picture of a tomato leaf (cv. Castle Mart) 3 days after infiltration with Pst DC3000 at 1×10⁴ cfu/ml. Humidity: ~95%. Yellow circles in e and f indicate infiltration sites. Images were representative of water-soaked leaves from more than four plants. g, Col-0 plants were dip-inoculated with bacteria at 2×10⁸ cfu/ml. Humidity: ~95%. Bacterial colonies in inoculated leaves were visualized 2 days later by a charge-coupled device (upper panel) and pictures of leaves were taken to show water soaking spots (middle panel). Bottom panel shows merged images, with the artificial red color labeling Pst DC3000-lux bacteria. Experiments were repeated three times. Images were representative of leaves from more than four plants.
Figure 2
Figure 2
Type III effectors AvrE and HopM1 are necessary and sufficient to cause water soaking. a, Pictures of Col-0 leaves 24 h post infiltration with bacteria (1-2×10⁸ cfu/ml). Humidity: ~95%. b, Pictures of leaves of transgenic 6xHis:HopM1, 6xHis:AvrE or AvrPto plants after spray with 10μM dexamethasone (DEX; to induce effector gene expression). Humidity: ~95%. Col-0 or Col-0 gl plants were non-transgenic parental controls. Images were representative of leaves from more than four plants. c, Pictures of Col-0 leaves (left) and bacterial populations (right) 24 h post infiltration with Pst DC3000 (1×10⁶ cfu/ml) or the avrE/hopM1 strain (1×10⁷ cfu/ml). Humidity: ~95%. Student’s t-test (two-tailed) was performed; ns, not significant (p=0.104). n=3 biological replicates; error bars, mean±s.d. Experiments were repeated three times. d, Bacterial populations in Col-0 plants 3 days post infiltration with bacteria at 2×10⁵ cfu/ml. *** indicates a significant difference (p=1.07×10⁻⁶, 8.07×10⁻⁷ and 5.95×10⁻⁷ for DC3000, the avrE mutant and the hopM1 mutant, respectively) of bacterial population between different humidities, as determined by Student’s t-test (two-tailed); ns, not significant (p=0.13). n=4 technical replicates; error bars, mean±s.d. Experiments were repeated three times. e-f, Bacterial populations (e) and leaf pictures (f) in Col-0 leaves 3 days post infiltration with bacteria at 1×10⁵ cfu/ml. In the “− H2O” treatment, plants were air-dried normally (for ~2 h) and then kept under high humidity (~95%). In the “+H2O” treatment, plants were kept under high (80-95%) humidity after syringe-infiltration to allow slow evaporation of water (for ~16 h, until no visible apoplast water can be seen). ** (p=8.29×10⁻³ and 1.14×10⁻³ for DC3000 and hrcC, respectively) and *** (p=7.61×10⁻⁷ and 9.82×10⁻⁴ for avrE/hopM1 and CUCPB5452, respectively) indicate significant differences between “− H2O” and “+H2O” treatments as determined by Student’s t-test (two-tailed). n=3 technical replicates; error bars, mean±s.d. Experiments were repeated three times.
Figure 3
Figure 3
Effects of MIN7 and effector-triggered immunity on water soaking. a, The min7 leaves, but not Col-0 leaves, showed partial water soaking 48 h after dip-inoculation with the avrE/hopM1 mutant at 1×10⁸ cfu/ml. Humidity: ~95%. Water soaking disappeared after transition to low humidity (~25%) to allow evaporation of apoplast water. Images were representative of leaves from more than four plants. b-c, ETI blocks apoplast water soaking. Col-0 and rps2 leaves were infiltrated with Pst DC3000 (1×10⁶ cfu/ml) or Pst DC3000 (avrRpt2) (1×10⁷ cfu/ml for Col-0 and 1×10⁶ cfu/ml for rps2 plants). Plants were kept under high humidity (~95%) for 24 h to observe water soaking and then shifted to low humidity (~50%) for 4 h to observe ETI-associated tissue collapse. Pictures were taken before and after low humidity exposure (b) and bacterial populations were determined 24 h post infiltration to show similar population levels (c). Statistical analysis of data in c was performed by one-way ANOVA with Tukey’s test (p value set at 0.05), and no significant difference was detected. n=3 technical replicates; error bars, mean±s.d. Experiments were repeated three times. d, MIN7 protein is stabilized during ETI revealed by immunoblot. Col-0 or min7 leaves were infiltrated with bacteria (1×10⁷ cfu/ml25) or H2O and kept under high humidity (~95%) for 24 h before protein extraction. Asterisk indicates a non-specific band. Coomassie blue staining shows equal loading. See Supplementary Figure 1 for cropping.
Figure 4
Figure 4
hopM1/shcM transform the non-pathogenic DC3000D28E mutant into a highly virulent pathogen in PTI-deficient mutant plants in a humidity-dependent manner. a-c, Bacterial populations (a) and disease symptoms (b) 3 days post infiltration with bacteria indicated at 1×10⁶ cfu/ml. Humidity: ~95%. Statistical analysis was performed by one-way ANOVA with Tukey’s test (p value set at 0.05). Bacterial populations indicated by different letters (i.e., a, b and c) are significantly different (ab is not significantly different from a or b). n=4 technical replicates; error bars, mean±s.d. Experiments were repeated three times. Water-soaking symptom was recorded 24 h post inoculation (c). d, Bacterial populations 3 days post infiltration with DC3000D28E (hopM1/shcM) at 1×10⁶ cfu/ml under indicated humidities. Statistical analysis was the same as in (a). Bacterial populations indicated by different letters (i.e., a, b and c) are significantly different. n=4 technical replicates; error bars, mean±s.d. Experiments were repeated three times. Images were representative of leaves from at least four plants.
Figure 5
Figure 5
Disease reconstitution experiments. a-b, The hrcC bacterial populations 5 days (a) and disease symptoms 10 days post dip-inoculation (b) in Col-0, fec, bbc, min7, min7/fls2/efr/cerk1 (mfec) and min7/bak1-5/bkk1-1/cerk1 (mbbc) plants. Humidity: ~95%. Statistical analysis was performed by one-way ANOVA with Tukey’s test (p value set at 0.05). Bacterial populations indicated by different letters (i.e., a, b, c and d) are significantly different (ad is not significantly different from a or d). n=4 technical replicates; error bars, mean±s.d. Experiments were repeated four times. c, The hrcC bacterial populations in Col-0 and bbc leaves 3 days post infiltration with bacteria at 1×10⁶ cfu/ml. The “− H2O” and “+ H2O” conditions are the same as in Fig. 2e. Statistical analysis was performed by one-way ANOVA with Tukey’s test (p value set at 0.05). Bacterial populations indicated by different letters (i.e., a, b and c) are significantly different (ab is not significantly different from a or b). n=3 technical replicates; error bars, mean±s.d. Experiments were repeated three times. d, The Col-0, fec, bbc, min7, mfec and mbbc plants were mock-sprayed with H2O and kept under high humidity (~95%). On day 0 (before water spray) and day 5, total populations of the endophytic bacterial community were quantified by counting colony-forming units on R2A plates, after surface sterilization of leaves with 75% ethanol, leaf homogenization and serial dilutions. Statistical analysis is the same as in (a). Bacterial populations indicated by different letters (i.e., a and b) are significantly different. n=4 technical replicates; error bars, mean±s.d. Experiments were repeated three times. e, A new model for Pst DC3000 pathogenesis in Arabidopsis. Dashed arrows indicate a possible interplay, at spatial and temporal scales, between “immune suppression” and “wet apoplast” during pathogenesis.

Comment in

References

    1. Miller S, Rowe R, Riedel R. Bacterial spot, speck, and canker of Tomatoes. Ohio State University Extension; 1996. Fact Sheet HYG-3120-96.
    1. Pernezny K, Zhang S. Bacterial speck of tomato. University of Florida IFAS; 2005. Extension PP-10.
    1. Schwartz HF. Bacterial diseases of beans. Colorado State University Extension; 2011. Fact Sheet No: 2.913.
    1. Stevens RB. Plant Pathology, an Advanced Treatise. Vol. 3. Academic Press; New York: 1960.
    1. Buttner D, He SY. Type III protein secretion in plant pathogenic bacteria. Plant Physiol. 2009;150:1656–1664. - PMC - PubMed

MeSH terms