

Thermally induced magnetic relaxation in square artificial spin ice
- PMID: 27883013
- PMCID: PMC5121627
- DOI: 10.1038/srep37097
Thermally induced magnetic relaxation in square artificial spin ice
Abstract
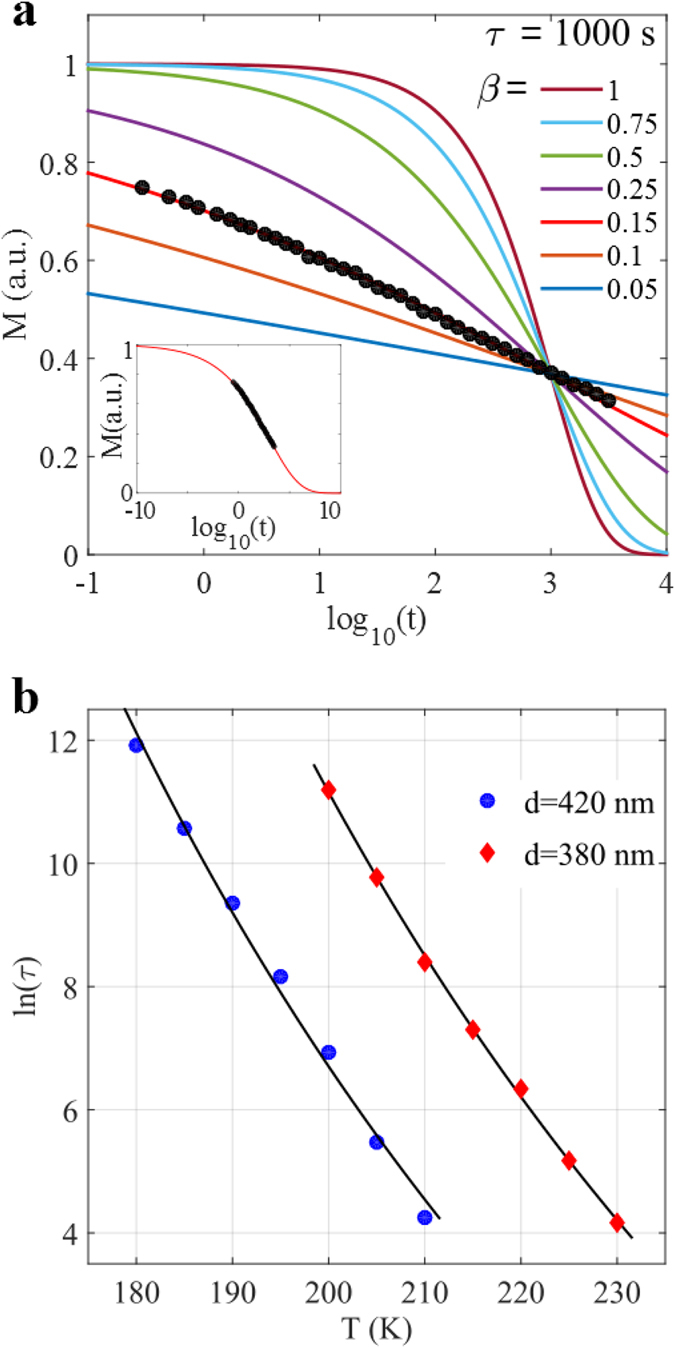
The properties of natural and artificial assemblies of interacting elements, ranging from Quarks to Galaxies, are at the heart of Physics. The collective response and dynamics of such assemblies are dictated by the intrinsic dynamical properties of the building blocks, the nature of their interactions and topological constraints. Here we report on the relaxation dynamics of the magnetization of artificial assemblies of mesoscopic spins. In our model nano-magnetic system - square artificial spin ice - we are able to control the geometrical arrangement and interaction strength between the magnetically interacting building blocks by means of nano-lithography. Using time resolved magnetometry we show that the relaxation process can be described using the Kohlrausch law and that the extracted temperature dependent relaxation times of the assemblies follow the Vogel-Fulcher law. The results provide insight into the relaxation dynamics of mesoscopic nano-magnetic model systems, with adjustable energy and time scales, and demonstrates that these can serve as an ideal playground for the studies of collective dynamics and relaxations.
Figures
Similar articles
-
Magnetization dynamics of weakly interacting sub-100 nm square artificial spin ices.Sci Rep. 2019 Dec 27;9(1):19967. doi: 10.1038/s41598-019-56219-y. Sci Rep. 2019. PMID: 31882867 Free PMC article.
-
Magneto-thermally activated spin-state transition in La0.95Ca0.05CoO3: magnetically-tunable dipolar glass and giant magneto-electricity.Phys Chem Chem Phys. 2016 Mar 7;18(9):6569-79. doi: 10.1039/c5cp06932g. Phys Chem Chem Phys. 2016. PMID: 26866898
-
Thermal fluctuations in artificial spin ice.Nat Nanotechnol. 2014 Jul;9(7):514-9. doi: 10.1038/nnano.2014.104. Epub 2014 Jun 8. Nat Nanotechnol. 2014. PMID: 24908258
-
The Mössbauer and magnetic properties of ferritin cores.Biochim Biophys Acta. 2010 Aug;1800(8):886-97. doi: 10.1016/j.bbagen.2010.03.018. Epub 2010 Apr 2. Biochim Biophys Acta. 2010. PMID: 20363296 Review.
-
Self-diffusion studies by intra- and inter-molecular spin-lattice relaxometry using field-cycling: Liquids, plastic crystals, porous media, and polymer segments.Prog Nucl Magn Reson Spectrosc. 2017 Aug;101:18-50. doi: 10.1016/j.pnmrs.2017.04.001. Epub 2017 Apr 9. Prog Nucl Magn Reson Spectrosc. 2017. PMID: 28844220 Review.
Cited by
-
Magnetization dynamics of weakly interacting sub-100 nm square artificial spin ices.Sci Rep. 2019 Dec 27;9(1):19967. doi: 10.1038/s41598-019-56219-y. Sci Rep. 2019. PMID: 31882867 Free PMC article.
-
Real-space observation of ergodicity transitions in artificial spin ice.Nat Commun. 2023 Sep 14;14(1):5674. doi: 10.1038/s41467-023-41235-4. Nat Commun. 2023. PMID: 37704596 Free PMC article.
References
-
- Kohlrausch R. Theorie des elektrischen rückstandes in der leidener flasche. Ann. Phys. (Leipzig) 12, 393 (1847).
-
- Williams G. & Watts D. C. Non-symmetrical dielectric relaxation behaviour arising from a simple empirical decay function. Transactions of the Faraday Society 66, 80–85 (1970).
-
- Jonscher A. K. The universal dielectric response. Nature 267, 673–679 (1977).
-
- Palmer R. G., Stein D. L., Abrahams E. & Anderson P. W. Models of Hierarchically Constrained Dynamics for Glassy Relaxation. Physical Review Letters 53, 958–961 (1984).
-
- Böhmer R., Ngai K. L., Angell C. A. & Plazek D. J. Nonexponential relaxations in strong and fragile glass formers. The Journal of Chemical Physics 99, 4201–4209 (1993).
Publication types
LinkOut - more resources
Full Text Sources
Other Literature Sources
