. 2016 Nov 24:6:37697.
doi: 10.1038/srep37697.

The mevalonate pathway regulates primitive streak formation via protein farnesylation

Affiliations

The mevalonate pathway regulates primitive streak formation via protein farnesylation

Yoshimi Okamoto-Uchida et al. Sci Rep. .

Abstract

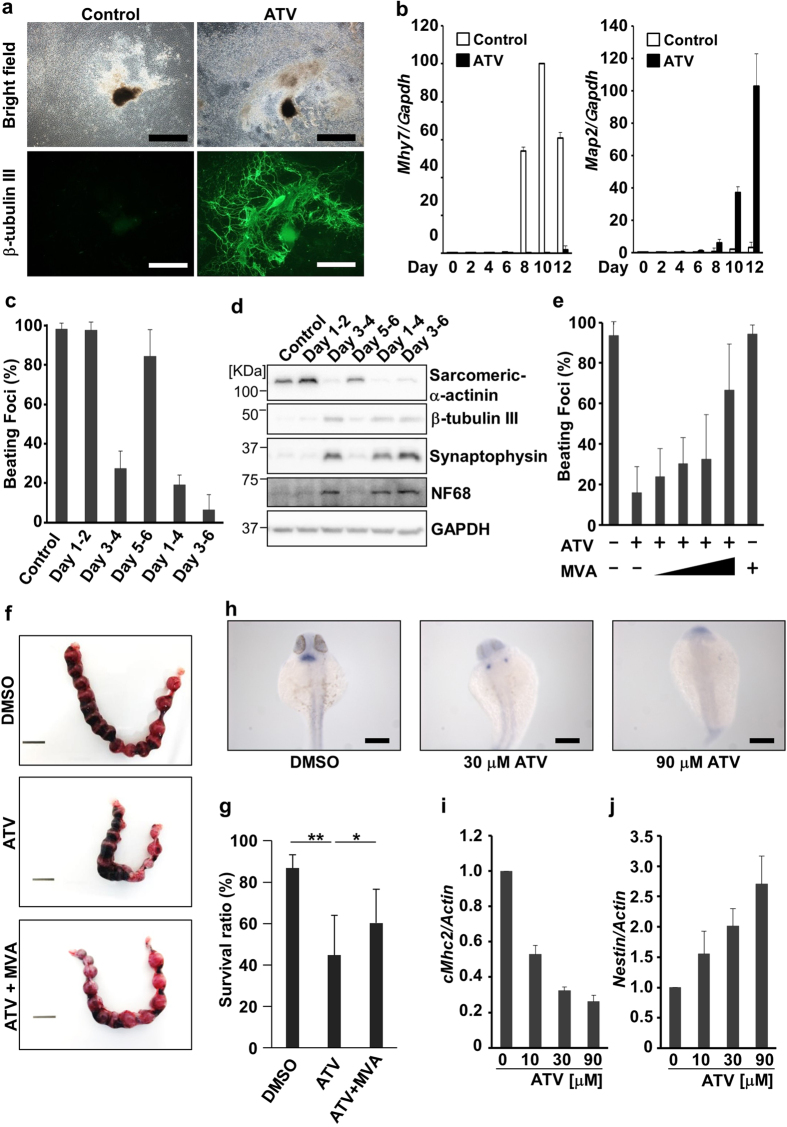
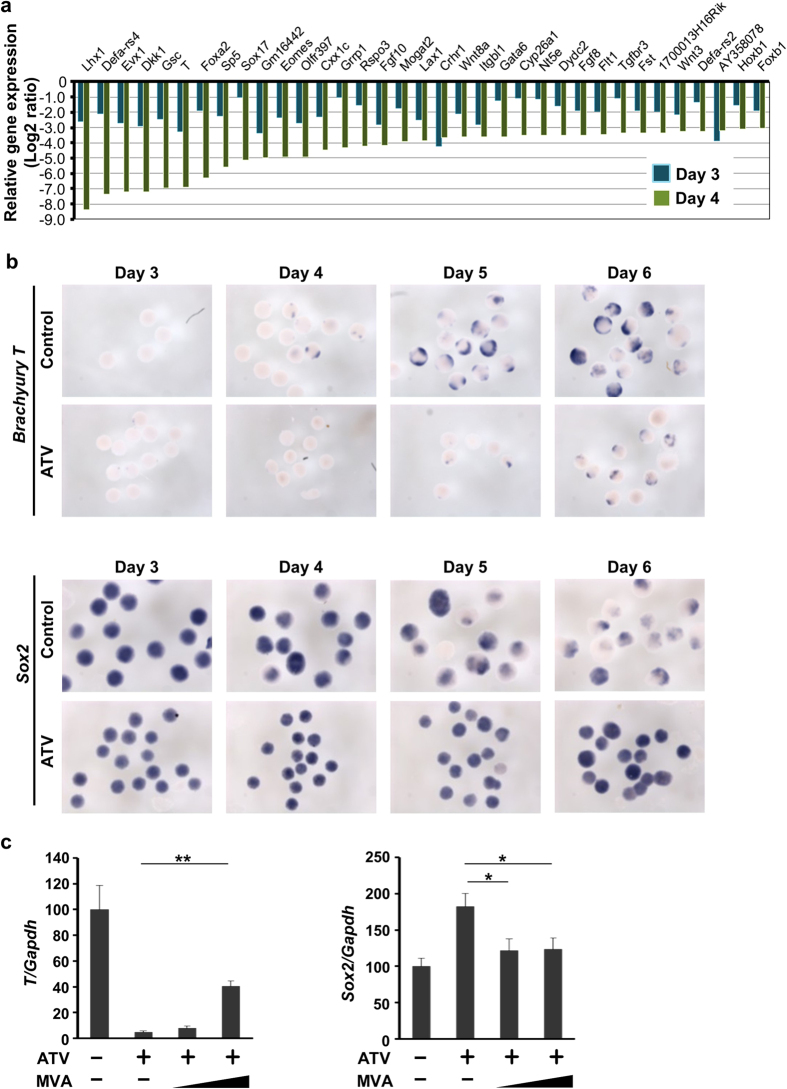
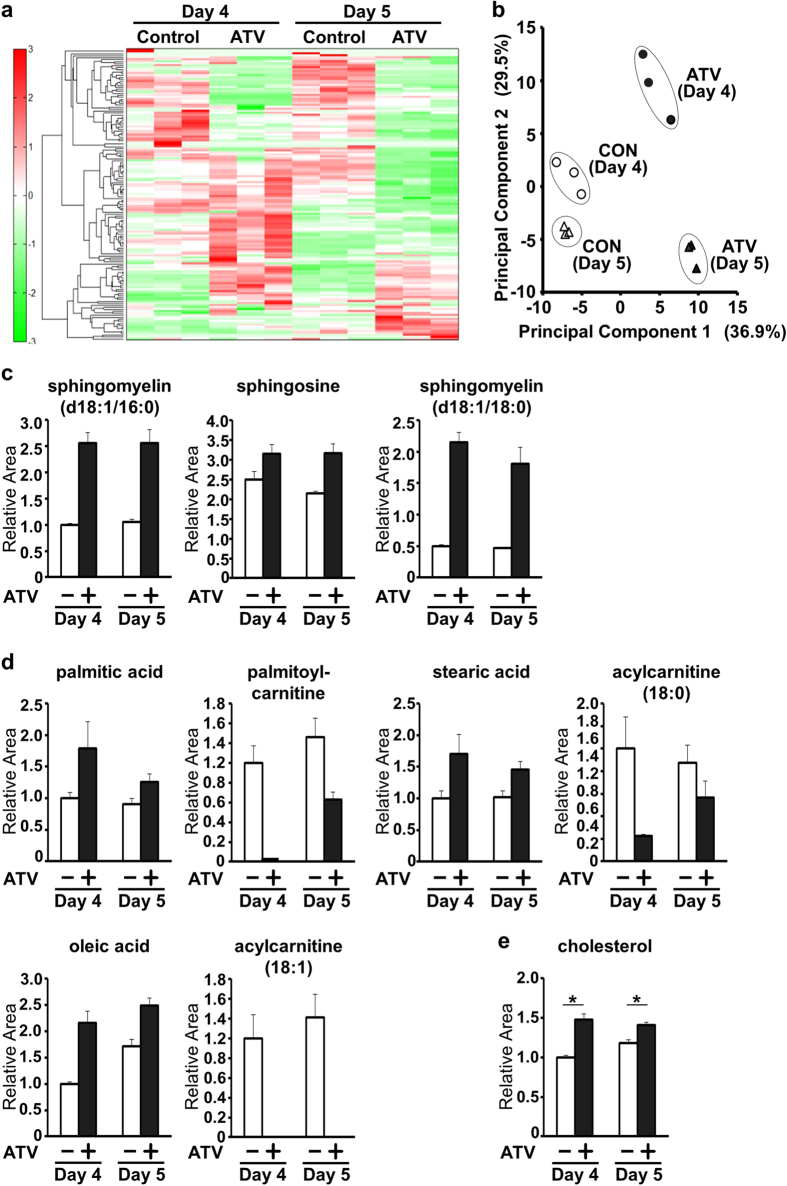
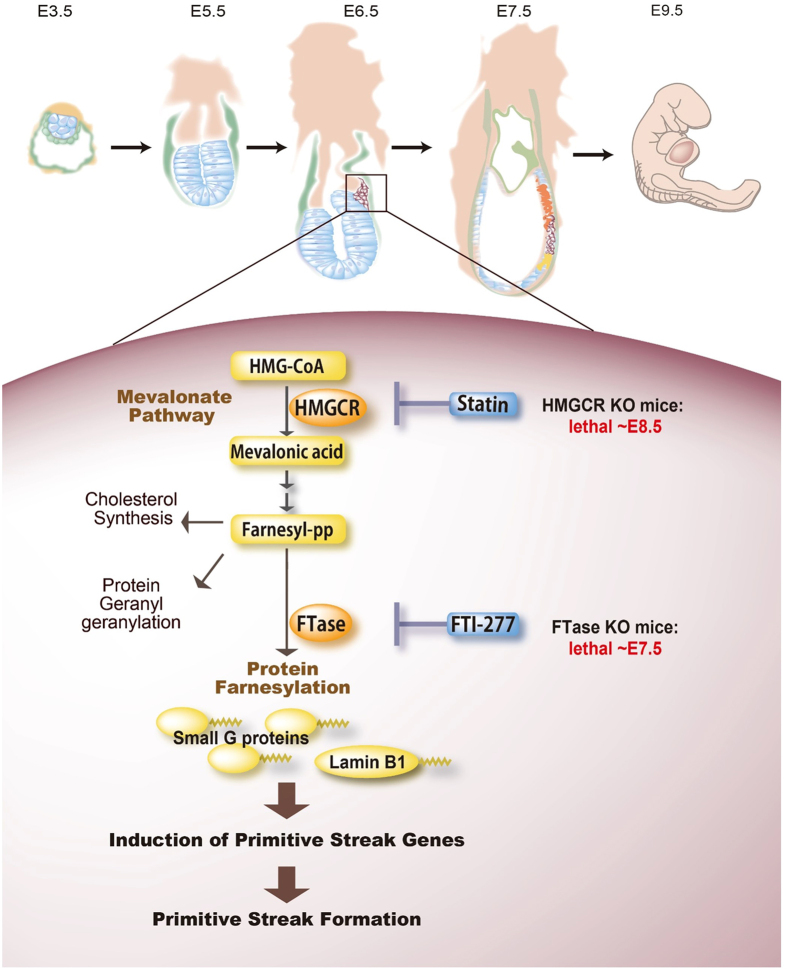
The primitive streak in peri-implantation embryos forms the mesoderm and endoderm and controls cell differentiation. The metabolic cues regulating primitive streak formation remain largely unknown. Here we utilised a mouse embryonic stem (ES) cell differentiation system and a library of well-characterised drugs to identify these metabolic factors. We found that statins, which inhibit the mevalonate metabolic pathway, suppressed primitive streak formation in vitro and in vivo. Using metabolomics and pharmacologic approaches we identified the downstream signalling pathway of mevalonate and revealed that primitive streak formation requires protein farnesylation but not cholesterol synthesis. A tagging-via-substrate approach revealed that nuclear lamin B1 and small G proteins were farnesylated in embryoid bodies and important for primitive streak gene expression. In conclusion, protein farnesylation driven by the mevalonate pathway is a metabolic cue essential for primitive streak formation.


Figures

Figure 1
Figure 1. The effects of statins on cardiomyogenesis and neurogenesis.
(a) Representative images of EBs that were untreated (control) or treated with 10 μM ATV (n > 100/group) during days 1–6. EBs were stained with anti-β-tubulin III Ab to label neurites on day 12 and visualised by microscopy. Scale bars, 1 mm. (b) Real-time PCR of the cardiomyocyte marker Mhy7 and neural marker Map2 in EBs in (a). mRNA levels were normalised to Gapdh expression. Results are means ± SD (n = 3). (c) Percentage of foci with a ‘heartbeat’ (indicating cardiomyocyte differentiation) in EB cultures that were treated with 10 μM ATV for the indicated periods and evaluated on day 10. Results are means ± SD (n = 3). (d) Western blotting of EBs in (c) to detect protein expression on day 10. GAPDH, loading control. Results are representative of three trials examining at least three cultures/group. (e) Cardiomyocyte differentiation in EBs treated with 25, 100, 250 μM or 1 mM MVA in addition to 10 μM ATV during days 3–6. Results were analysed as in (c). (f) Representative images of the uteri of mice treated with DMSO, ATV or ATV plus MVA at E5.5 and examined at E10.5. Scale bars, 10 mm. (g) Survival ratios for embryos of mice in (f). (h) Whole-mount in situ hybridisation to detect the cardiac marker cMhc2 in 24 h post-fertilisation (hpf) zebrafish embryos that were treated with DMSO or treated with 30 or 90 μM ATV from one-cell stage. Scale bars, 200 μm. (i,j) Real-time PCR of cMhc2 and nestin in the zebrafish embryos in (h) at 24 hpf. mRNA levels were normalised to actin expression. Results are means ± SD (n = 3). All experiments were carried out in triplicate. *P = 0.052, **P < 0.05.
Figure 2
Figure 2. The effects of statins on primitive streak formation in mouse EBs.
(a) Microarray results for the top 35 downregulated genes in EBs treated with ATV during days 1–4. Data were compared with control EBs and analysed on days 3 and 4. Gene expression levels in ATV-treated EBs are expressed as Log2 (fold change) values relative to control EBs. (b) In situ hybridisation to detect T and Sox2 in EBs treated with or without ATV on days 1–6 and collected at the indicated times. Results are representative of >100 EBs/group. (c) Real-time PCR of T and Sox2 in EBs treated with or without ATV and/or MVA during days 1–4 and collected on day 4. Results were analysed as in Fig. 1b. *P < 0.05, **P < 0.0001.
Figure 3
Figure 3. Metabolomic analysis of statin-treated mouse EBs.
(a) Heat map showing differences in the profiles of 147 metabolites in EBs that were treated with or without ATV during days 3–5 and subjected to metabolomic analysis on days 4 and 5. (b) Principal component analysis of the EBs in (a). Principal components 1 and 2 account for 36.9% and 29.5% of total variance, respectively. (c) Intracellular levels of the indicated metabolites in the EBs in (a). Data are expressed as the relative area of signal peaks corresponding to each metabolite and represent the mean ± SD (n = 3). (d) Intracellular levels of the indicated free FAs and acylcarnitines in the EBs in (a) analysed as in (c). (e) Intracellular cholesterol levels in the EBs in (a) analysed as in (c). *P < 0.005.
Figure 4
Figure 4. Identification of the effector pathway downstream of mevalonate.
(a) Cardiomyocyte differentiation in EBs treated with DMSO (control) or 10 μM ATV, zaragozic acid (ZA), GGTI-2133 (GGTI) or FTI-277 (FTI) during days 3–6. Results were analysed as in Fig. 1c. (b) Real-time PCR of T expression in EBs treated with DMSO or 10 μM ATV, ZA, GGTI or FTI during days 3–4 and collected on day 4. Results were analysed as in Fig. 1b. *P < 0.05, **P < 0.001. *Zaragonic acid increased T and Lhx1 expression, which might be due to upregulation of HMGCR levels on day 3 and 4 (Supplementary Figure 3e). (c) Real-time PCR of T levels in EBs treated with DMSO or 10 μM ATV, with/without 12.5 μM farnesol (FOH), during days 3–5 and collected on day 5. Results were analysed as in Fig. 1b. (d) Representative 2D-PAGE images of farnesylated proteins detected with biotin-phosphine from ES cells and EBs that were left untreated (left) or treated with 10 μM FTI-277 (right) and analysed on day 4. Results are representative of three cultures. Black arrowheads, ~20 kDa farnesylated proteins; white arrowhead, EB-specific farnesylated protein. (e) Immunostaining to detect the localisation of Flag-Myc-tagged Lamin B1 (WT) or Lamin B1 (C-S mutant) in ES cells. Nuclei were visualised by Hoechst 33342 staining. Scale bars, 5 μm. (f) Real-time PCR of the indicated genes in the Lamin B1 WT, KO and REV EBs. EBs were collected at the indicated times and analysed as in Fig. 1b. *P < 0.05.
Figure 5
Figure 5. Involvement of the mevalonate pathway in primitive streak formation in mouse embryos.
Top: Schematic diagram of mouse embryonic development on the indicated days. Bottom: The mevalonate pathway produces farnesyl diphosphate for cholesterol synthesis, protein geranylgeranylation and protein farnesylation. The farnesylation of various proteins, including small G proteins and the nuclear protein Lamin B1, triggers primitive streak formation. Statins inhibit the induction of primitive streak genes by suppressing protein farnesylation. Consistent with our observations, Hmgcr KO mice and FTase KO mice are embryonic lethal at E8.5 and E7.5, respectively.

References

    1. ten Berge D. et al.. Wnt signaling mediates self-organization and axis formation in embryoid bodies. Cell Stem Cell 3, 508–518 (2008). - PMC - PubMed
    1. Wu J. et al.. p38 Mitogen-activated protein kinase controls a switch between cardiomyocyte and neuronal commitment of murine embryonic stem cells by activating myocyte enhancer factor 2C-dependent bone morphogenetic protein 2 transcription. Stem Cells Dev 19, 1723–1734 (2010). - PubMed
    1. Arima N., Uchida Y., Yu R., Nakayama K. & Nishina H. Acetylcholine receptors regulate gene expression that is essential for primitive streak formation in murine embryoid bodies. Biochem Biophys Res Commun 435, 447–453 (2013). - PubMed
    1. Yu R. et al.. A Modified Murine Embryonic Stem Cell Test for Evaluating the Teratogenic Effects of Drugs on Early Embryogenesis. PLoS One 10, e0145286, doi: 10.1371/journal.pone.0145286 (2015). - DOI - PMC - PubMed
    1. Ooga T. et al.. Metabolomic anatomy of an animal model revealing homeostatic imbalances in dyslipidaemia. Mol Biosyst 7, 1217–1223 (2011). - PubMed

Publication types