. 2016 Nov 23;3(5):419-433.e8.
doi: 10.1016/j.cels.2016.10.015.

Inferring Cell-State Transition Dynamics from Lineage Trees and Endpoint Single-Cell Measurements

Affiliations

Inferring Cell-State Transition Dynamics from Lineage Trees and Endpoint Single-Cell Measurements

Sahand Hormoz et al. Cell Syst. .

Abstract

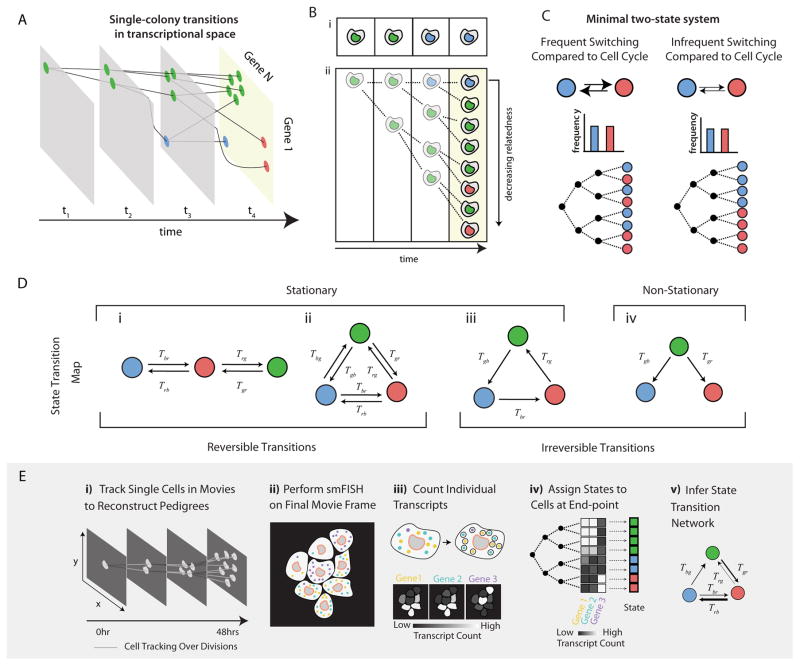
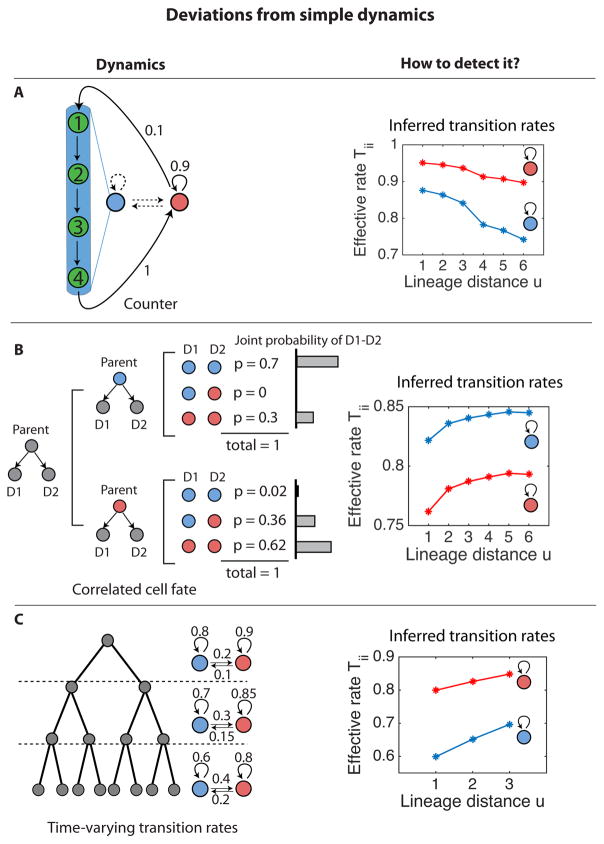
As they proliferate, living cells undergo transitions between specific molecularly and developmentally distinct states. Despite the functional centrality of these transitions in multicellular organisms, it has remained challenging to determine which transitions occur and at what rates without perturbations and cell engineering. Here, we introduce kin correlation analysis (KCA) and show that quantitative cell-state transition dynamics can be inferred, without direct observation, from the clustering of cell states on pedigrees (lineage trees). Combining KCA with pedigrees obtained from time-lapse imaging and endpoint single-molecule RNA-fluorescence in situ hybridization (RNA-FISH) measurements of gene expression, we determined the cell-state transition network of mouse embryonic stem (ES) cells. This analysis revealed that mouse ES cells exhibit stochastic and reversible transitions along a linear chain of states ranging from 2C-like to epiblast-like. Our approach is broadly applicable and may be applied to systems with irreversible transitions and non-stationary dynamics, such as in cancer and development.

Keywords: cell state transition; dynamics; heterogeneity; inference; lineage; single cell; single-molecule FISH; stem cells; stochasticity; time-lapse microscopy.


Figures

Figure 1
Figure 1. Cell state transition networks and the experimental platform for inferring transition rates
(A) Trajectory of a proliferating colony of cells in gene expression space (schematic). At each time-point, a cell can independently and stochastically change its cell state (color) and corresponding gene expression profile. Following a division, both daughter cells inherit the state of the parent but then follow independent stochastic dynamic trajectories. (B) (i) Dynamics can be determined by directly observing state transitions in a single cell over time, neglecting cell proliferation. (ii) Proliferating colonies provide an indirect record of the history of cell state transitions. Here the cell of interest (top row) is in the blue state but is related to a sister and cousins that are in the green state, indicating a likely green to blue transition in its recent past. (C) Different dynamics give rise to different degrees of clustering on a pedigree (schematic). Frequent or infrequent switching between red and blue states leads to weak or strong clustering of cell states, respectively. The distribution of states is independent of the switching rates in this simple example (bar plots). (D) Cell state transition networks can be classified based on whether the population fraction of each state is constant (stationary) or changing over time (non-stationary). A subset of stationary networks also exhibit reversible dynamics. (E) Experimental approach: i) Live cells are tracked as they grow and divide using time-lapse microscopy. ii) After the movie, the cells are fixed and stained for smFISH. iii) Individual molecules of mRNA are detected and counted in each cell. iv) The pedigree reconstructed from (i) is combined with the smFISH measurements, and each cell is assigned an expression state. v) Using KCA, cell state transition dynamics are inferred across many of these state-associated pedigrees (see Box 1).
Figure 2
Figure 2. Inference and direct validation of Esrrb dynamics
(A) The Esrrb-H2B-mCitrine knock-in reporter (top), and PiggyBac integration construct for a palmitoylated-mTurquoise2 (bottom). (Bi) An example time-lapse movie showing H2B-mCitrine fluorescence in a proliferating colony of ES cells. Arrow indicates root cell in E. Scale bar, 10 μm (Bii) A composite image of the membrane-mTurquoise2 (white), DAPI (red), and Esrrb transcripts by smFISH (yellow dots). (Biii) Heat map showing Esrrb transcript counts for each cell in this colony. (C) The distribution of Esrrb transcript counts can be fit by a linear combination of two negative binomial distributions (solid lines), with indicated population fractions (percentages). (Di) Lineage tree (pedigree) from example movie shown in B. State assignments on leaves indicate the probability that the cells are in the E+ state (see STAR Methods). (Dii) The probability of observing a pair of cells both in the E+ state (red), both in the E− state (blue), and as a mixed E+E− pair (green), as a function of degree of relatedness of the two cells, u. Cell state transition rates were computed from the observed correlation functions for each value of u. (Diii–iv) The probability per cell cycle of transitioning from E− to E+ (blue) and from E+ to E− (red). Error bars were obtained by bootstrap (see STAR Methods). Inferred rates are (within statistical error) independent of u, consistent with stationary Markovian dynamics. (Ei–iii) The same pedigree as in D with branches displaying accumulation of mCitrine fluorescence in each cell cycle. Arrows indicate a significant, heritable change in the rate of fluorescence accumulation, corresponding to switches between Esrrb states. (Eiv) Essrb cell state transition rates measured from switching events in the time-lapse movies are consistent with inferred rates (cf. Div). (F) Histogram of the time of occurrence of state transitions (on-events, top panel; off-events, bottom panel) along the cell cycle in units of hours since the last cell division. (Gi) Empirically determined frequency of finding a pair of cells both Esrrb high (red points) or Esrrb low (blue points) as a function of their physical separation distance, d, in the colony (in units of average cell diameters). Error bars are s.d. determined by bootstrap (299 cells, 14 colonies). Dashed lines indicate expected cell state correlation as function of spatial separation distance. The observed spatial correlations are consistent with the correlations expected from shared lineage alone. (Gii) Spatial separation distance correlates weakly with lineage distance u. The distribution for each value of u is independently normalized to peak at 1.
Figure 3
Figure 3. Characterizing a set of mouse embryonic stem cell states
(A) Distribution of the transcript counts of Esrrb, Tbx3, and Zscan4 in single cells as determined by smFISH. (B) Scatter plot of transcript counts by smFISH in 446 cells (individual dots). Color coding indicates assignment of each cell to one of five states. Blue-red gradations indicate probabilistic assignment of Esrrb expression states. (C) Example colonies showing groups of related cells in the same expression state for each of the three marker genes (for either the low or high state), consistent with cell states that persist over multiple generations. Yellow circles indicate transcripts detected by smFISH; red indicates DAPI stained nuclei; white is palmitoylated-mTurqoise2 demarcating cell membranes. (D) Sub-populations sorted on indicated marker genes (below columns) exhibit distinct RNA-seq profiles and broad differences in gene expression. FACS was performed based on distinguishable fluorescent reporter genes integrated at Esrrb and Tbx3 loci in the same cell (Fig. S2C), or, separately, based on a Zscan4 reporter integrated by PiggyBac transposition (right). Only genes showing statistically significant differential expression for the same cell line between sorted subpopulations are shown. (E) Zscan4+ cells exhibit a distinctive nuclear morphology compared to Zscan4− cells. DAPI stained nuclei (white, left); Zscan4 smFISH dots (yellow, right); membrane boundaries (red). (F) Nuclear morphology correlates with Zscan4 expression level (Pearson correlation coefficient = −0.15; p value= 0.002). The number of nuclear puncta detected in each cell plotted against the number of Zscan4 transcripts in the same cell. The color of each dot indicates the time since that cell’s last division, as determined by time-lapse microscopy.
Figure 4
Figure 4. State-switching dynamics within a pluripotency network
(A) (Left) Time-lapse movie used only for tracking cells to determine pedigrees. (Right) In the same cells, smFISH for Esrrb (cyan dots), Tbx3 (green dots), and Zscan4 (blue dots), as well as membrane-mTurquoise2 (white) and DAPI (red). (B) Segmented cells are color-coded by transcript count for each gene analyzed. (C) Pedigree reconstructed from cells tracked in A are plotted as a dendrogram, with state assignments and transcript counts for each of the three genes at the leaves. (D) Examples of other pedigrees and state assignments (see Fig. S4 for complete set). (Ei) Frequency of observation of each pair of states in sister cells (two-cell correlations). See Figure S5A for other lineage distances. (Eii) Using KCA, the transition rate matrix was computed from correlation matrices (see Box 1). (F) Inferred cell state transition network shows chain-like dynamics.
Figure 5
Figure 5. Detecting deviations from simple dynamics using self-consistency checks
(A) ‘Hidden,’ states can produce apparent non-Markovian dynamics. In this example, the blue state is actually composed of multiple distinct states (labeled 1–4), which are not separately identifiable. The blue state is thus a counter that persists for exactly four generations. KCA applied to the apparent 2-state system generates inferred persistence rates which change systematically with lineage distance, u, especially near u = 4, causing the inferred transition rates (right) to depend on lineage distance. Transition rates are indicated on arrows. (B) Deviation from simple dynamics resulting from correlated transitions. In this example, distinct division patterns are indicated with corresponding probabilities, p. Values were chosen such that the joint probability of observing a pair of sister cells in a pair of states conditional on the state of their parent is not equal to the product of their marginal probabilities. In this case, inferred transition rates depend on lineage distance (right). (C) When transition rates vary with time (left), the inferred transition rates vary with lineage distance (right). In this example, this effect can be used to infer the time-varying transition rates (see STAR Methods).

Similar articles

Cited by

References

    1. Ahrends R, Ota A, Kovary KM, Kudo T, Park BO, Teruel MN. Controlling low rates of cell differentiation through noise and ultrahigh feedback. Science. 2014;344:1384–1389. - PMC - PubMed
    1. Behjati S, Huch M, van Boxtel R, Karthaus W, Wedge DC, Tamuri AU, Martincorena I, Petljak M, Alexandrov LB, Gundem G, et al. Genome sequencing of normal cells reveals developmental lineages and mutational processes. Nature. 2014;513:422–425. - PMC - PubMed
    1. Buganim Y, Faddah DA, Cheng AW, Itskovich E, Markoulaki S, Ganz K, Klemm SL, van Oudenaarden A, Jaenisch R. Single-Cell Expression Analyses during Cellular Reprogramming Reveal an Early Stochastic and a Late Hierarchic Phase. Cell. 2012;150:1209–1222. - PMC - PubMed
    1. Canham MA, Sharov AA, Ko MSH, Brickman JM. Functional heterogeneity of embryonic stem cells revealed through translational amplification of an early endodermal transcript. PLoS Biol. 2010;8:e1000379. - PMC - PubMed
    1. Chambers I, Silva J, Colby D, Nichols J, Nijmeijer B, Robertson M, Vrana J, Jones K, Grotewold L, Smith A. Nanog safeguards pluripotency and mediates germline development. Nature. 2007;450:1230–1234. - PubMed

Publication types