. 2016 Nov 25;17(1):483.
doi: 10.1186/s12859-016-1323-z.

variancePartition: interpreting drivers of variation in complex gene expression studies

Affiliations

variancePartition: interpreting drivers of variation in complex gene expression studies

Gabriel E Hoffman et al. BMC Bioinformatics. .

Abstract

Background: As large-scale studies of gene expression with multiple sources of biological and technical variation become widely adopted, characterizing these drivers of variation becomes essential to understanding disease biology and regulatory genetics.

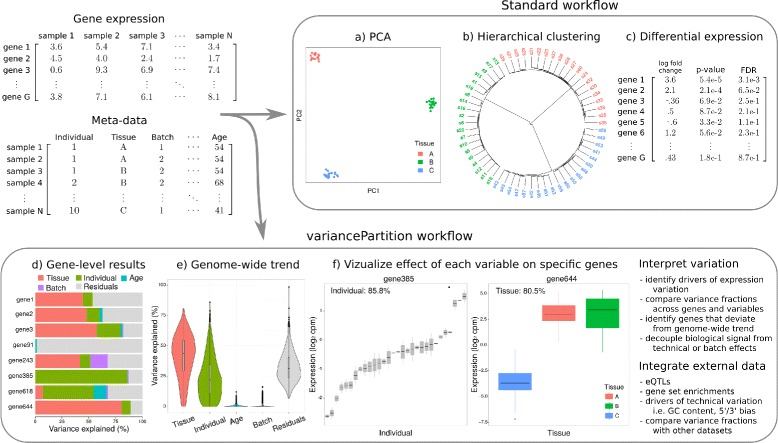
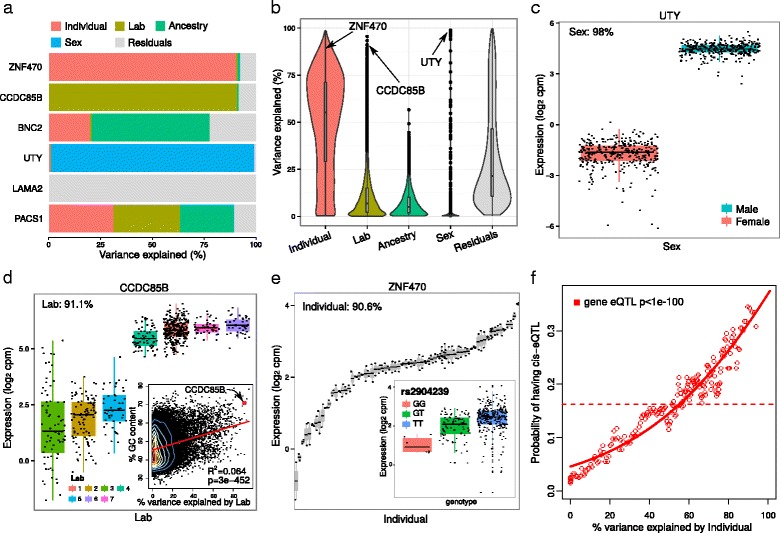
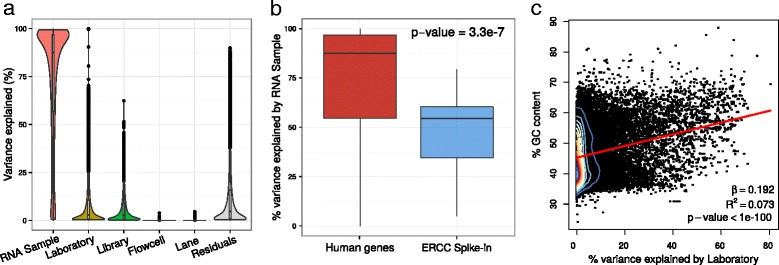
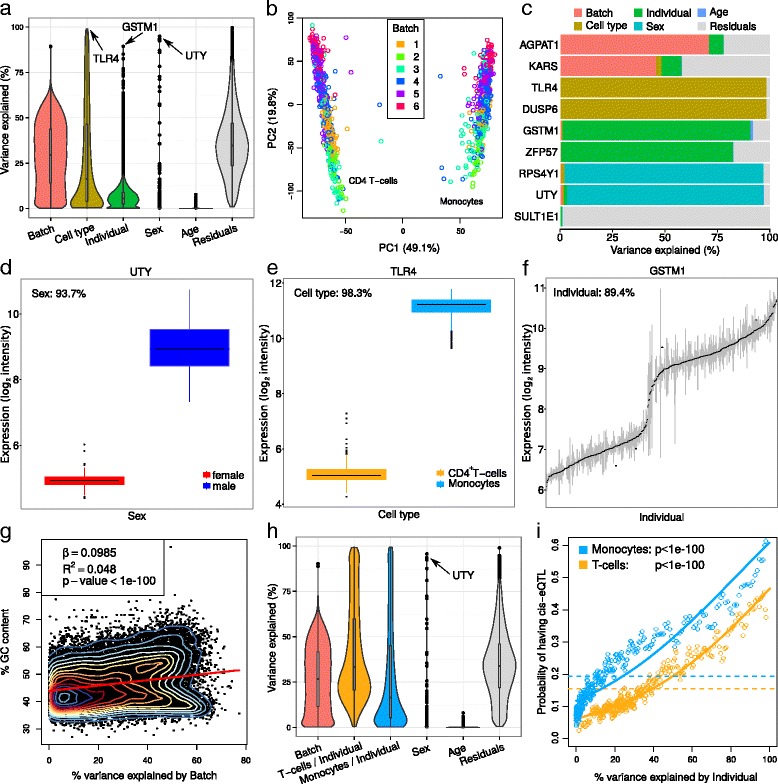
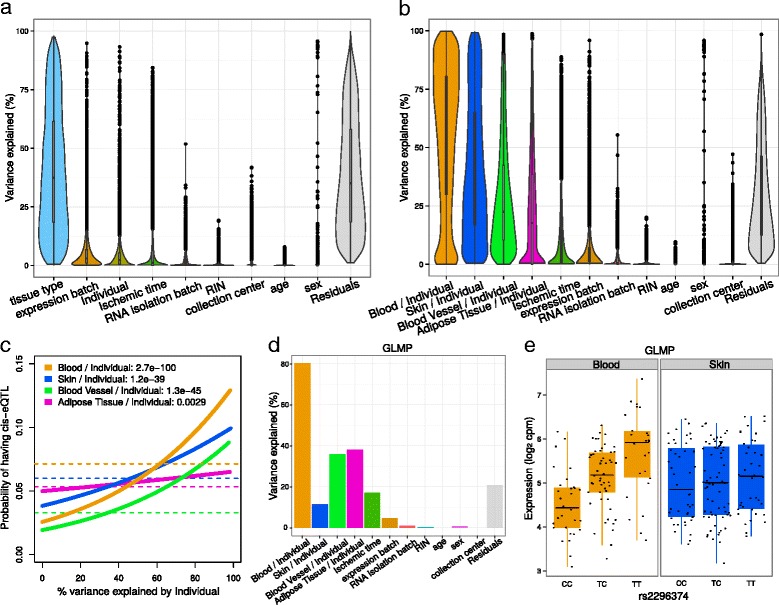
Results: We describe a statistical and visualization framework, variancePartition, to prioritize drivers of variation based on a genome-wide summary, and identify genes that deviate from the genome-wide trend. Using a linear mixed model, variancePartition quantifies variation in each expression trait attributable to differences in disease status, sex, cell or tissue type, ancestry, genetic background, experimental stimulus, or technical variables. Analysis of four large-scale transcriptome profiling datasets illustrates that variancePartition recovers striking patterns of biological and technical variation that are reproducible across multiple datasets.

Conclusions: Our open source software, variancePartition, enables rapid interpretation of complex gene expression studies as well as other high-throughput genomics assays. variancePartition is available from Bioconductor: http://bioconductor.org/packages/variancePartition .

Keywords: Linear mixed model; RNA-seq; Transcriptome profiling.


Figures

Fig. 1
Fig. 1
Analysis workflow of gene expression data and meta-data. Standard analysis consists of interpreting gene expression data with respect to variables in the metadata using genome-wide analysis such as a principal components analysis and b hierarchical clustering, and gene-level analysis such as c differential expression. The variancePartition workflow uses a rich statistical framework in the form of a linear mixed model and produces gene-level results and a genome-wide summary to simultaneously interpret gene expression data in the context of multiple variables in the metadata. The workflow produces d gene-level results quantifying the contribution of each metadata variable to the variation in expression of each gene, and e a violin plot to summarize the genome-wide trend and rank the total contribution of each variable. f The gene-level results can be used to identify genes that show high expression variation across individuals (i.e. gene385) or tissue (i.e. gene644). Furthermore, variancePartition facilitates examination of specific genes, and integrating external data enables further interpretation of the drivers of expression variation
Fig. 2
Fig. 2
Analysis of GEUVADIS dataset identifies drivers of expression variation. a Total variance for each gene is partitioned into the fraction attributable to each dimension of variation in the study. b Violin and box plots of percent variation in gene expression explained by each variable. Three representative genes and their major sources of variation are indicated. c Boxplot of UTY expression stratified by sex. d Boxplot of CCDC85B expression stratified by lab. Inset shows scatter plot of percent GC content versus percent variance explained by lab. Red line indicates linear regression line with coefficient of determination and p-value shown. e Boxplot of ZNF470 expression stratified by individual for a subset of individuals with at least 1 technical replicate. Inset illustrates a cis-eQTL for ZNF470 where expression is stratified by genotype at rs2904239. f Probability of each gene having a cis-eQTL plotted against the percent variance explained by individual. Dashed lines indicate the genome-wide average probability (i.e. 18% of genes have a detected eQTL in this dataset), and curves indicate logistic regression smoothed probabilities as a function of the percent variance explained by individual. Points indicate a sliding window average of the probability of genes in each window having a cis-eQTL. Window size is 200 genes with an overlap of 100 genes between windows. The p-value indicates the probability that a more extreme coefficient relating the eQTL probability to percent variation explained by individual is observed under the null hypothesis
Fig. 3
Fig. 3
Analysis of Sequencing Quality Control (SEQC) dataset decouples sources of technical variation. a Violin and box plots of percent variation in gene expression explained by each variable. b Boxplot of percent variance explained by RNA sample for human genes and External RNA Controls Consortium (ERCC) spike-in controls. P-value is from one-sided Mann-Whitney test. c Scatter plot of percent GC content and percent variance explained by laboratory. Red line indicates linear regression line with regression coefficient, coefficient of determination and p-value shown
Fig. 4
Fig. 4
Analysis of ImmVar dataset interprets multiple dimensions of expression variation. a Violin and box plots of percent variation in gene expression explained by each variable. b Principal components analysis of gene expression with experiments colored by batch. c Total variance for each gene is partitioned into the fraction attributable to each dimension of variation in the study design. d Expression of UTY stratified by sex. e Expression of TLR4 stratified by cell type. f Expression of GSTM1 stratified by individual. g Scatter plot of percent GC content and percent variance explained by batch. Red line indicates linear regression line with regression coefficient, coefficient of determination and p-value shown. h Results from variancePartition analysis allowing the contribution of individual to vary in each cell type. i Probability of each gene having a cis-eQTL plotted against the percent variance explained by individual within each cell type. Dashed lines indicate the genome-wide average probability, and curves indicate logistic regression smoothed probabilities as a function of the percent variance explained by individual within each cell type. Points indicate a sliding window average of the probability of genes in each window having a cis-eQTL. Window size is 200 genes with an overlap of 100 genes between windows. The p-value indicates the probability that a more extreme coefficient relating the eQTL probability to percent variation explained by individual is observed under the null hypothesis
Fig. 5
Fig. 5
Analysis of GTEx dataset identifies drivers of expression variation at multiple levels. a Violin and box plots of percent variation in gene expression explained by each variable. b Results from variancePartition analysis allowing the contribution of individual to vary in each tissue. c Probability of each gene having a cis-eQTL plotted against the percent variance explained by individual within each tissue. Dashed lines indicate the genome-wide average probability, and curves indicate logistic regression smoothed probabilities as a function of the percent variance explained by individual within each tissue. The p-value indicates the probability that a more extreme coefficient relating the eQTL probability to percent variation explained by individual is observed under the null hypothesis. d Fraction of variation in GLMP explained by each source of variation. e GLMP has a cis-eQTL active in blood but not skin

Similar articles

Cited by

References

    1. Raj T, Rothamel K, Mostafavi S, Ye C, Lee MMN, Replogle JM, Feng T, Asinovski N, Frohlich I, Imboywa S, Von Korff A, Okada Y, Patsopoulos NA, Davis S, McCabe C, Paik H-I, Srivastava GP, Raychaudhuri S, Hafler DA, Koller D, Regev A, Hacohen N, Mathis D, Benoist C, Stranger BE, De Jager PL. Polarization of the effects of autoimmune and neurodegenerative risk alleles in leukocytes. Science. 2014;344(6183):519–23. doi: 10.1126/science.1249547. - DOI - PMC - PubMed
    1. GTEx Consortium The Genotype-Tissue Expression (GTEx) pilot analysis: Multitissue gene regulation in humans. Science. 2015;348(6235):648–60. doi: 10.1126/science.1262110. - DOI - PMC - PubMed
    1. Ramasamy A, Trabzuni D, Guelfi S, Varghese V, Smith C, Walker R, De T, Hardy J, Ryten M, Trabzuni D, Guelfi S, Weale ME, Ramasamy A, Forabosco P, Smith C, Walker R, Arepalli S, Cookson MR, Dillman A, Gibbs JR, Hernandez DG, Nalls MA, Singleton AB, Traynor B, van der Brug M, Ferrucci L, Johnson R, Zielke R, Longo DL, Troncoso J, Zonderman A, Coin L, de Silva R, Cookson MR, Singleton AB, Hardy J, Ryten M, Weale ME. Genetic variability in the regulation of gene expression in ten regions of the human brain. Nat Neurosci. 2014;17(10):1418–28. doi: 10.1038/nn.3801. - DOI - PMC - PubMed
    1. Lee MN, Ye C, Villani AC, Raj T, Li W, Eisenhaure TM, Imboywa SH, Chipendo PI, Ran FA, Slowikowski K, Ward LD, Raddassi K, McCabe C, Lee MH, Frohlich IY, Hafler D. a, Kellis M, Raychaudhuri S, Zhang F, Stranger BE, Benoist CO, De Jager PL, Regev A, Hacohen N. Common genetic variants modulate pathogen-sensing responses in human dendritic cells. Science. 2014;343(6175):1246980. doi: 10.1126/science.1246980. - DOI - PMC - PubMed
    1. Fairfax BP, Humburg P, Makino S, Naranbhai V, Wong D, Lau E, Jostins L, Plant K, Andrews R, McGee C, Knight JC. Innate immune activity conditions the effect of regulatory variants upon monocyte gene expression. Science. 2014;343(6175):1246949. doi: 10.1126/science.1246949. - DOI - PMC - PubMed