. 2016 Nov 24;17(1):236.
doi: 10.1186/s13059-016-1104-z.

Patterns of ribosomal protein expression specify normal and malignant human cells

Affiliations

Patterns of ribosomal protein expression specify normal and malignant human cells

Joao C Guimaraes et al. Genome Biol. .

Abstract

Background: Ribosomes are highly conserved molecular machines whose core composition has traditionally been regarded as invariant. However, recent studies have reported intriguing differences in the expression of some ribosomal proteins (RPs) across tissues and highly specific effects on the translation of individual mRNAs.

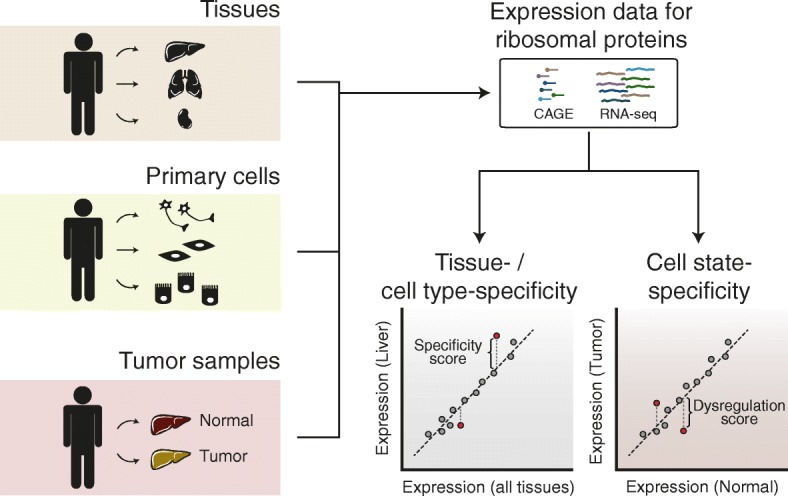
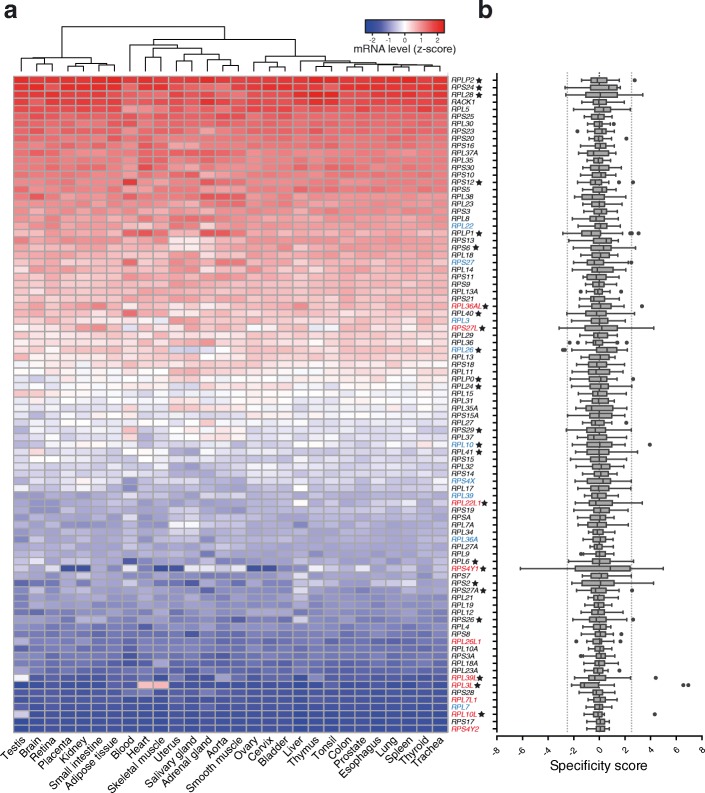
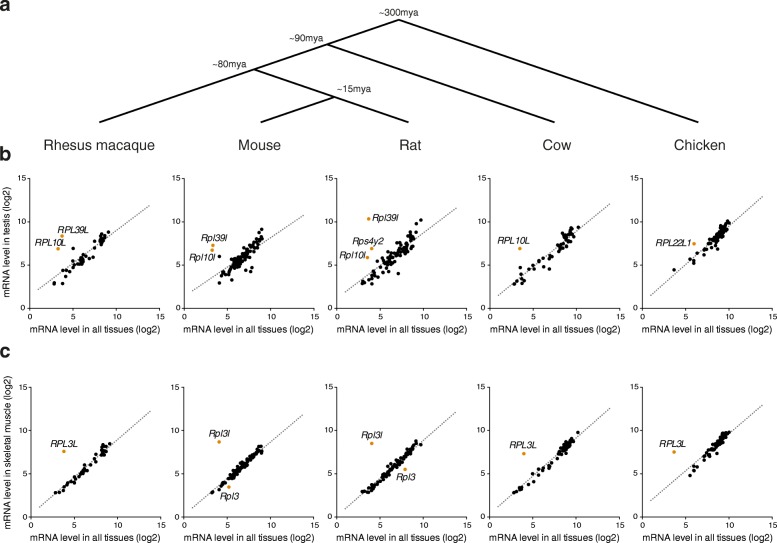
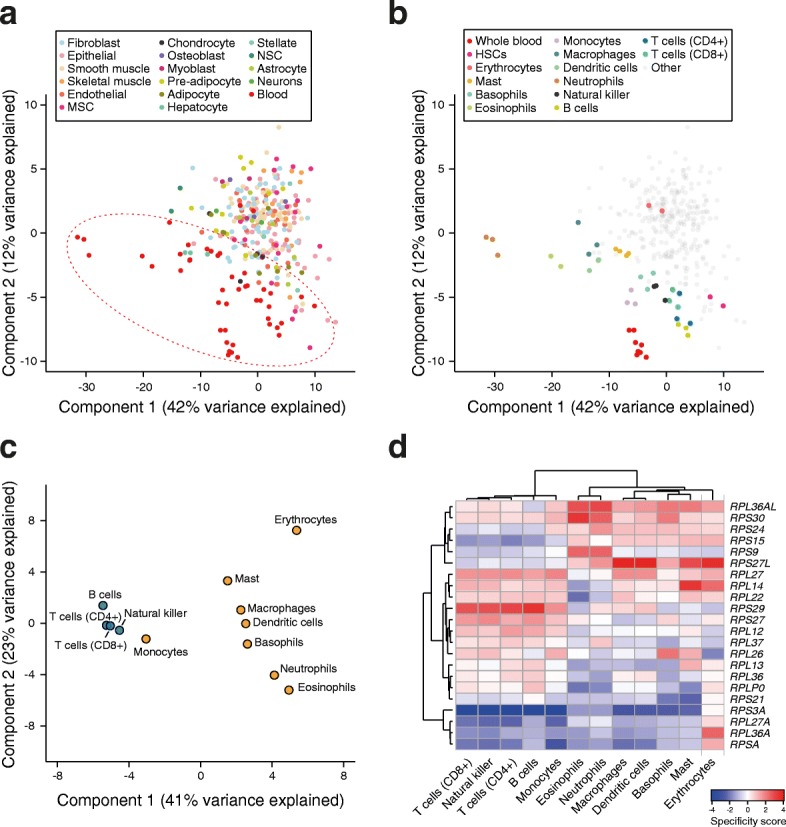
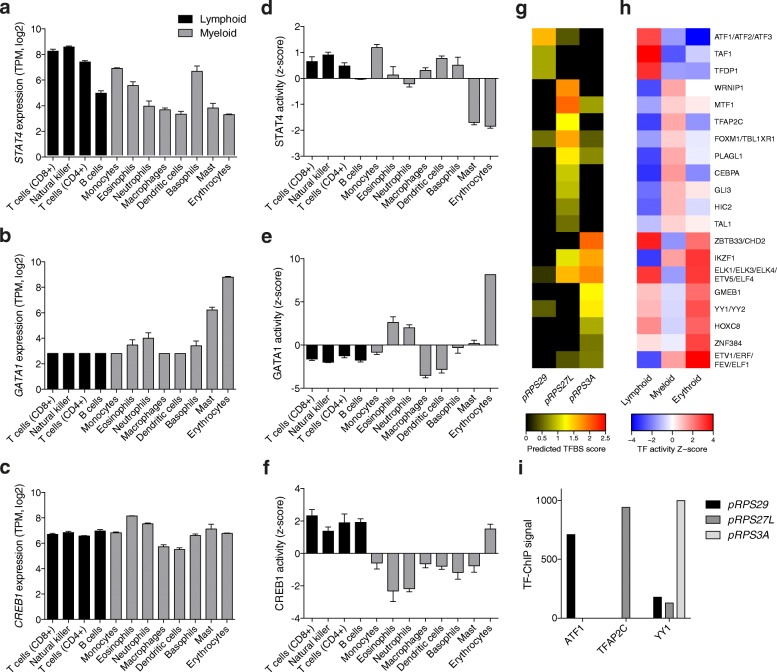
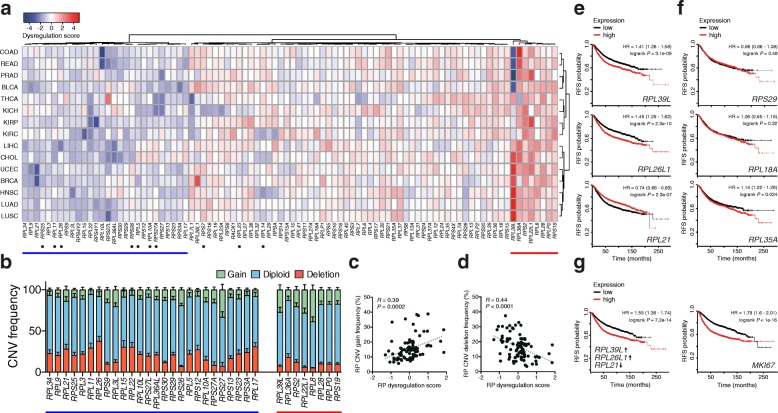
Results: To determine whether RPs are more generally linked to cell identity, we analyze the heterogeneity of RP expression in a large set of human tissues, primary cells, and tumors. We find that about a quarter of human RPs exhibit tissue-specific expression and that primary hematopoietic cells display the most complex patterns of RP expression, likely shaped by context-restricted transcriptional regulators. Strikingly, we uncover patterns of dysregulated expression of individual RPs across cancer types that arise through copy number variations and are predictive for disease progression.

Conclusions: Our study reveals an unanticipated plasticity of RP expression across normal and malignant human cell types and provides a foundation for future characterization of cellular behaviors that are orchestrated by specific RPs.

Keywords: Cancer; Hematopoiesis; Ribosomal proteins; Ribosome heterogeneity; Translation.


Figures

Fig. 1
Fig. 1
Evaluation of RP expression specificity across human tissues, primary cells, and tumors. The expression levels of RP genes across human tissues and primary cells were obtained from the FANTOM5 project repository. Gene expression data for matched normal and tumor samples were retrieved from The Cancer Genome Atlas (TCGA). As the correlation of RP expression levels across samples was very high, tissue/cell-specific expression of individual RP genes was estimated relative to the average across samples. Similarly, the scores for RP dysregulation in tumors were computed relative to the linear fit to the RP expression in the matched normal tissue. Cap analysis gene expression (CAGE) is based on the purification and sequencing of the 5′ end of mRNAs
Fig. 2
Fig. 2
Several RPs exhibit tissue-specific expression. a Heatmap depicting the standard score-normalized expression level of 90 RP genes across 28 human tissues. Genes encoding the same RP (paralog genes) can be classified into canonical (e.g., because they are more ubiquitously expressed) and non-canonical and are highlighted in blue and red, respectively. RP genes exhibiting tissue-specific expression are marked with a star. b Boxplots illustrating the distribution of specificity scores for each RP across tissues. Boxes extend from the 25th to 75th percentiles (interquartile range (IQR)), vertical lines represent the median, whiskers indicate the lowest and highest datum within 1.5*IQR from the lower and upper quartiles, respectively. Values outside this range are plotted as individual dots. Dotted lines show the thresholds defining tissue-specific RPs (|specificity score| >2.5). RPs are shown in the same order as in panel a
Fig. 3
Fig. 3
Differential expression of RPs is conserved across evolutionarily distant vertebrates. a RP expression was examined for five different vertebrates (rhesus macaque, mouse, rat, cow, and chicken) that have diverged ~300 million years ago. b, c RP mRNA expression levels in testis (b) and skeletal muscle (c) compared to the average expression levels across all tissues in five different vertebrates. Each dot is an RP gene, and the linear fit is shown as a dotted line. RPs displaying significant tissue-specific expression are shown in orange and labeled. Increased expression of RPL10 and RPL39L in testis is conserved in human, rhesus macaque, mouse, and rat. RPL10L, but not RPL39L, is also expressed at higher level in cow. In chicken, another non-canonical RP gene paralog, RPL22L1, is specifically expressed in testis. Skeletal muscle samples exhibit a striking up-regulation of the non-canonical RP gene paralog RPL3L across all five species
Fig. 4
Fig. 4
The pattern of RP expression distinguishes hematopoietic cell types. a PCA reveals distinct RP expression patterns in primary hematopoietic cell samples (red dashed oval) and samples from other cell types (color code in the legend). MSC mesenchymal stem cell, NSC neural stem cell. b Hematopoietic cell types have been recolored to illustrate that the pattern of RP expression can discriminate cells belonging to different developmental states. HSC hematopoietic stem cell. c PCA of RP specificity scores of mature cell types compared to HSCs identifies hematopoietic lineages (blue: lymphoid cell types, orange: myeloid cell types). d Hierarchical clustering of specificity scores across cell types suggests that several RP genes are co-regulated in the different developmental lineages
Fig. 5
Fig. 5
Differentially expressed RPs display distinct regulatory fingerprints. a–c Expression level of STAT4 (a), GATA1 (b), and CREB1 (c) across the different hematopoietic cell types. Lymphoid and myeloid cell types are colored in black and gray, respectively. STAT4 (P < 0.001) and GATA1 (P < 0.01) show an expression bias toward lymphoid and erythroid cells, respectively. Conversely, the expression of CREB1 is not significantly different between lymphoid and myeloid cell types (P = 0.55). df Differences in the activities of STAT4 (d), GATA1 (e), and CREB1 (f) across hematopoietic cell types, as inferred from the regulation of their respective targets. STAT4 and CREB1 show a higher activity in lymphoid compared to other cells (P = 0.09 and P < 0.001, respectively), whereas GATA1 shows a greater activity in erythrocytes (P < 0.01). The distributions of expression levels and activities of transcription factors between cell types of different lineages were compared using the non-parametric Mann-Whitney U test (one-tailed). g The heatmap of the predicted transcription factor binding site (TFBS) motif scores (rows) in the promoters of the three RP genes (columns) that had the highest variance across the different primary hematopoietic cells indicates largely non-overlapping transcription regulatory interactions. h Heatmap of the average activity scores across cell types belonging to the three different lineages (lymphoid, myeloid, and erythroid) for the TFs listed. i TF-ChIP-inferred binding scores of three different lineage-specific TFs (ATF1, TFAP2C, and YY1 for lymphoid, myeloid, and erythroid lineages, respectively) in the promoters of three different RPs displaying lineage-specific expression (RPS29, RPS27L, and RPS3A for lymphoid, myeloid, and erythroid lineages, respectively)
Fig. 6
Fig. 6
Dysregulation of RP expression in cancers is linked to survival. a Heatmap showing the dysregulation scores of individual RP genes in cancers. There are three prominent clusters of RPs, corresponding (from left to right) to consistently negative (blue line), variable, and consistently positive (red line) dysregulation score across different cancers. RPs reported to be involved in p53 regulation are marked with a dot. Several cancers also exhibit dysregulation of specific RP genes. COAD colon adenocarcinoma, READ rectum adenocarcinoma, PRAD prostate adenocarcinoma, BLCA bladder urothelial carcinoma, THCA thyroid carcinoma, KICH kidney chromophobe, KIRP kidney renal papillary cell carcinoma, KIRC kidney renal clear cell carcinoma, LIHC liver hepatocellular carcinoma, CHOL cholangiocarcinoma, UCEC, uterine corpus endometrial carcinoma, BRCA breast invasive carcinoma, HNSC head and neck squamous cell carcinoma, LUAD lung adenocarcinoma, LUSC lung squamous cell carcinoma. b RP genes showing negative (blue line) and positive (red line) dysregulation score exhibit a correspondingly high degree of copy number variation (CNV) deletion and gain across cancers, respectively. Error bars depict the standard error of the mean. c, d RP average dysregulation scores across cancers are significantly correlated with both the average frequency of copy number gain (c) and deletion (d). e, f Kaplan-Meier relapse-free survival (RFS) plots for three RPs identified as dysregulated (e) or not dysregulated (f) in human breast carcinoma. g Kaplan-Meier RFS plots for the combined signature of the three RPs identified as dysregulated in breast cancer (left) and the gene that is most predictive for breast cancer RFS: MKI67 (right). Hazard ratios (HR) and respective 95% confidence interval as well as logrank P values are shown for each survival analysis

Similar articles

Cited by

References

    1. Klinge S, Voigts-Hoffmann F, Leibundgut M, Ban N. Atomic structures of the eukaryotic ribosome. Trends Biochem Sci. 2012;37:189–98. doi: 10.1016/j.tibs.2012.02.007. - DOI - PubMed
    1. Ramakrishnan V. The ribosome emerges from a black box. Cell. 2014;159:979–84. doi: 10.1016/j.cell.2014.10.052. - DOI - PubMed
    1. Ban N, Beckmann R, Cate JH, Dinman JD, Dragon F, Ellis SR, Lafontaine DL, Lindahl L, Liljas A, Lipton JM, et al. A new system for naming ribosomal proteins. Curr Opin Struct Biol. 2014;24:165–9. doi: 10.1016/j.sbi.2014.01.002. - DOI - PMC - PubMed
    1. Khatter H, Myasnikov AG, Natchiar SK, Klaholz BP. Structure of the human 80S ribosome. Nature. 2015;520:640–5. doi: 10.1038/nature14427. - DOI - PubMed
    1. Xue S, Barna M. Specialized ribosomes: a new frontier in gene regulation and organismal biology. Nat Rev Mol Cell Biol. 2012;13:355–69. doi: 10.1038/nrm3359. - DOI - PMC - PubMed

Publication types

Substances