Factors related to renal cortical atrophy development after glucocorticoid therapy in IgG4-related kidney disease: a retrospective multicenter study
- PMID: 27884179
- PMCID: PMC5123425
- DOI: 10.1186/s13075-016-1175-y
Factors related to renal cortical atrophy development after glucocorticoid therapy in IgG4-related kidney disease: a retrospective multicenter study
Abstract
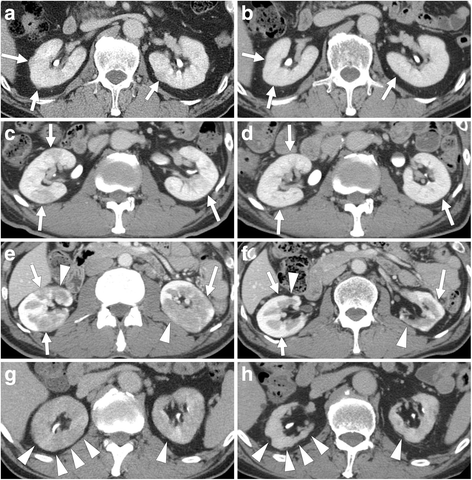
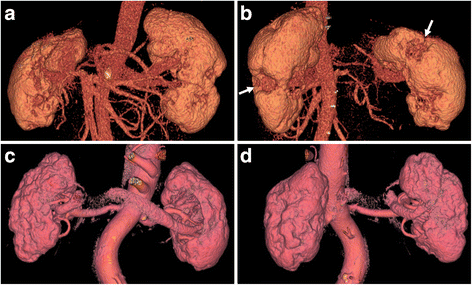
Background: In immunoglobulin G4-related kidney disease (IgG4-RKD), focal or diffuse renal cortical atrophy is often observed in the clinical course after glucocorticoid therapy. This study aimed to clarify the factors related to renal atrophy after glucocorticoid therapy in IgG4-RKD.
Methods: We retrospectively evaluated clinical features including laboratory data and computed tomography (CT) findings before and after glucocorticoid therapy in 23 patients diagnosed with IgG4-RKD, all of whom were followed up for more than 24 months.
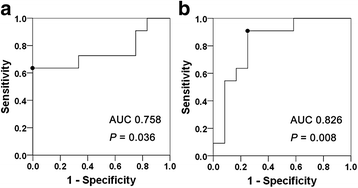
Results: Seventeen patients were men, and six were women (average age 62.0 years). Average follow-up period was 54.9 months. The average estimated glomerular filtration rate (eGFR) at diagnosis was 81.7 mL/min/1.73 m2. All patients had had multiple low-density lesions on contrast-enhanced CT before glucocorticoid therapy, and showed disappearance or reduction of these lesions after it. Pre-treatment eGFR and serum IgE level in 11 patients in whom renal cortical atrophy developed 24 months after the start of glucocorticoid therapy were significantly different from those in 12 patients in whom no obvious atrophy was found at that time (68.9 ± 30.1 vs 93.5 ± 14.1 mL/min/1.73 m2, P = 0.036, and 587 ± 254 vs 284 ± 263 IU/mL, P = 0.008, respectively). Pre-treatment eGFR and serum IgE level were also significant risk factors for renal atrophy development 24 months after the start of therapy with an odds ratio of 0.520 (per 10 mL/min/1.73 m2, 95% confidence interval (CI) 0.273-0.993, P = 0.048) and 1.090 (per 10 IU/mL, 95% CI: 1.013-1.174, P = 0.022), respectively, in age-adjusted, sex-adjusted, serum IgG4 level-adjusted logistic regression analysis. Receiver operating characteristic curve analysis showed that eGFR of less than 71.0 mL/min/1.73 m2 and serum IgE of more than 436.5 IU/mL were the most appropriate cutoffs and yielded sensitivity of 63.6% and specificity of 100%, and sensitivity of 90.9% and specificity of 75.0%, respectively, in predicting renal atrophy development.
Conclusions: This study suggests that pre-treatment renal insufficiency and serum IgE elevation predict renal atrophy development after glucocorticoid therapy in IgG4-RKD.
Keywords: Atrophy; Glucocorticoid; IgG4-related disease; IgG4-related kidney disease.
Figures


Similar articles
-
Recovery of renal function after glucocorticoid therapy for IgG4-related kidney disease with renal dysfunction.Clin Exp Nephrol. 2016 Feb;20(1):87-93. doi: 10.1007/s10157-015-1140-0. Epub 2015 Jul 4. Clin Exp Nephrol. 2016. PMID: 26141243 Free PMC article.
-
Clinical characteristics of autoimmune pancreatitis with IgG4 related kidney disease.Adv Med Sci. 2019 Sep;64(2):246-251. doi: 10.1016/j.advms.2018.12.005. Epub 2019 Feb 28. Adv Med Sci. 2019. PMID: 30826634
-
Proposal for diagnostic criteria for IgG4-related kidney disease.Clin Exp Nephrol. 2011 Oct;15(5):615-626. doi: 10.1007/s10157-011-0521-2. Epub 2011 Sep 7. Clin Exp Nephrol. 2011. PMID: 21898030
-
[IgG4-related kidney disease. Diagnosis and treatment].Nihon Rinsho Meneki Gakkai Kaishi. 2015;38(1):8-16. doi: 10.2177/jsci.38.8. Nihon Rinsho Meneki Gakkai Kaishi. 2015. PMID: 25765684 Review. Japanese.
-
[IgG4-related lung disease: analysis of 8 cases and literature review].Zhonghua Jie He He Hu Xi Za Zhi. 2017 Mar 12;40(3):193-198. doi: 10.3760/cma.j.issn.1001-0939.2017.03.010. Zhonghua Jie He He Hu Xi Za Zhi. 2017. PMID: 28297814 Review. Chinese.
Cited by
-
A case of IgG4-related kidney disease with predominantly unilateral renal atrophy.CEN Case Rep. 2019 Feb;8(1):8-13. doi: 10.1007/s13730-018-0355-9. Epub 2018 Jul 30. CEN Case Rep. 2019. PMID: 30062635 Free PMC article.
-
Long-term effects of intensive B cell depletion therapy in severe cases of IgG4-related disease with renal involvement.Immunol Res. 2020 Dec;68(6):340-352. doi: 10.1007/s12026-020-09163-3. Epub 2020 Nov 10. Immunol Res. 2020. PMID: 33174125 Free PMC article.
-
Improved Renal Function in Initial Treatment Improves Patient Survival, Renal Outcomes, and Glucocorticoid-Related Complications in IgG4-Related Kidney Disease in Japan.Kidney Int Rep. 2023 Oct 20;9(1):52-63. doi: 10.1016/j.ekir.2023.10.016. eCollection 2024 Jan. Kidney Int Rep. 2023. PMID: 38312790 Free PMC article.
-
The many faces of IgG4-related disease: report of a case with inaugural recurrent aortic aneurism ruptures and literature review.Rheumatol Int. 2018 Aug;38(8):1565-1570. doi: 10.1007/s00296-018-4046-9. Epub 2018 May 12. Rheumatol Int. 2018. PMID: 29754327
-
Abundant a proliferation-inducing ligand (APRIL)-producing macrophages contribute to plasma cell accumulation in immunoglobulin G4-related disease.Nephrol Dial Transplant. 2019 Jun 1;34(6):960-969. doi: 10.1093/ndt/gfy296. Nephrol Dial Transplant. 2019. PMID: 30325430 Free PMC article.
References
Publication types
MeSH terms
Substances
LinkOut - more resources
Full Text Sources
Other Literature Sources
Medical
Research Materials
Miscellaneous

