. 2016 Nov;4(22):e13029.
doi: 10.14814/phy2.13029.

Impact of external pneumatic compression target inflation pressure on transcriptome-wide RNA expression in skeletal muscle

Affiliations

Impact of external pneumatic compression target inflation pressure on transcriptome-wide RNA expression in skeletal muscle

Jeffrey S Martin et al. Physiol Rep. 2016 Nov.

Abstract

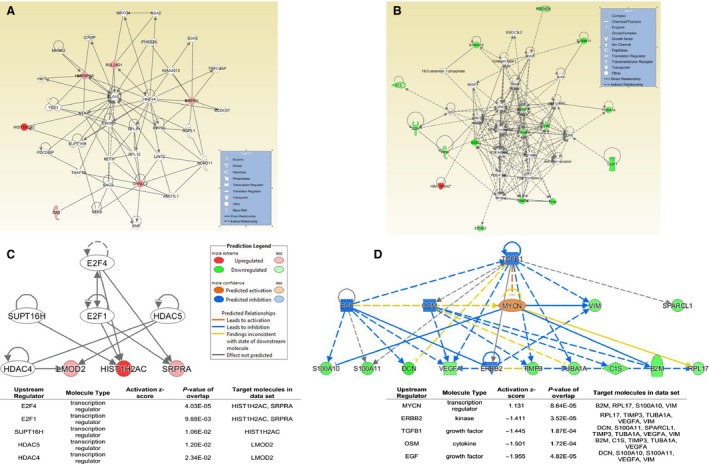
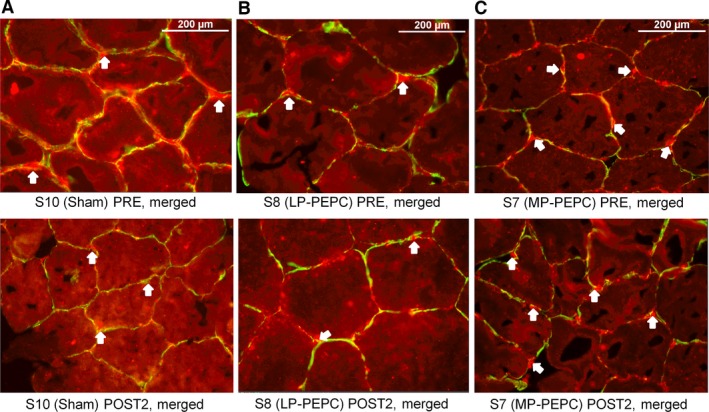
Next-generation RNA sequencing was employed to determine the acute and subchronic impact of peristaltic pulse external pneumatic compression (PEPC) of different target inflation pressures on global gene expression in human vastus lateralis skeletal muscle biopsy samples. Eighteen (N = 18) male participants were randomly assigned to one of the three groups: (1) sham (n = 6), 2) EPC at 30-40 mmHg (LP-EPC; n = 6), and 3) EPC at 70-80 mmHg (MP-EPC; n = 6). One hour treatment with sham/EPC occurred for seven consecutive days. Vastus lateralis skeletal muscle biopsies were performed at baseline (before first treatment; PRE), 1 h following the first treatment (POST1), and 24 h following the last (7th) treatment (POST2). Changes from PRE in gene expression were analyzed via paired comparisons within each group. Genes were filtered to include only those that had an RPKM ≥ 1.0, a fold-change of ≥1.5 and a paired t-test value of <0.01. For the sham condition, two genes at POST1 and one gene at POST2 were significantly altered. For the LP-EPC condition, nine genes were up-regulated and 0 genes were down-regulated at POST1 while 39 genes were up-regulated and one gene down-regulated at POST2. For the MP-EPC condition, two genes were significantly up-regulated and 21 genes were down-regulated at POST1 and 0 genes were altered at POST2. Both LP-EPC and MP-EPC acutely alter skeletal muscle gene expression, though only LP-EPC appeared to affect gene expression with subchronic application. Moreover, the transcriptome response to EPC demonstrated marked heterogeneity (i.e., genes and directionality) with different target inflation pressures.

Keywords: External pneumatic compression; PGC‐1α; RNA sequencing; redox balance; skeletal muscle.


Figures

Figure 1
Figure 1
Ingenuity Pathway Analysis (IPA) using the genes significantly affected at the POST1 time point by low‐pressure peristaltic pulse external pneumatic compression (LPPEPC) and moderate pressure (MPPEPC). (A) Top gene network at POST1 for LPPEPC, (B) top gene network at POST1 for MPPEPC, (C) summary of upstream regulator analysis in IPA (upstream molecules that are causally connected to a subset of genes) at POST1 for LPPEPC, and (D) summary of upstream regulator analysis in IPA at POST1 for MPPEPC. For the upstream regulator analysis, the top five regulators are presented.
Figure 2
Figure 2
Ingenuity Pathway Analysis (IPA) using the genes significantly affected at the POST2 time point by low‐pressure peristaltic pulse external pneumatic compression (LPPEPC). (A) Top gene network at POST2 for LPPEPC, (B) second highest scored gene network at POST2 for LPPEPC, and (C) summary of upstream regulator analysis in IPA (upstream molecules that are causally connected to a subset of genes) at POST2 for LPPEPC. For the upstream regulator analysis, the top five regulators are presented.
Figure 3
Figure 3
Effects of acute (POST1) and subchronic (POST2) peristaltic pulse external pneumatic compression (PEPC) and sham on selected skeletal muscle protein expression relative to pretreatment (PRE). (A) 4‐hydroxynonenal (4HNE), (B) catalase, (C) proliferator‐activated receptor gamma coactivator‐1 alpha (PGC‐1α), and (D) vascular endothelial growth factor A (VEGF‐A). A representative western blot image of all protein levels and respective Ponceau images are presented immediately to the right of each graph. LP, low pressure (30–40 mmHg); MP, moderate pressure (70–80 mmHg); P1, POST1; P2, POST2. All data are expressed as fold‐change from PRE levels (mean ± SEM, = 5–6 subjects per target). Significance from between time points comparisons using Student's t‐tests are indicated within each panel. *significantly different from PRE in LPPEPC group.
Figure 4
Figure 4
Effects of acute (POST1) and subchronic (POST2) peristaltic pulse external pneumatic compression (PEPC) and sham on (A) nuclear fraction of PGC‐1α and (B) phosphorylated eNOS (p‐ENOS) expression relative to pretreatment (PRE). Representative photomicrographs are presented in Figures 3 and 4. LP, low pressure (30–40 mmHg); MP, moderate pressure (70–80 mmHg); P1, POST1; P2, POST2. All data are expressed as fold‐change from PRE levels (mean ± SEM, = 5–6 subjects per target).
Figure 5
Figure 5
Representative 40x objective cross‐sectional images of nuclear fraction of PGC‐1α in vastus lateralis skeletal muscle biopsies pretreatment (PRE) and 24 h following seven consecutive days of treatment (POST2) with sham, low‐pressure peristaltic pulse external pneumatic compression (LPPEPC), and moderate pressure PEPC (MPPEPC). Slides were stained with antibodies against PGC‐1α and MAB and were counterstained with DAPI. Arrows indicate examples of identified PGC‐1α localized to the nucleus within the photomicrograph at the PRE and POST2 time points for (A) sham, (B) LPPEPC, and (C) MPPEPC.
Figure 6
Figure 6
Representative 40x objective cross‐sectional images of phosphorylated eNOS in vastus lateralis skeletal muscle biopsies pretreatment (PRE) and 24 h following seven consecutive days of treatment (POST2) with sham, low‐pressure peristaltic pulse external pneumatic compression (LPPEPC), and moderate pressure PEPC (MPPEPC). Slides were stained with antibodies against phospho‐eNOS (SER1177) and dystrophin. Arrows indicate examples of identified phospho‐eNOS within the photomicrograph at the PRE and POST2 time points for (A) sham, (B) LPPEPC, and (C) MP‐PEPC.

References

    1. Brutsaert, T. D. , Gavin T. P., Fu Z., Breen E. C., Tang K., Mathieu‐Costello O., et al. 2002. Regional differences in expression of VEGF mRNA in rat gastrocnemius following 1 hr exercise or electrical stimulation. BMC Physiol. 2:8. - PMC - PubMed
    1. Cohen, J. 1992. A power primer. Psychol. Bull. 112:155–159. - PubMed
    1. Fang, Z. , and Cui X.. 2011. Design and validation issues in RNA‐seq experiments. Brief. Bioinform 12:280–287. - PubMed
    1. Ferrara, N. , and Davis‐Smyth T.. 1997. The biology of vascular endothelial growth factor. Endocr. Rev. 18:4–25. - PubMed
    1. Gordon, W. R. , Zimmerman B., He L., Miles L. J., Huang J., Tiyanont K., et al. 2015. Mechanical allostery: evidence for a force requirement in the proteolytic activation of Notch. Dev. Cell 33:729–736. - PMC - PubMed

Publication types

Substances

LinkOut - more resources