. 2016 Nov 25;48(11):e272.
doi: 10.1038/emm.2016.103.

Aldehyde dehydrogenase is used by cancer cells for energy metabolism

Affiliations

Aldehyde dehydrogenase is used by cancer cells for energy metabolism

Joon Hee Kang et al. Exp Mol Med. .

Abstract

We found that non-small-cell lung cancer (NSCLC) cells express high levels of multiple aldehyde dehydrogenase (ALDH) isoforms via an informatics analysis of metabolic enzymes in NSCLC and immunohistochemical staining of NSCLC clinical tumor samples. Using a multiple reaction-monitoring mass spectrometry analysis, we found that multiple ALDH isozymes were generally abundant in NSCLC cells compared with their levels in normal IMR-90 human lung cells. As a result of the catalytic reaction mediated by ALDH, NADH is produced as a by-product from the conversion of aldehyde to carboxylic acid. We hypothesized that the NADH produced by ALDH may be a reliable energy source for ATP production in NSCLC. This study revealed that NADH production by ALDH contributes significantly to ATP production in NSCLC. Furthermore, gossypol, a pan-ALDH inhibitor, markedly reduced the level of ATP. Gossypol combined with phenformin synergistically reduced the ATP levels, which efficiently induced cell death following cell cycle arrest.


Figures
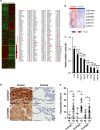
Figure 1
Figure 1
High aldehyde dehydrogenase (ALDH) isoform expression levels are associated with poor overall survival in non-small-cell lung cancer (NSCLC). (a) Metabolic gene clustering of samples from lung adenocarcinoma patients from The Cancer Genome Atlas (TCGA). The clustered genes in set A were upregulated in the tumor group, and 150 metabolic genes with P<0.05 are listed. (b) Clustering analysis of six ALDH isoforms. Data for ALDH18A1 (P=1.31 × 10−38), ALDH1B1 (P=3.84 × 10⁻¹⁵), ALDH3B2 (P=1.17 × 10⁻¹⁰), ALDH1L2 (P=1.58 × 10−05), ALDH7A1 (P=1.09 × 10⁻⁴) and ALDH1L1 (P=2.32 × 10⁻²) are shown. Gene expression values were normalized using standard normalization (mean=0 and s.d.=1). Each row of the heat map is sorted in an ascending order according to the P-value. (c) Relative Aldefluor activity from various NSCLC cell lines and primary human lung cells. **P<0.01, ***P<0.001. (d) Immunohistochemical staining of ALDH isoforms in normal and cancerous lung tissue. Scale bar=100 μm. (e) Expression of ALDH3A1, ALDH3A2 and ALDH3B2 in cancerous (CA, triangles) and normal lung type I and II pneumocytes (NL, circles). *P<0.001, n=59 for each sample.
Figure 2
Figure 2
Multiple isoforms of aldehyde dehydrogenase (ALDH) show increased expression in non-small-cell lung cancer (NSCLC) cells. (a) Schematic diagram of liquid chromatography multiple reaction-monitoring mass spectrometry (LC-MRM-MS). (b) Expression of ALDH isoforms in lung cancer cell lines was measured via MRM-MS. (c) Immunoblot analysis of ALDH isoforms in NSCLC cell lines. IMR-90 and normal lung airway cells were used as non-cancer controls, whereas β-actin was used as a loading control. (d) ALDH1A3 was ubiquitously expressed in NSCLC cells as determined via flow cytometric analysis.
Figure 3
Figure 3
Treatment with the aldehyde dehydrogenase (ALDH) inhibitor gossypol induces ATP depletion. (a) Effect of 10 μM of gossypol on ATP production in EKVX cells overexpressing various ALDH isoforms. Overexpression primer sets of ALDH isoforms are summarized in the Table 4. (b) Differences in the effect of 10 μM of gossypol on ATP production between non-small-cell lung cancer (NSCLC) cell lines and primary lung epithelial cells were tested. *P<0.05, **P<0.01, ***P<0.001 compared with control.
Figure 4
Figure 4
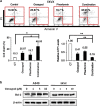
Gossypol combined with phenformin enhances cell cycle arrest and induces cell death in non-small-cell lung cancer (NSCLC). (a) G2/M transition of synchronized cells (following the protocol of a single thymidine block as shown in the upper panel) was monitored via mitotic index assessment (middle panel) and western blot analysis (lower panel) in the presence or absence of the indicated chemicals. Cyclin B1 is a marker for mitotic exit. pY15 of Cdk1 is a marker for the G2/M transition. (b) Effect of gossypol (10 μM), phenformin (100 μM) or a combined treatment for 24 h on the mitotic index of asynchronous cells. *P<0.05, **P<0.01, ***P<0.001 compared with vehicle control. (c) G1/S transition of synchronized cells (following the protocol of a single thymidine block as shown in the upper panel) was monitored via DNA FACS analysis (lower panel) in the presence or absence of the indicated chemicals. Note that EKVX cells were mainly arrested at the early S phase, whereas A549 cells were mainly arrested at the G1 phase. (d) To measure cell death, A549 and EKVX cells were treated with gossypol (10 μM), phenformin (100 μM), combination for 13 and 10 h, respectively. Cell death was measured by flow cytometric analysis. Data are representative of the mean and s.d. of three independent experiments. *P<0.05 compared with control.
Figure 5
Figure 5
Gossypol combined with phenformin induces cell death in non-small-cell lung cancer (NSCLC) associated with ATP depletion. (a) Effect of gossypol (10 μM), phenformin (100 μM) or a combined treatment for 48 h on cell death as determined via flow cytometric analysis and ATP production determined via ATP assay. (b) Effect of gossypol (10 μM), phenformin (100 μM) or a combined treatment on Bcl-2 expression in NSCLC cells was determined via immunoblotting. Data are representative of the mean and s.d. of three independent experiments. *P<0.05, **P<0.01 compared with control.

References

    1. Pao W, Chmielecki J. Rational, biologically based treatment of EGFR-mutant non-small-cell lung cancer. Nat Rev Cancer 2010; 10: 760–774. - PMC - PubMed
    1. Wong DW, Leung EL, So KK, Tam IY, Sihoe AD, Cheng LC et al. The EML4-ALK fusion gene is involved in various histologic types of lung cancers from nonsmokers with wild-type EGFR and KRAS. Cancer 2009; 115: 1723–1733. - PubMed
    1. Li X, Wan L, Geng J, Wu CL, Bai X. Aldehyde dehydrogenase 1A1 possesses stem-like properties and predicts lung cancer patient outcome. J Thorac Oncol 2012; 7: 1235–1245. - PubMed
    1. Jiang F, Qiu Q, Khanna A, Todd NW, Deepak J, Xing L et al. Aldehyde dehydrogenase 1 is a tumor stem cell-associated marker in lung cancer. Mol Cancer Res 2009; 7: 330–338. - PMC - PubMed
    1. Cancer Genome Atlas Research N Weinstein JN Collisson EA Mills GB Shaw KR Ozenberger BA et al. The Cancer Genome Atlas Pan-Cancer analysis project. Nat Genet 2013; 45: 1113–1120. - PMC - PubMed

Publication types

MeSH terms