. 2016 Nov 25:6:37945.
doi: 10.1038/srep37945.

Nitric oxide triggers a transient metabolic reprogramming in Arabidopsis

Affiliations

Nitric oxide triggers a transient metabolic reprogramming in Arabidopsis

José León et al. Sci Rep. .

Abstract

Nitric oxide (NO) regulates plant growth and development as well as responses to stress that enhanced its endogenous production. Arabidopsis plants exposed to a pulse of exogenous NO gas were used for untargeted global metabolomic analyses thus allowing the identification of metabolic processes affected by NO. At early time points after treatment, NO scavenged superoxide anion and induced the nitration and the S-nitrosylation of proteins. These events preceded an extensive though transient metabolic reprogramming at 6 h after NO treatment, which included enhanced levels of polyamines, lipid catabolism and accumulation of phospholipids, chlorophyll breakdown, protein and nucleic acid turnover and increased content of sugars. Accordingly, lipid-related structures such as root cell membranes and leaf cuticle altered their permeability upon NO treatment. Besides, NO-treated plants displayed degradation of starch granules, which is consistent with the increased sugar content observed in the metabolomic survey. The metabolic profile was restored to baseline levels at 24 h post-treatment, thus pointing up the plasticity of plant metabolism in response to nitroxidative stress conditions.


Figures
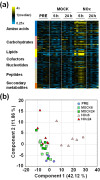
Figure 1
Figure 1. Metabolomic Changes after Applying an NO Pulse to Arabidopsis Plants.
(a) Heat map showing the increased (yellow) or decreased (blue) concentration of metabolites at the indicated times after treatment of plants (NO) or untreated (MOCK) control. (b) Principle Component Analysis (PCA) plot. Blue circles represent the samples before treatment, green squares the mock-treated samples and red triangles to NO treated samples at the indicated times after pulse.
Figure 2
Figure 2. Superoxide content reduction and post-translational modifications induced by NO.
(a) Control untreated seedlings (−NO) and NO-exposed seedlings (+NO) were stained with Nitroblue tetrazolium from 30 min to 20 h after treatment. (b) Nitration and S-nitrosyltion of proteins in NO-treated plants. Each lane was loaded with 10 μg of proteins. The marks and numbers at the right side of panels indicate the position of molecular weight markers in kDa. The general pattern of protein is shown by staining of a replicate gel with Imperial (Thermo Scientific). Blot replicates were probed with the antibodies indicated at the left side of panels. α3-nitroY, anti-3-nitrated-Y; αTMT, anti-Tandem Mass Tagged-S-nitrosylated proteins. Equal loading was checked by Coomassie-stained large subunit of Ribulose-1,5-Bisphosphate Carboxylase/Oxygenase (Rubisco) and by using αDET3, anti-De-Etiolated 3. Data shown are representative of three independent experiments with similar results.
Figure 3
Figure 3. Enhanced polyamine content in plants exposed to NO.
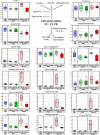
Scheme showing the biosynthesis of polyamines derived from the urea cycle and the box plots for every metabolite before treatment (blue) and at indicated times after mock- (green) or NO-treatment (red). Light and dark tones correspond to 6 h and 24 h, respectively, after treatment.
Figure 4
Figure 4. Altered phospholipid catabolism in plants by 6 h after exposure to NO.
Scheme showing the metabolism of phospholipids and the box plots for fatty acids and lipids before treatment (blue) and at indicated times after mock- (green) or NO-treatment (red). Light and dark tones correspond to 6 h and 24 h after treatment, respectively.
Figure 5
Figure 5. Alterations in the permeability of lipidic structures.
(a) Permeability of plasma membrane in roots of NO-treated plants. Untreated (−NO) or NO-treated (+NO) roots from wild type Col-0 plants were stained with propidium iodide at 30 min after exposure to NO. Images were obtained with a confocal microscope Leica TCS SL with excitation at 488 nm and emission at 598–650 nm range. Scale bars: 50 μm. (b) Effect of NO on leaf cuticle permeability. In the left panel, two drops of 10 μl of toluidine blue solution were applied on the upper side of undetached leaves from wild type Col-0 and NO-deficient nia1,2noa1-2 mutant plants. After 2 h, leaves were extensively washed with water, excised and photographed to show penetration or not of toluidine blue through cuticle. In the right panel, leaves from untreated (−NO) or NO-treated (+NO) plants were detached at 6 h after NO pulse, bleached with ethanol, stained for 1 min with calcolfluor white and extensively rinsed with water before photographed under UV light. Data shown are representative of five and three independent toluidine blue and calcofluor white experiments, respectively, with similar results.
Figure 6
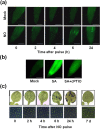
Figure 6. Endogenous NO content and cell death upon exposure to exogenous NO.
Seedlings (8 day-old) were treated with (a) exogenous NO or treated with air as control (Mock) and (b) mock treated or treated with 0.25 mM salicylic acid (SA) or with SA plus 1 mM 2-(4-Carboxyphenyl)-4,4,5,5-tetramethylimidazoline-1-oxyl-3-oxide (SA + cPTIO) for 1 h, and at the indicated times after exposure, the endogenous NO content was assayed by root staining with DAF-FM DA. Scale bars: 100 μm. (c) Cell death was assayed by Evans blue staining of plants at the indicated times after exposure to NO. Scale bars: 1 mm. The appearance of the plants for every time point is shown in the bottom panels. The experiments were repeated three times with similar results and representative images are shown.
Figure 7
Figure 7. Metabolites of glycolysis and TCA cycle in plants exposed to NO.
(a) Scheme showing the intermediate metabolites (in red increased content; in green reduced content) of the glycolysis and the TCA cycle and the box plots for every metabolite before treatment (blue) and at indicated times after mock- (green) or NO-treatment (red). Light and dark tones correspond to 6 h and 24 h, respectively, after treatment. (b) Starch granules were stained with Lugol´s reagent in 7-day old seedlings exposed to a 300 ppm NO pulse for the indicated times. Images for hypocotyls are representative of at least six independent plants per time point.

References

    1. Arc E., Galland M., Godin B., Cueff G. & Rajjou L. Nitric oxide implication in the control of seed dormancy and germination. Front. Plant Sci. 4, 346 (2013). - PMC - PubMed
    1. Beligni M. V. & Lamattina L. Nitric oxide stimulates seed germination and de-etiolation, and inhibits hypocotyl elongation, three light-inducible responses in plants. Planta 210, 215–221 (2000). - PubMed
    1. Lozano-Juste J. & León J. Nitric oxide regulates DELLA content and PIF expression to promote photomorphogenesis in Arabidopsis. Plant Physiol. 156, 1410–1123 (2011). - PMC - PubMed
    1. He Y. et al.. Nitric oxide represses the Arabidopsis floral transition. Science 305, 1968–1971 (2004). - PubMed
    1. Tsai Y. C., Delk N. A., Chowdhury N. I. & Braam J. Arabidopsis potential calcium sensors regulate nitric oxide levels and the transition to flowering. Plant Signal. Behav. 2, 446–454 (2007). - PMC - PubMed

Publication types

MeSH terms