

Multiple linear combination (MLC) regression tests for common variants adapted to linkage disequilibrium structure
- PMID: 27885705
- PMCID: PMC5245123
- DOI: 10.1002/gepi.22024
Multiple linear combination (MLC) regression tests for common variants adapted to linkage disequilibrium structure
Abstract
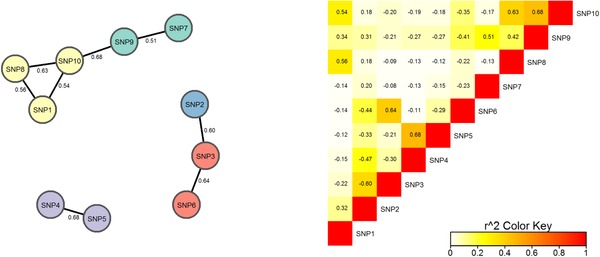
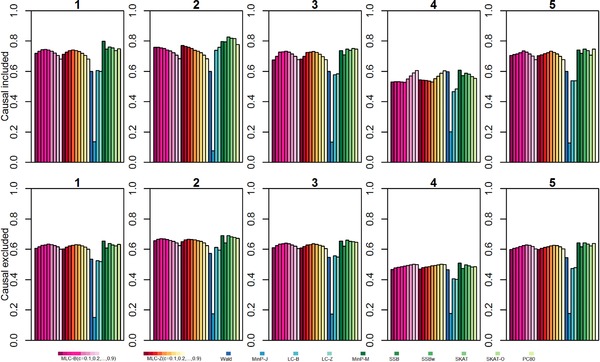
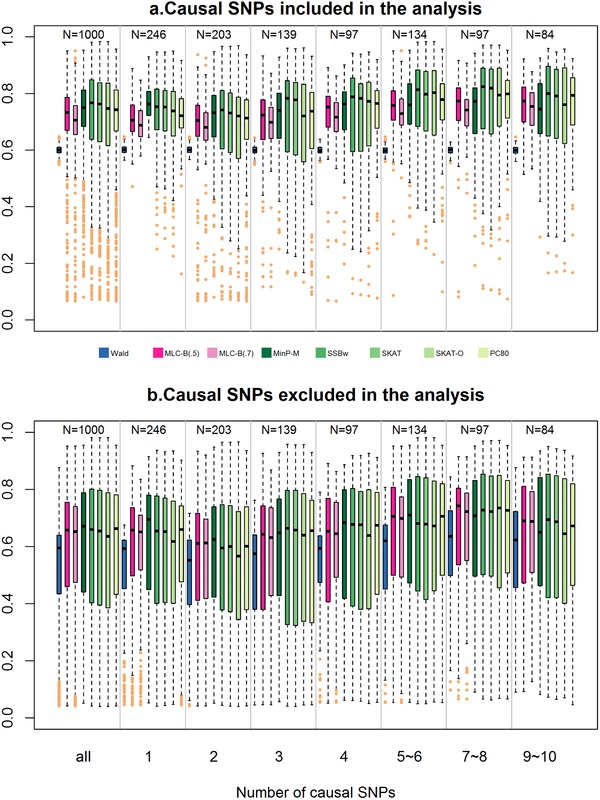
By jointly analyzing multiple variants within a gene, instead of one at a time, gene-based multiple regression can improve power, robustness, and interpretation in genetic association analysis. We investigate multiple linear combination (MLC) test statistics for analysis of common variants under realistic trait models with linkage disequilibrium (LD) based on HapMap Asian haplotypes. MLC is a directional test that exploits LD structure in a gene to construct clusters of closely correlated variants recoded such that the majority of pairwise correlations are positive. It combines variant effects within the same cluster linearly, and aggregates cluster-specific effects in a quadratic sum of squares and cross-products, producing a test statistic with reduced degrees of freedom (df) equal to the number of clusters. By simulation studies of 1000 genes from across the genome, we demonstrate that MLC is a well-powered and robust choice among existing methods across a broad range of gene structures. Compared to minimum P-value, variance-component, and principal-component methods, the mean power of MLC is never much lower than that of other methods, and can be higher, particularly with multiple causal variants. Moreover, the variation in gene-specific MLC test size and power across 1000 genes is less than that of other methods, suggesting it is a complementary approach for discovery in genome-wide analysis. The cluster construction of the MLC test statistics helps reveal within-gene LD structure, allowing interpretation of clustered variants as haplotypic effects, while multiple regression helps to distinguish direct and indirect associations.
Keywords: common variants; linkage disequilibrium; multibin linear combination test; multivariant test; quantitative trait.
© 2016 The Authors Genetic Epidemiology Published by Wiley Periodicals, Inc.
Figures
References
-
- Al‐Kateb, H. , Boright, A. P. , Mirea, L. , Xie, X. , Sutradhar, R. , Mowjoodi, A. , …; Diabetes Control and Complications Trial/Epidemiology of Diabetes Interventions and Complications Research Group . (2008). Multiple superoxide dismutase 1/splicing 19 factor serine alanine 15 variants are associated with the development and progression of diabetic nephropathy. Diabetes, 57, 218–228. - PMC - PubMed
-
- Bacanu, S‐A. (2012). On optimal gene‐based analysis of genome scans. Genetic Epidemiology, 3, 333–339. - PubMed
MeSH terms
Substances
LinkOut - more resources
Full Text Sources
Other Literature Sources
Research Materials
Miscellaneous
