. 2016 Nov 25:5:e20041.
doi: 10.7554/eLife.20041.

Connectivity map of bipolar cells and photoreceptors in the mouse retina

Affiliations

Connectivity map of bipolar cells and photoreceptors in the mouse retina

Christian Behrens et al. Elife. .

Abstract

In the mouse retina, three different types of photoreceptors provide input to 14 bipolar cell (BC) types. Classically, most BC types are thought to contact all cones within their dendritic field; ON-BCs would contact cones exclusively via so-called invaginating synapses, while OFF-BCs would form basal synapses. By mining publically available electron microscopy data, we discovered interesting violations of these rules of outer retinal connectivity: ON-BC type X contacted only ~20% of the cones in its dendritic field and made mostly atypical non-invaginating contacts. Types 5T, 5O and 8 also contacted fewer cones than expected. In addition, we found that rod BCs received input from cones, providing anatomical evidence that rod and cone pathways are interconnected in both directions. This suggests that the organization of the outer plexiform layer is more complex than classically thought.

Keywords: bipolar cell; computational biology; connectivity; connectomics; mouse; neural circuit; neuroscience; photoreceptor; retina; systems biology.


Conflict of interest statement

The authors declare that no competing interests exist.

Figures

Figure 1.
Figure 1.. Identification of S- and M-cones.
(A) Scheme showing vertical section through the mouse retina. (B) Volume-reconstructed cones and all CBC4 cells. (C) Cone pedicles (grey) with CBC9s. BC soma localization is indicated by colored dots. Dashed outlines indicate incomplete cones. (D) Same as in C, but with putative S-cones (blue) and M-cones (green) highlighted. Unidentified cones are shown in grey. Insets indicate the location of the examples shown below of cone pedicles contacted by CBC9 dendrites. (E) Contact parameters used for S-cone identification. ONL, outer nuclear layer; OPL, outer plexiform layer; INL, inner nuclear layer; IPL, inner plexiform layer; GCL, ganglion cell layer. DOI: http://dx.doi.org/10.7554/eLife.20041.002
Figure 1—figure supplement 1.
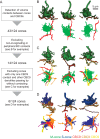
Figure 1—figure supplement 1.. Details on the identification of S-cones.
(A) Diagram showing workflow for identification of S- and M-cones using connectivity with CBC9 cells. (B–D) Side view and horizontal projection of representative examples of cone pedicles (green, M-cone; blue, S-cone) with CBC9 dendrites (yellow, orange, red) with non-invaginating but peripheral contacts (B), with only one CBC9 contact and other CBC9 dendrites passing by (C) and ‘true’ S-cones (D). DOI: http://dx.doi.org/10.7554/eLife.20041.003
Figure 2.
Figure 2.. Classification of cone contacts.
(A) Invaginating ON-CBC contact. Schematic drawing (left), EM side view (center) and top view (right). Red and dark grey, BC dendrites; light grey, horizontal cell dendrites; cyan, cone pedicles. (B) Basal/flat OFF-CBC contact as in A. (C) Peripheral (non-synaptic) BC contact as in A. (D–F) Contact area (D) eccentricity (E) contact height (F) of invaginating/basal and non-synaptic contacts for OFF-/ON-CBCs and rod bipolar cells (RBCs). (GI) Contact area versus eccentricity for OFF-CBC (G), ON-CBC (H) and RBC (I) contacts indicating correctly and incorrectly classified contacts. DOI: http://dx.doi.org/10.7554/eLife.20041.004
Figure 2—figure supplement 1.
Figure 2—figure supplement 1.. Illustration of parameters used for classifying contacts.
Cone pedicle schemes showing the parameter used for automated contact classification: Contact area (a), eccentricity (b), contact height (c), distances to branch point (d) and dendritic tip (e), smallest angle between contacting dendrite and optical axis (f) and number of contact points between cone pedicle and BC (g). Example invaginating and peripheral contacts between cone (cyan) and BC dendrite(s) (red) are shown as large and small yellow circles, respectively. The optical axis is defined as a perpendicular through the center of the cone pedicle. BC, bipolar cell. DOI: http://dx.doi.org/10.7554/eLife.20041.005
Figure 2—figure supplement 2.
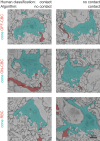
Figure 2—figure supplement 2.. Examples for disagreements between human and algorithmic classification.
EM slices (side view) showing examples of contacts where the automated contact classification did not match the human label. See also animated versions (Video 1 and 2). DOI: http://dx.doi.org/10.7554/eLife.20041.006
Figure 3.
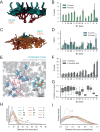
Figure 3.. Quantification of cone-to-CBC contacts.
(A) Volume-reconstructed single BC dendrite (red) contacting numerous cone pedicles (cyan). (B) Number of S- and M-cones contacted by different CBC types. (C) Volume-reconstructed single cone (cyan) contacted by multiple BCs (orange/red). (D) Number of CBCs per type contacted by individual S- and M-cones. (E) Example cone array with CBC6 and CBC8 contacting cones. Grey, non-contacted cones; blue, contacted cones. (F) Number of contacted cones and cones within dendritic field for different CBC types. (G) Fraction of contacted cones/cones within the dendritic field. (H) Kernel density estimate of the distribution of contacted cones as function of distance from BC somata. (I) Same as H. but distance normalized by dendritic field size. Bars in B,D,F indicate 95% CI. DOI: http://dx.doi.org/10.7554/eLife.20041.010
Figure 3—figure supplement 1.
Figure 3—figure supplement 1.. Classification of type 5 BCs.
(A) First three PCA components for CBC5 density profiles in the IPL. (B) Stratification depth of CBC5T, 5O and 5I axon terminals in relation to the OFF- and ON-ChAT bands. (C) Dendritic (top) and axonal (bottom) mosaics for CBC5T, 5O and 5I cells. DOI: http://dx.doi.org/10.7554/eLife.20041.011
Figure 3—figure supplement 2.
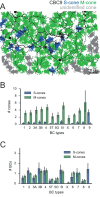
Figure 3—figure supplement 2.. Connectivity analysis for alternative s-cone classification.
(A) Cone pedicle array with CBC9s highlighted showing alternative S-cone classification. CBC9 somata are indicated by black dots, S-cones in blue, M-cones in green and unidentified cones in grey. (B) Number of S- and M-cones contacted by different CBC types. (C) Number of CBC types contacted by individual S- and M-cones. DOI: http://dx.doi.org/10.7554/eLife.20041.012
Figure 3—figure supplement 3.
Figure 3—figure supplement 3.. Example of a passing dendrite without contacts.
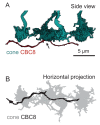
(A) Side view of four volume-reconstructed cone pedicle (cyan) and CBC8 dendrite (red). (B) Horizontal projection of the neurite structures shown in (A). Arrow indicates the only invaginating ON-CBC contact along the dendrite. DOI: http://dx.doi.org/10.7554/eLife.20041.013
Figure 4.
Figure 4.. CBCX makes few and atypical cone contacts.
(A) Volume-reconstructed CBCX dendritic arbor (red) contacting few cone pedicles (cyan, invaginating contact; grey, tip contact). (B) Same exemplary cone array as in A. with CBCX dendritic arbor contacting cones. Light grey, non-contacted cones; cyan, invaginating contacts; dark grey, tip contacts. (C) EM image showing tip contact between CBCX (red) and cone pedicles (cyan), top view (left) and side view (right). (D) Invaginating and tip contacts in CBCXs and other ON-CBCs. Bars in D. indicate 95% CI. DOI: http://dx.doi.org/10.7554/eLife.20041.014
Figure 5.
Figure 5.. Cones contact rod bipolar cells.
(A) Volume-reconstructed RBC (red) contacting both rods (magenta) and cone pedicles (cyan). (B) EM images showing invaginating contact between cone (cyan) and RBC (red), side view (top) and top view (bottom). (C) Number of RBCs contacted by cones. (D). Number of RBCs contacted by S- and M cones. (E) Number of cones contacted by RBCs. Bars in D. indicate 95% CI. DOI: http://dx.doi.org/10.7554/eLife.20041.015
Figure 5—figure supplement 1.
Figure 5—figure supplement 1.. Excluded RBCs.
(A–C) Three BCs classified as RBCs by Helmstaedter et al. (2013) but not contacting rods in the present study, these cells were therefore excluded from the analysis (for each cell two projections from different angles are shown). (D) BC classified as CBC9 but excluded from this study due to lack of complete dendritic tree. DOI: http://dx.doi.org/10.7554/eLife.20041.016
Figure 5—figure supplement 2.
Figure 5—figure supplement 2.. No evidence for two RBC subtypes.
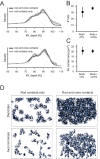
(A) Relative density of RBC spherules in the IPL using both dendritic ON and OFF starburst amacrine cell (SAC) bands (top) and only the dendritic ON SAC band (bottom) for depth correction (shading: SEM). (B) Number of rods contacted by RBCs contacting only rods or both rods and cones (95% confidence interval, CI). (C) Contact area with AIIs for RBCs contacting only rods or both rods and cones (95% CI). (D) Dendritic (top) and axonal (bottom) mosaics for RBCs contacting rods or both rods and cones. DOI: http://dx.doi.org/10.7554/eLife.20041.017
Figure 6.
Figure 6.. Rods contact RBCs and OFF-CBCs.
(A) Volume-reconstructed, neighboring rod spherules (right) in one half of the field of the reconstructed cone pedicles (left). (B) Rod spherule (magenta) with invaginating dendrites of two RBCs (orange, red). Schematic drawing (left), EM images side view (middle) and top view (right). (C) Rod spherule (magenta) with basal contacts by OFF-CBCs (yellow). Schematic (left), volume-reconstructed vertical view (middle), EM image with top view (right). The latter also shows an invaginating RBC dendrite (red). (DF). Number of rods (and fraction) contacted by RBCs (D,E), and OFF-CBC types (D, F). Bars in D. indicate 95% CI. DOI: http://dx.doi.org/10.7554/eLife.20041.018
Figure 6—figure supplement 1.
Figure 6—figure supplement 1.. Classification of rod contact classification.
Contact area versus distance to RBC contact point for OFF-CBC-rod contacts (A) and contact area versus eccentricity for RBCs (B) contacts indicating correctly and incorrectly classified contacts. DOI: http://dx.doi.org/10.7554/eLife.20041.019
Figure 7.
Figure 7.. Connectivity between cone and rod photoreceptors and bipolar cells in the mouse retina.
Representative examples of bipolar cell types in the mouse retina are shown. The number of cones in the dendritic field number and contacted photoreceptors are given for each type. DOI: http://dx.doi.org/10.7554/eLife.20041.020

Similar articles

Cited by

References

    1. Baden T, Schubert T, Chang L, Wei T, Zaichuk M, Wissinger B, Euler T. A tale of two retinal domains: near-optimal sampling of achromatic contrasts in natural scenes through asymmetric photoreceptor distribution. Neuron. 2013;80:1206–1217. doi: 10.1016/j.neuron.2013.09.030. - DOI - PubMed
    1. Bishop CM. Pattern Recognition and Machine Learning. New York: Springer; 2006.
    1. Blakemore CB, Rushton WA. Dark adaptation and increment threshold in a rod monochromat. The Journal of Physiology. 1965;181:612–628. doi: 10.1113/jphysiol.1965.sp007786. - DOI - PMC - PubMed
    1. Bloomfield SA, Dacheux RF. Rod vision: pathways and processing in the mammalian retina. Progress in Retinal and Eye Research. 2001;20:351–384. doi: 10.1016/S1350-9462(00)00031-8. - DOI - PubMed
    1. Bloomfield SA, Xin D, Osborne T. Light-induced modulation of coupling between aii amacrine cells in the rabbit retina. Visual Neuroscience. 1997;14:565–576. doi: 10.1017/S0952523800012220. - DOI - PubMed

Publication types