. 2016 Nov 25:5:e19271.
doi: 10.7554/eLife.19271.

Mapping out Min protein patterns in fully confined fluidic chambers

Affiliations

Mapping out Min protein patterns in fully confined fluidic chambers

Yaron Caspi et al. Elife. .

Abstract

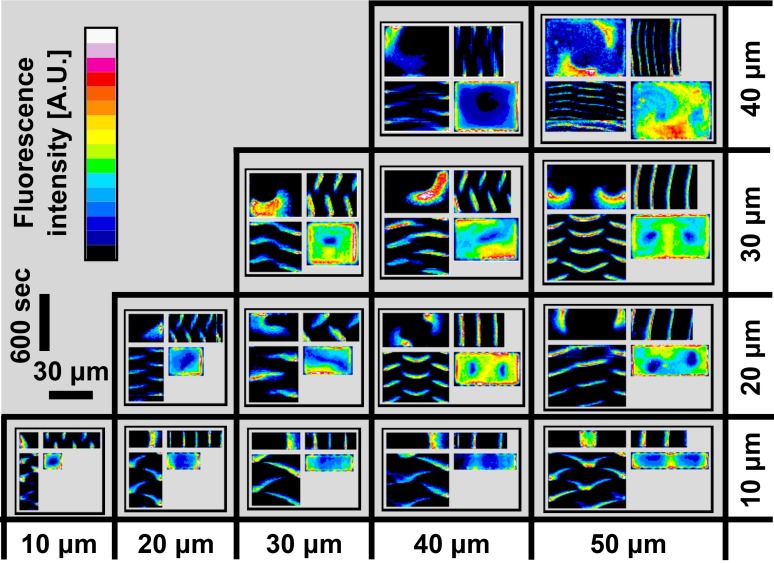
The bacterial Min protein system provides a major model system for studying reaction-diffusion processes in biology. Here we present the first in vitro study of the Min system in fully confined three-dimensional chambers that are lithography-defined, lipid-bilayer coated and isolated through pressure valves. We identify three typical dynamical behaviors that occur dependent on the geometrical chamber parameters: pole-to-pole oscillations, spiral rotations, and traveling waves. We establish the geometrical selection rules and show that, surprisingly, Min-protein spiral rotations govern the larger part of the geometrical phase diagram. Confinement as well as an elevated temperature reduce the characteristic wavelength of the Min patterns, although even for confined chambers with a bacterial-level viscosity, the patterns retain a ~5 times larger wavelength than in vivo. Our results provide an essential experimental base for modeling of intracellular Min gradients in bacterial cell division as well as, more generally, for understanding pattern formation in reaction-diffusion systems.

Keywords: E. coli; Microfluidics; Min system; biophysics; in vitro reconstitution; pattern formation; reaction-diffusion; structural biology.


Conflict of interest statement

The authors declare that no competing interests exist.

Figures

Figure 1.
Figure 1.. Chip structure and basic modes of Min patterns.
(a) Top view illustration of the microfluidic device structure. We study Min protein pattern formation in totally enclosed microfluidic chambers. Each chamber (blue) is 2.4 µm high with a width ranging from 10 to 60 µm and a length ranging from 10 to 90 µm. Each chamber is connected through small connector lines (green, with a cross-section of ∼0.9 × 0.9 µm) from both sides to two ∼30 µm deep reservoirs channels (red). A top layer of pressurized microfluidic valves (gray shading) are placed above the reservoirs channels. After the walls of the chambers are coated with a lipid bilayer, MinD and MinE proteins are injected into the device. Subsequently, the valves above the reservoir channels are closed. Consequently, the rectangular chambers (including the connector lines) are separated from the rest of the device. This unique structure allows studying the 3D geometric selection rules of the Min system in vitro. (b) 3D illustration of the microfluidic device structure. Chambers are in blue, connector lines in green, and reservoir channels in red. For clarity, the pressure valves are not shown. (c) SEM image of the silicon wafer master that was used in order to replicate the chambers, connector lines and reservoir channels into PDMS. Note that the fabrication was done with a positive resist and, thus, we have used a double replica method in order to recover the right orientation of the chambers (see Materials and methods). (d–f) Characterization of dynamical Min patterns observed in the confined fluidic chambers. (d) Oscillations - Min proteins periodically move back and forth between two poles of the chamber. (e) Traveling waves - Min proteins wave fronts continuously propagate from one side of the chamber to the other. (f) Rotations - Min zone circulates around a fixed point in the chamber. Scale bar 40 μm applied to all three examples (d–f). Fluorescence signals represent MinE patterns. DOI: http://dx.doi.org/10.7554/eLife.19271.003
Figure 1—figure supplement 1.
Figure 1—figure supplement 1.. Schematics of chip fabrication and operation.
(a) Illustration of the fabrication process of the microfluidic device. First, a top layer PDMS chip is bound to a thin PDMS membrane via plasma treatment and a high-temperature baking. Next, a lower layer PDMS chip with the chambers is bound to a glass coverslip in the same way. Finally, the two parts are aligned and bound to each other in the same way. (b) An illustration of the operation of the chip in order to obtain closed microfluidic chambers. First, the chip is coated with a supported lipid bilayer. Next, Min proteins are infused in the chambers. Finally, the upper layer valves are pressurized with air. As results, one can study the behavior of the Min proteins in confined isolated fluidic volumes. DOI: http://dx.doi.org/10.7554/eLife.19271.004
Figure 1—figure supplement 2.
Figure 1—figure supplement 2.. SEM images of two different areas in the lower layer PDMS chip.
DOI: http://dx.doi.org/10.7554/eLife.19271.005
Figure 1—figure supplement 3.
Figure 1—figure supplement 3.. Schematic representation of the overall lower layer chip structure.
A series of three dimensional closed rectangle chambers. Chambers and lines are in blue. Connector lines are in green, and deep reservoirs channels are in red. DOI: http://dx.doi.org/10.7554/eLife.19271.006
Figure 2.
Figure 2.. Atlas of the Min system behavior in 3D confined chambers.
We represent the dynamical Min behavior in each case as a quadrant. (a) Illustration of the quadrant scheme. Each quadrant is composed of (upper left) A single frame from a movie that captures the behavior of the Min system in a specific chamber at a specific point of time; (lower right) A temporal standard deviation picture of the movie; (lower left) an Xt-kymograph of the middle line cross-section of the chamber along the red line in the upper left movie frame image, and (upper right) a Yt-kymograph of a middle line cross-section of the chamber along the blue line in the upper left movie frame image. (bd) Illustrative examples of the three pure genera of Min dynamics that were observed. (b) Oscillations. (c) Traveling waves, and (d) Rotations. (e) Table representing real examples of observed Min dynamics in the chambers, organized according to the quadrant scheme. Each image is color coded in a 16-colors look-up table as shown in the legend. Scale bar represents 30 μm in the x and y directions and 600 s for the Xt and Yt kymographs. A detailed explanation for the quadrant representation of the Min pure and non-pure behaviors is found in the main text. Fluorescence signals represent MinE patterns. DOI: http://dx.doi.org/10.7554/eLife.19271.008
Figure 2—figure supplement 1.
Figure 2—figure supplement 1.. A zoom-in of the atlas of the Min system behavior in 3D confined chambers.
This figure represents a zoom of Figure 2e. Typical examples of the Min protein behavior in smaller chambers are thus shown at larger magnification for clarity. The format of figure follows the same quadrant representation. For more details see the main text. Fluorescence signals represent MinE patterns. DOI: http://dx.doi.org/10.7554/eLife.19271.009
Figure 3.
Figure 3.. Preferred dynamical Min behavior as a function of the chamber-geometry parameters.
(ac) Geometry selection at room temperature. (a) Selection according to the chamber aspect ratio. (b) Selection according to chamber width. (c) Selection according to chamber length. All measurements were preformed at room temperature on a DOPC:DOPG (67:33) SLB supplemented with 0.03 of TopFluor Cardiolipin. The number of chambers observed with the specific geometrical characteristics are indicated above each bar. (df) Same as (ac) for measurements that were preformed at 37°C on an E. coli polar lipid extract SLB. The analysis is based on the fluorescence signals of MinE. DOI: http://dx.doi.org/10.7554/eLife.19271.011
Figure 3—figure supplement 1.
Figure 3—figure supplement 1.. Min patterns geometry selection rules based on chambers size.
Geometry selection of the Min patterns according to the chamber size for measurements at room temperature over DOPC:DOPG SLB membrane (a), and at 37°C with E. coli polar lipids extract SLB (b). Color code, as in Figure 3. DOI: http://dx.doi.org/10.7554/eLife.19271.012
Figure 4.
Figure 4.. Phase diagram of the Min patterns.
(a) Phase diagram of the Min behavior at room temperature. Each square represents the most abundant behavior in that geometry. Color code is shown on the right. (bd) Relative abundance of the pole-to-pole oscillations, rotations and traveling waves in each chamber size. Color code for (bd) is shown on the right. (e) Phase diagram of Min behavior at 37°C. Color code is the same as in (a). The analysis is based on the fluorescence signals of MinE. DOI: http://dx.doi.org/10.7554/eLife.19271.013
Figure 4—figure supplement 1.
Figure 4—figure supplement 1.. Number of chambers that were used per each tile for constructing Figure 4a–d.
DOI: http://dx.doi.org/10.7554/eLife.19271.014
Figure 4—figure supplement 2.
Figure 4—figure supplement 2.. Detailed analysis of the phase diagram at elevated temperature (Figure corresponding to Figure 4e).
(a) Relative abundance of the oscillatory behavior for each chamber size. Color code is defined in the legend to the right. (b) Same as (a) for rotations. (c) Same as (a) for traveling waves. (d) Number of chambers that were used per each tile for constructing Figure 4e and panels (ac). DOI: http://dx.doi.org/10.7554/eLife.19271.015
Figure 5.
Figure 5.. Concentration of the Min proteins.
(a) Histogram of the deduced concentration of MinE and MinD in the chambers. (b) Idem for the ratio of MinE to MinD. Lines are guides to the eye. Concentration was measured using a GFP protein as a standard as described in the Materials and methods. DOI: http://dx.doi.org/10.7554/eLife.19271.016
Figure 5—figure supplement 1.
Figure 5—figure supplement 1.. Calibration curves for the fluorescence intensity of (a) MinD, (b) MinE, and (c) GFP, as collected with a fluorometer.
Stock solution of MinD-Cy3 (14 μM) or MinE-Cy5 (25 μM) were diluted at various values and the resulted fluorescence was recorded on a Carry eclipse fluorometer. The same procedure was repeated for GFP. DOI: http://dx.doi.org/10.7554/eLife.19271.017
Figure 6.
Figure 6.. Wavelenght and Min patterns front propagation velocity.
(a) Statistical box plot representing the wavelength of the Min waves at different conditions: at room temperature and at 37°C, at flat SLB (blue) as well as inside the 3D confined chambers (red), and with high viscous medium in the chambers (at room temperature). The lines of each box represent the location of the 25, 50, and 75 percentiles. Full squares represent the location of the mathematical mean. Whiskers represent the 5 – 95 percentile range and the diamonds the minimum and maximum values of the data. (b) Velocity of Min pattern propagation at the same conditions. Box representation is the same as in (a). The analysis is based on the fluorescence signals of MinE. DOI: http://dx.doi.org/10.7554/eLife.19271.018
Figure 6—figure supplement 1.
Figure 6—figure supplement 1.. Examples of traveling waves in the chambers in the presence of a viscous media at 9.85 cP.
MinD (1.1 µM), MinE (1 µM), ATP (5 µM together with an ATP-regeneration system in a crowding solution (4% BSA, 4% PEG8000 and 4% Ficol 400) were injected into the chamber device. The panels show the MinE fluorescence signal. (a) and (e) Montage of the MinE signal in two chambers. Time difference between frames is 60 s. In order to calculate the wavelength, a self-written Matlab code was used (see Materials and methods section). A line was drawn manually along the wave propagation direction and the fluorescence intensity along this line was recorded and normalized for each frame. (b) and (f) Corresponding kymographs for (a) and (e) that were used in order to calculate the wavelength and the wave velocity. Wavelength was calculated by fitting a Gaussian function to the distribution of distances between the intensity peaks of these kymographs. Velocity was calculated based on the angle of the intensity peaks along the kymographs temporal direction. Wavelengths are equal to 20 ± 3 µm and 18 ± 0.7µm for (a) and (e) respectively. Velocities are equal to 0.024 ± 0.001 µm/s and 0.024 ± 0.001 µm/s for (a) and (e) respectively. (c) and (g) Normalized fluorescence intensity along the green line in panels (b) and (f) respectively. (d) and (h) Quadrant representation on the Min behavior in these two chambers. Format of the representation is similar to the one in Figure 2e. Scale bars for all panels (30 µm and 400 s) are shown on the bottom right. DOI: http://dx.doi.org/10.7554/eLife.19271.019

Similar articles

Cited by

References

    1. Arjunan SN, Tomita M. A new multicompartmental reaction-diffusion modeling method links transient membrane attachment of E. coli MinE to E-ring formation. Systems and Synthetic Biology. 2010;4:35–53. doi: 10.1007/s11693-009-9047-2. - DOI - PMC - PubMed
    1. Bonny M, Fischer-Friedrich E, Loose M, Schwille P, Kruse K. Membrane binding of MinE allows for a comprehensive description of Min-protein pattern formation. PLoS Computational Biology. 2013;9:e1003347. doi: 10.1371/journal.pcbi.1003347. - DOI - PMC - PubMed
    1. Brian AA, McConnell HM. Allogeneic stimulation of cytotoxic T cells by supported planar membranes. PNAS. 1984;81:6159–6163. doi: 10.1073/pnas.81.19.6159. - DOI - PMC - PubMed
    1. Caspi Y. Deformation of filamentous Escherichia coli cells in a microfluidic device: a new technique to study cell mechanics. PLoS One. 2014;9:e83775. doi: 10.1371/journal.pone.0083775. - DOI - PMC - PubMed
    1. Corbin BD, Yu XC, Margolin W. Exploring intracellular space: function of the Min system in round-shaped Escherichia coli. The EMBO Journal. 2002;21:1998–2008. doi: 10.1093/emboj/21.8.1998. - DOI - PMC - PubMed

MeSH terms

LinkOut - more resources